

Abstract
The concentration-dependence of the diffusion and sedimentation coefficients (kD and ks, respectively) of a protein can be used to determine the second virial coefficient (B2), a parameter valuable in predicting protein-protein interactions. Accurate measurement of B2 under physiologically and pharmaceutically relevant conditions, however, requires independent measurement of kD and ks via orthogonal techniques. We demonstrate this by utilizing sedimentation velocity (SV) and dynamic light scattering (DLS) to analyze solutions of hen-egg white lysozyme (HEWL) and a monoclonal antibody (mAb1) in different salt solutions. The accuracy of the SV-DLS method was established by comparing measured and literature B2 values for HEWL. In contrast to the assumptions necessary for determining kD and ks via SV alone, kD and ks were of comparable magnitudes, and solution conditions were noted for both HEWL and mAb1 under which 1), kD and ks assumed opposite signs; and 2), kD ≥ ks. Further, we demonstrate the utility of kD and ks as qualitative predictors of protein aggregation through agitation and accelerated stability studies. Aggregation of mAb1 correlated well with B2, kD, and ks, thus establishing the potential for kD to serve as a high-throughput predictor of protein aggregation.
Introduction
The second viral coefficient, B2, is a measure of weak solute-solute interactions resulting from nonideal solution behavior (1,2). Negative B2 values are interpreted to indicate the presence of weak, net-attractive forces between solute molecules while positive values are taken to reflect weak repulsive forces. From a physiological perspective, B2 values and protein-protein interactions, in general, are being increasingly studied to better understand protein assembly processes and fibril formation in various neurodegenerative diseases and disorders (3–7). The B2 has found significant utility in predicting solution conditions that favor protein crystallization (8). In the 1990s, George and Wilson (2) demonstrated that a narrow range of negative B2 values, termed the crystallization slot, correlated well with the crystallization propensity of proteins. There is also interest in using B2 as a predictor of colloidal stability and protein aggregation in pharmaceutically relevant process streams and products (9–12). Consequently, several methods that employ x-ray, neutron or static-light scattering (13,14), sedimentation equilibrium (15,16), size-exclusion chromatography (SEC) (17–19), or self-interaction chromatography (SIC) (20,21) have been described for measuring the B2.
Another approach for determining B2 is to employ its relationship to the diffusion and sedimentation interaction parameters, kD and ks (Eq. 1), as developed by Harding and Johnson (22),
| (1) |
In Eq. 1, M is the molecular mass and the partial specific volume. The sedimentation and diffusion interaction parameters kD and ks are determined from the first-order, concentration dependence of the diffusion (D) and sedimentation (s) coefficients respectively, as shown in Eqs. 2 and 3, in which D0 and s0 represent the coefficients of the solute at infinite dilution,
| (2) |
| (3) |
Modern dynamic light scattering (DLS) instruments (23–25) and programs for the analysis of sedimentation velocity (SV) data (26–28) facilitate rapid and accurate determination of D and s, and thus kD and ks.
Solovyova et al. (29) have argued that both ks and kD, and hence B2, can be reliably determined from SV experiments alone. The authors' analysis relies on solution conditions under which ks > kD, and ks and kD have the same sign (either both +ve or –ve). While this may hold true under certain solution conditions (e.g., molar concentrations of salt), under physiologically relevant conditions ks and kD are often of comparable magnitudes and can bear opposite signs. Therefore, concentration dependences of D and s need to be determined independently via orthogonal techniques. We demonstrate this with B2 values for hen-egg white lysozyme (HEWL) obtained using SV and DLS experiments.
The utility of B2 for predicting colloidal stability of proteins is well recognized; however, its measurement has been nontrivial. This is primarily because the classical sedimentation equilibrium and static light scattering (SLS) techniques are resource-intensive and may not be suitable for high-throughput application. SLS measurements, used more commonly for this purpose, are affected by presence of dust particles and require rigorous sample cleaning procedures. In contrast, the measurement of kD, especially on instruments that utilize back-scattering technology, is possible with significantly less interference from dust particles. In this work, we demonstrate that kD measurements provide an alternative high-throughput tool for predicting the colloidal stability of proteins and for screening studies to identify solution conditions that minimize protein aggregation. In support of our thesis, we present heat- and agitation-induced aggregation data for an IgG2 monoclonal antibody (mAb1) in different solutions along with the corresponding B2 and kD measurements as predictors of mAb1 aggregation.
Materials and Methods
Materials
Hen-egg white lysozyme (HEWL; Cat. No. L7651) was obtained from Sigma (St. Louis, MO). Bulk drug lot of an IgG2 monoclonal antibody (mAb1) was received from the Amgen Process Development group at a concentration of 70 mg/mL in 10 mM acetate with 9% (w/v) sucrose at pH 5.2 (A52Su). The formula molecular mass for mAb1 is 148 kDa and the pI is 8.8. All other chemicals used in the preparation of buffers were of analytical grade or better.
Methods
Sample preparation
Second virial coefficient measurements for HEWL were conducted in solutions containing 10 mM acetate at pH 4.6 (A46) and 100–400 mM sodium chloride. First, a HEWL stock solution was prepared by mixing the lyophilized protein powder in a given acetate-NaCl solution to achieve a concentration of ∼60 mg/mL. The HEWL stock solution was subjected to further buffer exchange by passing it through an Illustra NAP-5 (GE Healthcare, Piscataway NJ) gel filtration column equilibrated with a given acetate-NaCl solution. The eluate was mixed with an appropriate volume of the acetate-NaCl solution to generate a series of HEWL samples ranging from 3 to 22 mg/mL.
For mAb1, B2 measurements were conducted in a 10 mM acetate buffer at pH 5.0 (A5) containing various Hofmeister salts. The salts tested in the study were sodium chloride (0–100 mM), sodium acetate (50 mM), sodium iodide (50 mM), and sodium thiocyanate (50 mM). For each solution condition tested, the mAb1 bulk at ∼70 mg/mL protein in A52Su was desalted and buffer exchanged into the desired buffer using Illustra NAP-5 columns (GE Healthcare). The eluate from the NAP-5 column, with ∼35 mg/mL protein, was mixed with an appropriate volume of buffer to generate a series of protein concentrations between 1 mg/mL and 16 mg/mL. Additional measurements were conducted for mAb1 in propionate, glutamate, succinate, and citrate buffers (50 mM) at pH 5.0 with no added salt. Samples were prepared similar to those in acetate buffer. All stock solutions containing buffering agents were prepared from the acid form of the buffer and adjusted to the desired pH using sodium hydroxide.
Dynamic light scattering
Dynamic light scattering (DLS) experiments were conducted using the Zetasizer Nano ZS (Malvern Instruments, Worcestershire, UK). Measurements were conducted at 25°C for HEWL and 20°C for mAb1. One-hundred microliters of a given protein solution was placed in a disposable DTS1060 folded-capillary cuvette (also from Malvern Instruments) and analyzed in the DLS mode for measurement of the diffusion coefficient. Twenty 10 s measurements were averaged for a given protein solution to determine the diffusion coefficient.
Sedimentation velocity
Sedimentation velocity experiments were performed using a ProteomeLab XL-I analytical ultracentrifuge. (Beckman-Coulter, Brea, CA). Samples were centrifuged at 50,000 RPM at 25°C for HEWL and 20°C for mAb1. For both proteins, 12-mm pathlength cells were used except for the two highest concentrations which were analyzed using 3-mm pathlength cells. Sedimentation was monitored using the interference optical system. The software programs SEDFIT (HEWL) and DCDT+ (mAb1) were employed to analyze the SV data. The weight-average sedimentation coefficients were determined from the c(s) distributions (27) and g(s∗) analyses (26).
Quiescent storage accelerated stability study
Accelerated stability studies were performed with 10 mg/mL mAb1 in: 1), 10 mM acetate, pH 5.0 with 50 mM sodium-anion (CH3COO−, Cl−, I−, and SCN−) salts and 2), 50 mM propionate, glutamate, succinate, or citrate, pH 5.0 with no added salt. The protein solutions were sterile filtered into 3-cc vials using 0.22-μm cellulose-acetate filters and placed at 45°C for a period of 15 weeks. The change in %-monomer remaining in solution was determined by size-exclusion chromatography. The loss in %-monomer was concomitant with an increase in the % aggregates.
Size-exclusion chromatography
Size-exclusion chromatography (SEC) was performed on a model No. 1100 HPLC system (Agilent, Santa Clara, CA). The samples (35 μg load) were injected into a Tosoh Bioscience (Montgomeryville, PA) TSKG3000SW×l column (5μm 7.8 × 300 mm, Cat. No. CHO-1252) and separated with an isocratic elution using a mobile phase consisting of 100 mM sodium phosphate, 250 mM sodium chloride, pH 6.8 at a flow rate of 0.5 mL/min. The detection was performed by monitoring ultraviolet absorbance at 235 nm. The chromatogram was divided into regions representing the protein monomer, high-molecular-weight species, and low-molecular-weight species. Their respective areas were calculated relative to the total area of the three regions. The recovery (total integration area of the three assigned regions) was also monitored throughout the study.
Agitation studies
To accelerate particle formation, agitation studies were conducted on an analog orbital shaker (VWR, West Chester, PA) operating at 500 rpm for 64 h at room temperature. Solutions (70 mg/mL mAb1) in A5 buffer with NaCl (0, 50, 100, or 150 mM) were sterile filtered through 0.22-μm cellulose acetate filters into 3-cc vials. A Nalgene (Rochester, NY) polycarbonate box containing a foam insert, modified to hold 16 evenly spaced 3-cc vials, was used to secure the vials. Four vials were prepared for each salt concentration and all 16 vials were agitated simultaneously in a single run.
Turbidity measurements
The turbidity of mAb1 solutions post agitation was determined by monitoring the optical density at 360 nm. The measurements were performed on a model No. 8453 ultraviolet spectrophotometer (Agilent, Santa Clara, CA) using a 70-μL quartz cuvette with a path length of 1 cm. The samples were appropriately diluted to maintain the optical density below 1. Solution turbidity was calculated by correcting for dilution.
Results and Discussion
The second virial coefficient from diffusion and sedimentation interaction parameters: accuracy and the need for independent measurement of ks and kD
The D and s values for HEWL were measured by DLS and SV respectively, in 10 mM acetate, pH 4.6 (A46) buffer with varying concentrations (c) of NaCl. For all the conditions tested, both D-versus-c (Fig. 1 A) and 1/s-versus-c (Fig. 1 B) plots exhibited finite slopes indicative of solution nonideality. The plot could be further analyzed using Eqs. 2 and 3. The D0 and s0 values calculated from the y intercepts range from 123 to 125 μm2/s and 1.9 to 2.1 s, respectively, and are consistent with values reported for HEWL in the literature (30–32). The kD and ks were calculated from the slopes and the intercepts. The results (Fig. 1 C) indicate that, through the entire NaCl concentration range, kD and ks were of comparable magnitudes. Both coefficients were positive at 100 mM NaCl and decreased with increasing salt concentration to negative values at 400 mM NaCl; ks decreased from 6.2 to −0.4 mL/gm and kD from 4.2 to −5.7 mL/gm. At each NaCl concentration, B2 value was determined employing Eq. 1, the calculated kD, ks values, and a sequence molecular mass of HEWL of 14.3 kDa (Fig. 1 D). Similar to the interaction parameters, B2 values decreased with increasing salt concentration.
Figure 1.

Diffusion and sedimentation interaction parameters for HEWL. (A) Diffusion coefficients and (B) sedimentation coefficients as a function of protein concentration at 25°C in a pH 4.6 acetate buffer. (C) Parameters kD and ks as a function of NaCl concentration. Note that ks and kD are of comparable magnitude and bear opposite signs at intermediate NaCl concentrations. (D) Comparison of B2 values measured by the SV-DLS method in 10 mM acetate buffer at pH 4.6 (this article) with literature values.
The measured B2 values were compared with literature data gathered by using other methods, namely, SIC, SEC, and SLS (Fig. 1 D). Minor differences were present between the solution conditions used in this work and those described in the literature, because data under identical conditions could not be found. The selected self-interaction chromatography (33) and SEC data (18) was for 10 mM acetate buffer, pH 4.5 and 50 mM acetate buffer, pH 4.7, respectively. The SLS data (34) from literature was at the same pH (4.6) but higher buffer concentration, 40 mM acetate, as compared to 10 mM acetate used in this work.
A general agreement was observed between the measured B2 values and those reported based on SIC and SEC methods: B2 decreased with increasing salt concentration. Near-identical values were noted when comparing the SV-DLS and SLS methods. Winzor et al. (35) and Deszczynksi et al. (36) have argued that B2 values measured by sedimentation equilibrium are more appropriately termed as osmotic second virial coefficients and reflect interactions solely between solute molecules; values determined from SLS include contributions from solute/co-solute interactions. Regardless, SLS has been reliably used to quantify intermolecular interactions, and its utility for either the prediction of crystallization conditions or inhibition of protein aggregation is not in dispute (1,8,37–40). The excellent agreement observed between our measured B2 values and literature values from SLS indicates the accuracy of the SV-DLS method for measurement of B2.
We also measured B2 values for an IgG2 (mAB1) in 10 mM acetate buffer at pH 5.0 as a function of sodium chloride concentration (0–100 mM), and as function of salt identity in four different monovalent Hofmeister sodium salts (0.05 M). In the absence of any added NaCl, both D-versus-c (Fig. 2 A) and 1/s-versus-c (Fig. 2 B) plots exhibited finite slopes indicative of solution nonideality which decreased with increasing NaCl concentration. At the highest NaCl concentration studied (100 mM), D appeared to become independent of protein concentration whereas the 1/s-versus-c plot still exhibited a positive slope. The B2 values derived from the calculated ks and kD values (Fig. 2 C) decreased from 2.99 × 10⁻⁴ mole-mL/gm2 to 3.81 × 10⁻⁵ mole-mL/gm2 with increasing NaCl concentration, indicating a decrease in repulsive protein-protein interactions (Fig. 2 D). Similarly, ks and kD values were determined in the presence of Hofmeister sodium salts. Both parameters decreased with increasing chaotropic character of the anion in the order of
(see Fig. 2 E). The observed effect of anion concentration and identity on the solution behavior of mAb1 is consistent with the hypothesis proposed by Collins et al. (41–43) and results from our previous work on effects of ions of mAb aggregation and protein precipitation (44,45). Under acidic conditions, anions can effectively neutralize the net positive charge of a basic protein in an ion-specific manner resulting in increased attractive protein-protein interactions.
Figure 2.

Diffusion and sedimentation interaction parameters for mAb1. (A) Diffusion coefficients and (B) sedimentation coefficients as a function of protein concentration at 20°C in a pH 5.0 acetate (A5) buffer. The control represents A5 buffer. (C) Parameters kD and ks in the presence of 0 mM and 5 mM NaCl, kD exceeds ks; the two parameters are of comparable magnitude at 10 mM NaCl. (D) B2 as a function of NaCl concentration. Under near-isotonic conditions, values down to 0.38 × 10⁻⁴ mole-mL/gm2 were noted. (E) Parameters ks and kD in the presence of 50 mM Hofmeister, Na-anion salts. The control represents A5 buffer. Note that ks and kD bear opposite signs in NaI and NaSCN solutions.
Our results demonstrate that B2 values can be accurately determined from the sedimentation and diffusion interaction parameters ks and kD, using a combination of SV and DLS experiments. Solovyova et al. (29) have proposed a procedure based on fitting sedimentation velocity data for determination of ks, kD, and consequently B2. The procedure is based on the assumption that ks >> kD and that both ks and kD have the same sign (both +ve or −ve). The authors have shown a reasonable agreement of the B2 values determined by SV with those from small angle neutron scattering (SANS). However, the studies were conducted in 1.5–4.0 M NaCl and the measured B2 values ranged from ∼1.5 × 10⁻⁴ to ∼3.0 × 10⁻⁴ mol-mL/gm2. Our studies have shown that under near-isotonic or near-physiological salt conditions, where relatively smaller values of ks, kD, and B2 may result, the assumptions outlined by Solovyova et al. may not hold. In this study, HEWL solutions at 200 mM and 300 mM NaCl (Fig. 1 C) and mAb1 solutions at 50 mM NaI and NaSCN (Fig. 2 E) exhibited ks and kD values with opposite signs. These solution conditions corresponded to B2 values in the range of −1.0 × 10⁻⁴ to 0.38 × 10⁻⁴ mol-mL/gm2, which were nearly an order-of-magnitude-smaller than those reported by Solovyova et al. In addition, the ks > kD assumption also failed for mAb1 under low-salt conditions. With 0, 5, and 10 mM NaCl, ks (36.9, 27.2, 22.8 mL/gm) was less than or comparable to kD (52.9, 28.1, 20.3 mL/gm) (Fig. 2 C).
The data suggest that for reliable prediction of protein behavior under physiologically relevant salt concentrations, calculation of B2 through independent measurement of ks and kD is essential. The need for independent measurement will especially hold for solution conditions wherein a relatively small change in the nature and extent of protein-protein interaction, and thus B2, results in significant difference in the rate of aggregation and particulation propensity.
The diffusional interaction parameter as a high-throughput predictor of protein aggregation
In protein formulations designed for pharmaceutical therapeutics, associative processes including precipitation (phase separation of the native protein due to low solubility), aggregation (irreversible growth of nonnative oligomers), and particulation (formation of subvisible/visible proteinaceous particles) can pose a significant challenge to the quality, safety, and efficacy of the product (46,47). Stability against precipitation and particulation needs to be ensured and the rate of aggregation quantified before a protein drug product can be approved and marketed. For this reason, long-term stability data gathered under intended storage conditions is essential. However, high-throughput methods predictive of protein association can be quite valuable for early formulation development screens of pH, buffers, and excipients.
The use of B2 as one such predictive tool has been increasingly reported (37,48). Krishnan et al. (49) and Chi et al. (50) have shown a correlation between B2 and aggregation of granulocyte colony stimulating factor at pH 6.9–7.0. Ho et al. (51) have shown similar correlations for denatured and reduced HEWL. Rosenbaum and Zukoski (34) have found a strong correlation between B2 and solubility of HEWL. In this study, the increase in particulation propensity for mAb1 with salt concentration (Fig. 3 A) and the rate of aggregation as a function of anion identity (Fig. 3 C) were consistent with decreasing B2 (Fig. 2 D and Fig. 3 B). Interestingly, a relatively small decrease in the B2 value from 0.55 × 10⁻⁴ mol-mL/gm2 (Cl−) to 0.25 × 10⁻⁴ mol-mL/gm2 (SCN) (Fig. 3 B) corresponded to a dramatic increase in the rate of aggregation of mAb1 (Fig. 3 C).
Figure 3.

Aggregation of mAb1 in various salt solutions and its correlation to B2. (A) Optical density (OD) or turbidity of mAb1 solutions agitated at room temperature in A5 buffer as a function of NaCl concentration. Note the increase in solution turbidity with salt concentration consistent with a decrease in B2 values (Fig. 2D). (B) B2 values measured by the SV-DLS method in A5 buffer with 50 mM Na-anion salt. (C) Initial-rate constants derived from the slope of the first-order fit to the mAb1 monomer concentration-versus-time data (inset). Monomer loss (to aggregate) was monitored over 15 weeks at 45°C in A5 buffer with 50 mM Na-anion salt. A relatively small decrease in the B2 value from 0.55 × 10⁻⁴ mol-mL/gm2 (Cl−) to 0.25 × 10⁻⁴ mol-mL/gm2 (SCN−) corresponded to a significant increase in the rate of aggregation of mAb1.
However, unlike crystallization, where B2 serves as a semiquantitative tool (2,52), the use of B2 for the purpose of formulation development is largely qualitative and is based on trend analysis with changing solution variables. Conditions resulting in more repulsive protein-protein interactions, corresponding to more positive values of B2, are generally preferred. To this end, coefficients ks and kD, which are directly related to B2 and trend similarly as a function of solution condition, can serve the same purpose. Qualitatively, we have observed a similar trend in B2, ks, and kD with increasing turbidity or particulation propensity (Fig. 4, A and B) and rates of aggregation (Fig. 4, C and D) for mAb1. A near-exponential decrease in all three parameters is observed with increasing particulation propensity and protein aggregation. Results utilizing different buffer species provided further evidence for correlation between aggregation rate and hydrodynamic interaction parameters. For mAb1, the increase in the aggregation rate in the order
(see Fig. 5 A) correlated well with a decrease in the kD value (Fig. 5 B). The trend was consistent with the effect of ion-specific protein interactions (41–43) as well as the increased ionic strength from succinate and citrate buffers. A similar approach as been recently described by Rubin et al. (32).
Figure 4.
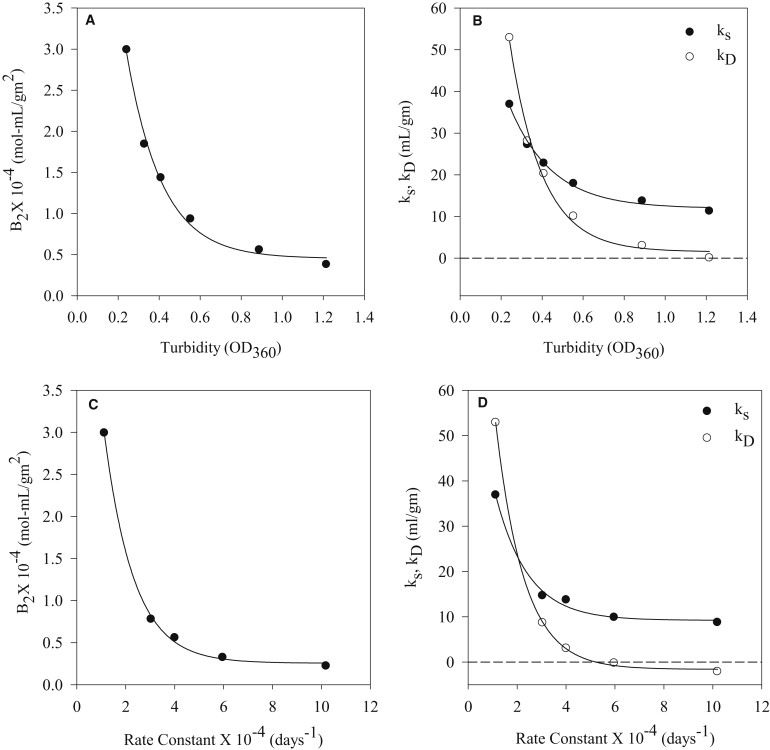
Correlation between interaction parameters and aggregation of mAb1. A plot of (A) change in B2 and (B) ks and kD as a function of solution turbidity. Turbidity at the corresponding NaCl concentration calculated by interpolation of the data represented in Fig. 3A. (C) Change in B2 and (D) ks and kD plotted versus the rate of protein aggregation.
Figure 5.

Correlation between diffusional interaction parameter kD and rate of aggregation for mAb1. (A) Initial-rate constants derived from the slope of the first-order fit to the mAb1 monomer concentration data (inset). The monomer loss to aggregates was monitored in 50 mM Na-anion buffer solutions at pH 5.0 over 15 weeks at 45°C. (B) The kD values measured by SV-DLS in 10 mM Na-anion buffer solutions at pH 5.0 and 20°C. A correlation between kD and the aggregation rate suggests the utility of kD for predicting protein behavior in solution.
Between the two hydrodynamic interaction parameters, kD appears to be more suited to a high-throughput screening strategy than ks. In our experience, the measurement of kD is 1), faster; 2), requires less material; and 3), provides a wider dynamic range (Fig. 1 C and Fig. 2, C and E). The last can prove advantageous under conditions where relatively small differences in protein-protein interaction correlate with a significant change in the solution behavior of the protein molecule (e.g., mAb1 in presence of Na-anion salts, Fig. 3, B and C). Recent applications of plate-reader technology to DLS instruments (51) may allow for further improvement in the efficiency of kD measurements with respect to time, effort, and material requirement. Given these relative advantages and the qualitative nature of the application of protein interaction parameters (e.g., B2) for formulation screening purposes, the measurements of kD alone as a predictive tool may be an efficient approach during early formulation development.
Footnotes
Yatin Gokarn's present address is Genentech, Inc., Late-Stage Pharmaceutical & Process Development, South San Francisco, CA 94080.
Atul Saluja's present address is Bristol-Myers Squibb Co., Biopharmaceutics R&D, New Brunswick, NJ.
Contributor Information
David N. Brems, Email: dbrems@amgen.com.
Yatin R. Gokarn, Email: gokarn.yatin@gene.com.
References
- 1.Neal B.L., Asthagiri D., Kaler E.W. Why is the osmotic second virial coefficient related to protein crystallization? J. Cryst. Growth. 1999;196:377–387. [Google Scholar]
- 2.George A., Wilson W.W. Predicting protein crystallization from a dilute solution property. Acta Crystallogr. D Biol. Crystallogr. 1994;50:361–365. doi: 10.1107/S0907444994001216. [DOI] [PubMed] [Google Scholar]
- 3.Morshedi D., Ebrahim-Habibi A., Nemat-Gorgani M. Chemical modification of lysine residues in lysozyme may dramatically influence its amyloid fibrillation. Biochim. Biophys. Acta. 2010;1804:714–722. doi: 10.1016/j.bbapap.2009.11.012. [DOI] [PubMed] [Google Scholar]
- 4.Castillo V., Ventura S. Amyloidogenic regions and interaction surfaces overlap in globular proteins related to conformational diseases. PLOS Comput. Biol. 2009;5:e1000476. doi: 10.1371/journal.pcbi.1000476. [DOI] [PMC free article] [PubMed] [Google Scholar]
- 5.Thomas A.V., Berezovska O., von Arnim C.A. Visualizing interaction of proteins relevant to Alzheimer's disease in intact cells. Methods. 2008;44:299–303. doi: 10.1016/j.ymeth.2007.02.003. [DOI] [PMC free article] [PubMed] [Google Scholar]
- 6.Harper J.D., Lansbury P.T., Jr. Models of amyloid seeding in Alzheimer's disease and scrapie: mechanistic truths and physiological consequences of the time-dependent solubility of amyloid proteins. Annu. Rev. Biochem. 1997;66:385–407. doi: 10.1146/annurev.biochem.66.1.385. [DOI] [PubMed] [Google Scholar]
- 7.Meehan S., Berry Y., MacPhee C.E. Amyloid fibril formation by lens crystallin proteins and its implications for cataract formation. J. Biol. Chem. 2004;279:3413–3419. doi: 10.1074/jbc.M308203200. [DOI] [PubMed] [Google Scholar]
- 8.Tessier P.M., Lenhoff A.M. Measurements of protein self-association as a guide to crystallization. Curr. Opin. Biotechnol. 2003;14:512–516. doi: 10.1016/s0958-1669(03)00114-9. [DOI] [PubMed] [Google Scholar]
- 9.Le Brun V., Friess W., Garidel P. A critical evaluation of self-interaction chromatography as a predictive tool for the assessment of protein-protein interactions in protein formulation development: a case study of a therapeutic monoclonal antibody. Eur. J. Pharm. Biopharm. 2010;75:16–25. doi: 10.1016/j.ejpb.2010.01.009. [DOI] [PubMed] [Google Scholar]
- 10.Le Brun V., Friess W., Garidel P. Lysozyme-lysozyme self-interactions as assessed by the osmotic second virial coefficient: impact for physical protein stabilization. Biotechnol. J. 2009;4:1305–1319. doi: 10.1002/biot.200800274. [DOI] [PubMed] [Google Scholar]
- 11.Ahamed T., Esteban B.N., Thömmes J. Phase behavior of an intact monoclonal antibody. Biophys. J. 2007;93:610–619. doi: 10.1529/biophysj.106.098293. [DOI] [PMC free article] [PubMed] [Google Scholar]
- 12.Tessier P.M., Verruto V.J., Lenhoff A.M. Correlation of diafiltration sieving behavior of lysozyme-BSA mixtures with osmotic second virial cross-coefficients. Biotechnol. Bioeng. 2004;87:303–310. doi: 10.1002/bit.20115. [DOI] [PubMed] [Google Scholar]
- 13.Narayanan J., Liu X.Y. Protein interactions in undersaturated and supersaturated solutions: a study using light and x-ray scattering. Biophys. J. 2003;84:523–532. doi: 10.1016/S0006-3495(03)74871-1. [DOI] [PMC free article] [PubMed] [Google Scholar]
- 14.Receveur V., Durand D., Calmettes P. Repulsive interparticle interactions in a denatured protein solution revealed by small angle neutron scattering. FEBS Lett. 1998;426:57–61. doi: 10.1016/s0014-5793(98)00309-3. [DOI] [PubMed] [Google Scholar]
- 15.Zorrilla S., Jiménez M., Minton A.P. Sedimentation equilibrium in a solution containing an arbitrary number of solute species at arbitrary concentrations: theory and application to concentrated solutions of ribonuclease. Biophys. Chem. 2004;108:89–100. doi: 10.1016/j.bpc.2003.10.012. [DOI] [PubMed] [Google Scholar]
- 16.J. Liu, and S. J. Shire. 2002. Reduced-viscosity concentrated protein formulations. Pat. No. WO-0230463.
- 17.Wen J., Arakawa T., Philo J.S. Size-exclusion chromatography with on-line light-scattering, absorbance, and refractive index detectors for studying proteins and their interactions. Anal. Biochem. 1996;240:155–166. doi: 10.1006/abio.1996.0345. [DOI] [PubMed] [Google Scholar]
- 18.Bloustine J., Berejnov V., Fraden S. Measurements of protein-protein interactions by size exclusion chromatography. Biophys. J. 2003;85:2619–2623. doi: 10.1016/s0006-3495(03)74684-0. [DOI] [PMC free article] [PubMed] [Google Scholar]
- 19.Wyatt P.J. Wyatt Technology Corporation; Santa Barbara, CA: 2002. Method for Measuring the 2nd Virial Coefficient of a Protein Monomer. [Google Scholar]
- 20.Tessier P.M., Vandrey S.D., Lenhoff A.M. Self-interaction chromatography: a novel screening method for rational protein crystallization. Acta Crystallogr. D Biol. Crystallogr. 2002;58:1531–1535. doi: 10.1107/s0907444902012775. [DOI] [PubMed] [Google Scholar]
- 21.Gabrielsen M., Nagy L.A., Cogdell R.J. Self-interaction chromatography as a tool for optimizing conditions for membrane protein crystallization. Acta Crystallogr. D Biol. Crystallogr. 2010;66:44–50. doi: 10.1107/S0907444909043972. [DOI] [PubMed] [Google Scholar]
- 22.Harding S.E., Johnson P. The concentration-dependence of macromolecular parameters. Biochem. J. 1985;231:543–547. doi: 10.1042/bj2310543. [DOI] [PMC free article] [PubMed] [Google Scholar]
- 23.Nobbmann U., Connah M., Harding S.E. Dynamic light scattering as a relative tool for assessing the molecular integrity and stability of monoclonal antibodies. Biotechnol. Genet. Eng. Rev. 2007;24:117–128. doi: 10.1080/02648725.2007.10648095. [DOI] [PubMed] [Google Scholar]
- 24.Lawrie A.S., Albanyan A., Harrison P. Microparticle sizing by dynamic light scattering in fresh-frozen plasma. Vox Sang. 2009;96:206–212. doi: 10.1111/j.1423-0410.2008.01151.x. [DOI] [PubMed] [Google Scholar]
- 25.Mirarefi A.Y., Zukoski C.F. Gradient diffusion and protein solubility: use of dynamic light scattering to localize crystallization conditions. J. Cryst. Growth. 2004;265:274–283. [Google Scholar]
- 26.Philo J.S. Improved methods for fitting sedimentation coefficient distributions derived by time-derivative techniques. Anal. Biochem. 2006;354:238–246. doi: 10.1016/j.ab.2006.04.053. [DOI] [PubMed] [Google Scholar]
- 27.Schuck P. Size-distribution analysis of macromolecules by sedimentation velocity ultracentrifugation and Lamm equation modeling. Biophys. J. 2000;78:1606–1619. doi: 10.1016/S0006-3495(00)76713-0. [DOI] [PMC free article] [PubMed] [Google Scholar]
- 28.Philo J.S. A method for directly fitting the time derivative of sedimentation velocity data and an alternative algorithm for calculating sedimentation coefficient distribution functions. Anal. Biochem. 2000;279:151–163. doi: 10.1006/abio.2000.4480. [DOI] [PubMed] [Google Scholar]
- 29.Solovyova A., Schuck P., Ebel C. Non-ideality by sedimentation velocity of halophilic malate dehydrogenase in complex solvents. Biophys. J. 2001;81:1868–1880. doi: 10.1016/S0006-3495(01)75838-9. [DOI] [PMC free article] [PubMed] [Google Scholar]
- 30.Annunziata O., Vergara A., Albright J.G. Quaternary diffusion coefficients in a protein-polymer-salt-water system determined by Rayleigh interferometry. J. Phys. Chem. B. 2009;113:13446–13453. doi: 10.1021/jp906977m. [DOI] [PubMed] [Google Scholar]
- 31.Behlke J., Ristau O. Molecular mass determination by sedimentation velocity experiments and direct fitting of the concentration profiles. Biophys. J. 1997;72:428–434. doi: 10.1016/S0006-3495(97)78683-1. [DOI] [PMC free article] [PubMed] [Google Scholar]
- 32.Rubin J., San Miguel A., Behrens S.H. Correlating aggregation kinetics and stationary diffusion in protein-sodium salt systems observed with dynamic light scattering. J. Phys. Chem. B. 2010;114:4383–4387. doi: 10.1021/jp912126w. [DOI] [PubMed] [Google Scholar]
- 33.Tessier P.M., Lenhoff A.M., Sandler S.I. Rapid measurement of protein osmotic second virial coefficients by self-interaction chromatography. Biophys. J. 2002;82:1620–1631. doi: 10.1016/S0006-3495(02)75513-6. [DOI] [PMC free article] [PubMed] [Google Scholar]
- 34.Rosenbaum D.F., Zukoski C.F. Protein interaction and crystallization. J. Cryst. Growth. 1996;169:752–758. [Google Scholar]
- 35.Winzor D.J., Deszczynski M., Wills P.R. Nonequivalence of second virial coefficients from sedimentation equilibrium and static light scattering studies of protein solutions. Biophys. Chem. 2007;128:46–55. doi: 10.1016/j.bpc.2007.03.001. [DOI] [PubMed] [Google Scholar]
- 36.Deszczynski M., Harding S.E., Winzor D.J. Negative second virial coefficients as predictors of protein crystal growth: evidence from sedimentation equilibrium studies that refutes the designation of those light scattering parameters as osmotic virial coefficients. Biophys. Chem. 2006;120:106–113. doi: 10.1016/j.bpc.2005.10.003. [DOI] [PubMed] [Google Scholar]
- 37.Valente J.J., Payne R.W., Henry C.S. Colloidal behavior of proteins: effects of the second virial coefficient on solubility, crystallization and aggregation of proteins in aqueous solution. Curr. Pharm. Biotechnol. 2005;6:427–436. doi: 10.2174/138920105775159313. [DOI] [PubMed] [Google Scholar]
- 38.Sukumar M., Doyle B.L., Pekar A.H. Opalescent appearance of an IgG1 antibody at high concentrations and its relationship to noncovalent association. Pharm. Res. 2004;21:1087–1093. doi: 10.1023/b:pham.0000032993.98705.73. [DOI] [PubMed] [Google Scholar]
- 39.Zhang J., Liu X.Y. Effect of protein-protein interactions on protein aggregation kinetics. J. Chem. Phys. 2003;119:10972–10976. [Google Scholar]
- 40.George A., Chiang Y., Wilson W.W. Second virial coefficient as predictor in protein crystal growth. Methods Enzymol. 1997;276:100–110. doi: 10.1016/S0076-6879(97)76052-X. [DOI] [PubMed] [Google Scholar]
- 41.Collins K.D., Neilson G.W., Enderby J.E. Ions in water: characterizing the forces that control chemical processes and biological structure. Biophys. Chem. 2007;128:95–104. doi: 10.1016/j.bpc.2007.03.009. [DOI] [PubMed] [Google Scholar]
- 42.Collins K.D. Ions from the Hofmeister series and osmolytes: effects on proteins in solution and in the crystallization process. Methods. 2004;34:300–311. doi: 10.1016/j.ymeth.2004.03.021. [DOI] [PubMed] [Google Scholar]
- 43.Collins K.D. Sticky ions in biological systems. Proc. Natl. Acad. Sci. USA. 1995;92:5553–5557. doi: 10.1073/pnas.92.12.5553. [DOI] [PMC free article] [PubMed] [Google Scholar]
- 44.Fesinmeyer R.M., Hogan S., Gokarn Y.R. Effect of ions on agitation- and temperature-induced aggregation reactions of antibodies. Pharm. Res. 2009;26:903–913. doi: 10.1007/s11095-008-9792-z. [DOI] [PubMed] [Google Scholar]
- 45.Saluja A., Crampton S., Gokarn Y.R. Anion binding mediated precipitation of a peptibody. Pharm. Res. 2009;26:152–160. doi: 10.1007/s11095-008-9722-0. [DOI] [PubMed] [Google Scholar]
- 46.Rosenberg, A. S. 2006. Effects of protein aggregates: an immunologic perspective. AAPS J. 8:E501–E507. http://www.aaps.org. [DOI] [PMC free article] [PubMed]
- 47.Shire S.J. Formulation and manufacturability of biologics. Curr. Opin. Biotechnol. 2009;20:708–714. doi: 10.1016/j.copbio.2009.10.006. [DOI] [PubMed] [Google Scholar]
- 48.Piazza R., Iacopini S. Transient clustering in protein solutions. Eur. Phys. J. E. 2002;7:45–48. [Google Scholar]
- 49.Krishnan S., Chi E.Y., Carpenter J.F. Aggregation of granulocyte colony stimulating factor under physiological conditions: characterization and thermodynamic inhibition. Biochemistry. 2002;41:6422–6431. doi: 10.1021/bi012006m. [DOI] [PubMed] [Google Scholar]
- 50.Chi E.Y., Krishnan S., Carpenter J.F. Physical stability of proteins in aqueous solution: mechanism and driving forces in nonnative protein aggregation. Pharm. Res. 2003;20:1325–1336. doi: 10.1023/a:1025771421906. [DOI] [PubMed] [Google Scholar]
- 51.Ho J.G.S., Middelberg A.P.J., Kocher H.P. The likelihood of aggregation during protein renaturation can be assessed using the second virial coefficient. Protein Sci. 2003;12:708–716. doi: 10.1110/ps.0233703. [DOI] [PMC free article] [PubMed] [Google Scholar]
- 52.Bonnete F., Finet S., Tardieu A. Second virial coefficient: variations with lysozyme crystallization conditions. J. Cryst. Growth. 1999;196:403–414. [Google Scholar]