

Abstract
This manuscript provides a comprehensive review of the peptide and protein identification process using tandem mass spectrometry (MS/MS) data generated in shotgun proteomic experiments. The commonly used methods for assigning peptide sequences to MS/MS spectra are critically discussed and compared, from basic strategies to advanced multi-stage approaches. A particular attention is paid to the problem of false-positive identifications. Existing statistical approaches for assessing the significance of peptide to spectrum matches are surveyed, ranging from single-spectrum approaches such as expectation values to global error rate estimation procedures such as false discovery rates and posterior probabilities. The importance of using auxiliary discriminant information (mass accuracy, peptide separation coordinates, digestion properties, and etc.) is discussed, and advanced computational approaches for joint modeling of multiple sources of information are presented. This review also includes a detailed analysis of the issues affecting the interpretation of data at the protein level, including the amplification of error rates when going from peptide to protein level, and the ambiguities in inferring the identifies of sample proteins in the presence of shared peptides. Commonly used methods for computing protein-level confidence scores are discussed in detail. The review concludes with a discussion of several outstanding computational issues.
Keywords: Proteomics, Bioinformatics, Mass Spectrometry, Peptide Identification, Protein Inference, Statistical Models, False Discovery Rates
1. Introduction
More than a decade after the beginning of rapid expansion in proteomic technologies and applications, proteomics remains a fast growing field. Generally defined, proteomics is an integrative study of proteins, and their biological functions and processes. An overarching goal of proteomics is to achieve complete and quantitative analysis of the proteome of a species, including the sub proteomes of various cells or tissue types in the case of multi-cellular organisms. This also includes the reconstruction of protein interaction networks and protein complexes and their dynamic changes, cellular localization analysis, delineation of kinase – substrate relationships, and many other biological applications [1].
While there exist a number of alternative proteomics strategies (e.g. protein array based methods [2]), mass spectrometry (MS)-based strategies have become the method of choice for both identification and quantification of proteins in most studies. In this regard, the last several years have been particularly exciting for the field. With the advent of new MS instrumentation, alternative fragmentation mechanisms, and advanced data acquisition strategies, the throughput and the depth of the proteomic analysis have improved by an order of magnitude compared to earlier applications. This has enabled many powerful proteomic applications, including global analysis of post-translational modifications [3], large-scale reconstruction of protein interaction networks [4], and deep quantitative proteome profiling of model organisms [5]. Significant efforts are being made to introduce proteomic technologies in clinical and translational research [6]. MS-based proteomics is now increasingly applied in the context of systems biology studies where it is used in parallel with other technologies such as gene expression analysis and metabolomics. MS-based findings are being increasingly annotated in knowledge repositories such as UniProt. MS-specific repositories are also quickly growing, with new resources for various domain applications such as phosphoproteomics being constantly created [7].
Proteomics, like all high-throughput technologies, is extremely dependent on the ability to quickly and reliably analyze large amounts of experimental data. In the absence of robust statistical and computational methods, proteomic datasets contain significant numbers of false positives [8-13], and statements referring to computational analysis of MS/MS data as e.g. “the Achilles heels of proteomics” are common in the literature [14]. The high rate of false positives in early proteomic publications was so alarming to the scientific community that it lead to the establishment of specific data analysis guidelines by the Editorial Boards of the leading proteomic journals [15]. In recent years, there has been a substantial progress in addressing the most immediate proteomic data analysis needs. Several commercial and open source data analysis pipelines became available and allowed faster and more transparent analysis of proteomic data than previously possible. At the same time, the dramatic change in the size, diversity, and context in which proteomic datasets of today are generated creates a need for a survey and detail discussion of the existing and emerging computational strategies. In this manuscript, we review the process of identifying peptides and proteins from MS data, the resulting data analysis challenges, and the existing computational methods, with a focus on data generated using the shotgun proteomics strategy.
2. Shotgun proteomics strategy
The shotgun proteomics approach is presently the method of choice for identifying proteins in most large-scale studies, with many excellent reviews available describing this technology and its biological applications (e.g. see [16-18]). This strategy involves several major steps (see Figure 1), which are summarized below to provide the necessary background for subsequent discussion of the computational strategies and data analysis issues related to these data.
Fig. 1. Overview of shotgun proteomics.

1) Sample proteins are digested into peptides using enzymes such as trypsin. Resulting peptide mixtures are optionally processed to capture a particular class of peptides (e.g. phosphorylated peptides), and then separated using a liquid chromatography (LC) system coupled online to a mass spectrometer. 2) Peptides are subjected to tandem mass spectrometry (MS/MS) analysis that results in the acquisition of MS/MS spectra. 3) The correct assignment of MS/MS spectra to peptide sequences is the first step in proteomic data processing.
2.1 Protein digestion and separation
A key step in shotgun proteomics is digestion of proteins into peptides using proteolytic enzymes such as trypsin (optionally, using multiple different enzymes). In the example of trypsin, the enzyme cleaves peptides after arginine and lysine residues (unless followed by proline), and thus the majority of the resulting peptides are expected to conform to the trypsin cleavage rules on both ends of the sequence (“tryptic peptides”). They should also have no or just a few internal trypsin cleavage sites (“missed cleavages”). Performing protein digestion has many advantages over methods of analysis based on MS/MS sequencing of intact proteins. As a drawback, since each protein digested with trypsin produces multiple peptides (on average about 50), the resulting peptide mixtures can be very complex. Thus, prior to digestion, a protein separation procedure may be employed, e.g., using 1-D SDS-PAGE or organellar based separation, to divide the total protein content of the sample into sub-fractions to reduce the sample complexity. Elimination of extensive protein separation steps prior to MS-based identification, such as two dimensional (2D) gels, allows higher data throughput and protein detection sensitivity. The protein digestion step is often followed by a selective peptide enrichment (depletion) strategy designed to capture peptides having certain specific properties of interest (e.g. N-linked glycosylated peptides, phosphorylated peptides, etc. [19]). Resulting peptide samples are then further separated using reverse phase chromatography coupled online to the mass spectrometer. Alternatively, peptides can be spotted on a MALDI plate for subsequent analysis using MALDI-source equipped MS instruments. Peptides (or proteins) may also be labeled, chemically or metabolically, with a stable isotope tag to allow quantitative comparison of protein abundances across several samples (e.g. treated cells vs. control) [20].
2.2 Tandem mass spectrometry
Another critical step is peptide sequencing using MS. Peptides, as they elude from the reverse phase column at a particular time (retention time) are ionized, transferred into the gas phase, and selected ions are subjected to tandem mass spectrometry (MS/MS) sequencing to produce fragment ion spectra (MS/MS spectra) [16]. The data acquisition process consists of multiple stages:
(a) The instrument scans all peptide ions that are introduced into the instrument at any given time and records the so-called MS1 spectrum consisting of mass-to-charge ratios (m/z values) and intensities of all peptide ions. (b) Selected peptide ions (‘precursor’ or ‘parent’ ions) observed in the MS1 spectrum are broken down into smaller pieces (fragment ions) in the collision cell of the MS instrument. The acquired MS/MS (or MS2) spectrum is a list of m/z values and intensities of all the fragment ions generated by fragmenting an isolated precursor ion. The fragmentation pattern encoded by the MS/MS spectrum allows identification of the amino acid sequence of the peptide that produced it. The fragmentation is most often based on the process termed collision induced dissociation (CID). However, several alternative mechanisms have recently become available on commercial MS instruments and are used routinely for specialized applications such as sequencing of peptides with PTMs. These fragmentation mechanisms include the electron transfer dissociation (ETD) and Higher energy Collision dissociation (HCD). Furthermore, some instruments can be operated in a multi-stage mode with automated data-dependent triggering of MS3 acquisition or, alternatively, using a technique referred to as Multistage Activation (MSA).
Importantly, the mass accuracy and resolution of the MS analyzer have a significant effect on the information content of the spectrum, which in turn is of great importance for the subsequent peptide identification step. The accuracy with which an MS instrument can measure peptide ion m/z values ranges from as low as several parts per million (ppm) in the case of high mass accuracy instruments such as LTQ-Orbitrap, to more than 500 ppm in the case of low mass accuracy instruments. Even with high mass accuracy instruments, achieving truly high accuracy often requires fine instrument tuning, room temperature control, and use of internal or external (computational) calibration. Similarly, the mass resolution of the instrument governs the ability to accurately determine the charge state of the peptide ion. The ability of the instrument to isolate for MS/MS sequencing parent ions within a narrow window around a particular m/z is also dependent on many factors and is important for minimizing the number of co-fragmented peptides.
3. Peptide sequence assignment to MS/MS spectra
After the first step of acquiring a desired amount of MS data, the effort shifts toward the computational analysis. The central element here is the identification of the peptides that gave rise to the measured MS/MS spectra. The peptide identification strategies can be roughly classified into several categories (see Figure 2). Peptide identification can be performed by correlating acquired experimental MS/MS spectra with theoretical spectra predicted for each peptide contained in a protein sequences database (database search approach), or against spectra from a spectral library (spectral library searching). Alternatively, peptide sequences can be extracted directly from the spectra, i.e., without referring to a sequence database for help (de novo sequencing approach). There are also hybrid approaches, such as those based on the extraction of short sequence tags (3-5 residues long) followed by database searching. Finally, a number of iterative or multi-stage strategies have been proposed combining elements of different strategies in a single data analysis pipeline.
Figure 2. Peptide identification strategies.

Peptide identification can be performed by correlating acquired experimental MS/MS spectra with theoretical spectra predicted for each peptide contained in a protein sequences database (database search approach), or against spectra from a spectral library (spectral library search). Alternatively, peptide sequences can be extracted directly from the spectra using de novo sequencing. Hybrid approaches such as sequence tag-assisted database search start by extracting short tags (length 3 in this illustration) followed by database searching in which the list of candidate peptides is restricted to those peptides only that contain one of the sequence tags extracted from the spectrum.
3.1 Sequence database searching
3.1.1 Basic concept
Sequence database searching remains the dominant method for assigning peptide sequences to MS/MS spectra, and the number of available computational tools continues to grow (Table 1). The search program takes as input the experimental MS/MS spectrum and compares it against theoretical fragmentation spectra generated for peptides from the searched protein sequence database (see Figure 2). Importantly, the comparison is performed not against all possible peptide sequences, but against a much smaller set of candidate peptides. The candidate peptide list is generated by the program using in silico database digestion and application of several criteria. The most important criteria include the parent ion mass tolerance, enzyme digestion constraint (e.g. allowing tryptic peptides only), and what if any post-translational or chemical modifications are allowed. Additional search parameters (used in the scoring function) include the type of fragment ions expected in the spectrum (e.g. y and b ions in CID), and the fragment ion mass tolerance. For a detailed discussion of the data search parameters see [21]. The output from the program is a list of peptides for each MS/MS spectrum, ranked according to the search score. In most cases, only the best scoring peptide to spectrum match (PSM) for each MS/MS spectrum is considered as the potential peptide identification and is taken to the subsequent statistical data validation step (see section 5).
Table 1. A partial list of publicly available tools for MS/MS-based proteomics.
free access via the web interface (functionality might be limited);
free software distribution
3.1.2 Scoring functions
The search score calculated by the database search program essentially measures the degree of similarity between the experimental MS/MS spectrum and the theoretical spectrum. There is a number of scoring schemes that have been described in the literature and implemented in the currently available search tools. These include the class of spectral correlation functions, from a simple dot product to a more advanced cross correlation function (e.g. SEQUEST, X! Tandem, OMSSA, MASCOT), scoring functions based on empirically observed rules (e.g., SpectrumMill), or statistically derived fragmentation frequencies (e.g., PHENYX). The score that is actually reported by the tool can be on an arbitrary scale (e.g., Xcorr score in SEQUEST), or converted to a statistical measure such as p-value or the expectation value, E-value (see section 5.1 below).
While the rigorous and objective comparison is somewhat hard to perform, empirical evidence indicates that some search tools perform better than others in different settings (e.g. depending on the type of instrument used to generate the data) [22-24]. When applied to the same dataset, the overlap between different search tools is typically in the range of 70-80%, suggesting that application of multiple search tools should increase the overall rate of peptide identification [25-29]. The scoring functions implemented in most tools were optimized for spectra generated using the CID fragmentation mechanism. With the advent of ETD and HCD instrumentation, recent efforts focused on the development of new scoring systems specifically for the analysis of peptide ETD fragmentation data [30] or phosphorylated peptide data [31]. For example, a substantial increase (up to 80%) was recently demonstrated compared to traditional scoring functions by using an ion type weighting schemes that depend on the precursor peptide ion charge state and the sequence [32]. Even for CID spectra, however, there is a potential improvement that can be achieved via better utilization of fragment ion intensities in the scoring models [33-40].
New search tools are also being developed in support of data independent acquisition schemes [41], in which multiple precursor ions are purposely fragmented simultaneously (i.e. without isolating a peptide ion species of a specific m/z value as in the conventional data dependent acquisition methods). The database search time remains an important consideration and can be improved via database indexing [42-44] or other algorithmic improvements [45-47], as well as using grid [48] or cloud [49] computing.
3.1.3 Database search parameters
As mentioned above, the list of candidate peptides is created for each experimental MS/MS spectrum based on the user specified set of search parameters. These parameters essentially reflect the prior knowledge regarding the experiment and can be referred to as auxiliary information useful for separating true from false identifications (also, see section 6.2). In a typical analysis, the precursor ion mass tolerance and the enzyme digestion constraint are the most important. For example, the knowledge of the digestion process allows limiting the search space to only those peptides that conform to the digestion rules specific to the used proteolytic enzyme. This has the benefit of significantly reducing the number of comparisons that need to be made and thus increases the speed of the analysis compared to the enzyme un-constrained or semi-constrained search (i.e. requiring at least one tryptic end). In the case of high mass accuracy instruments one can specify a very narrow mass window (e.g. 5 ppm), compared to a ∼ 2 Da window that is commonly used with low mass accuracy data. Performing enzyme-constrained searches, however, has disadvantages. It becomes impossible to identify peptides that exhibit unspecific cleavage, e.g., due to post-translational processing (e.g., removal of the signal peptide), due to contaminating enzymes present in the sample, or because they are products of in-source or in-solution fragmentation of other (tryptic) peptides. Similarly, using too narrow mass window may filter out valid peptide identifications with inaccurately measured peptide mass. Furthermore, instead of severely restricting the list of candidate database peptides, one may instead (given sufficient computational resources) perform a less constraint search and then utilize the auxiliary information as a part of the subsequent, post-database search data validation step (see section 6.4 below).
3.1.4 Protein sequence databases
The choice of the sequence database for MS analysis depends on the goal of the experiment [50]. For many organisms, multiple sequence databases are available. These include the Entrez Protein sequence database from the National Center for Biotechnology Information, its higher quality subset database RefSeq, and UniProt (consisting of Swiss-Prot and its supplement TrEMBL). The International Protein Index (IPI) database - currently a popular database for MS analysis from the European Bioinformatics Institute (EBI) - will no longer be updated beyond 2010. The databases vary in terms of completeness, degree of redundancy, and the quality of sequence annotation. In most cases, using a better annotated database such as UniProt or RefSeq should be sufficient. When the identification of sequence polymorphisms is particularly important, one may attempt to perform searches against a larger database such as Entrez Protein. This database, however, in addition to true biologically relevant sequence variants also contain a large number of redundant sequences derived from GenBank entries representing partial mRNAs and sequencing errors. Searching large databases also reduces the sensitivity of peptide identification by introducing more false identifications (the likelihood of obtaining a high scoring random match increases with increasing database size). Genomic databases also can be used for MS/MS database searching. This is an attractive option when one wants to identify novel peptides not present in any protein sequence database, e.g., novel alternative splice forms [51-54]. Correcting genome annotations or validating gene models predicted based on e.g. expressed sequence tag (EST) data in some cases may by itself be the main goal of the analysis (e.g. it was the initial motivation for building the Peptide Atlas database [55]). A number of such studies have been recently reported using proteomic data from model organisms as well as from higher eukaryotes [56-65].
3.1.5 Spectral processing prior to database search
Scoring of MS/MS spectra, and the statistical assessment of peptide identification confidence, is also sensitive to the details of the pre-database search spectral processing. As a result, a large number of studies attempted to optimize the spectral processing steps [66-68], cluster redundant spectra [69, 70], recognize and accommodate spectra produced by co-fragmentation of two or more peptides (“chimera” spectra) [71-75], eliminate low quality spectra [51, 66, 76-81], and develop improved charge state determination algorithms [82-85]. A substantial computational effort has been devoted to improved determination of the measured peptide mass [86-88]. Unfortunately, only a few of the proposed approaches described above are currently used in practice due to unavailability of the software or due to difficulties with incorporating the new tools in the existing data analysis pipelines.
3.2 Spectral library searching
Instead of searching acquired MS/MS spectra against theoretically predicted spectra, MS/MS spectra can be assigned peptides by matching against a spectral library [89-92]. The spectral library is compiled from a large collection of experimentally observed MS/MS spectra identified in previous experiments. A newly acquired MS/MS spectrum is compared to library spectra (using a certain mass tolerance window to restrict the set of candidate spectra) to determine the best match [93]. Existing spectral library search tools include SpectraST [55, 94], Bibliospec [91], and X! Hunter [90]. The National Institute of Standards and Technology (NIST) spectral libraries are available for multiple organisms, and contain data from a variety of MS instrument types. Specialized spectral libraries have also been reported for several types of post-translationally modified peptides such as a ubiquitin and ubiquitin-like spectral library [95] and a phosphorylated peptide library [96].
The spectral library matching approach outperforms conventional sequence database searching in terms of speed, error rates, and sensitivity of peptide identification [92]. Another advantage is that statistical models developed for assessing the validity of the peptide identifications by database searching (see section 5) are adaptable to this method [92]. As a drawback, only those peptides can be identified whose spectra were identified previously and entered into the library. Even though the systematic proteome sequencing in the case of some model organisms [97, 98] has already reached a substantial depth and coverage, the existing libraries are still incomplete, especially with respect to peptides from low abundance proteins and peptides containing PTMs. As a potential solution to the problem of incompleteness, the spectra of peptides that are not represented in the spectral library can be predicted using computational methods [99]. Furthermore, methods are being developed for unrestricted spectral library searching which can potentially allow the identification of peptides containing PTMs [100]. As the amount of publicly available data grows (owing to the development of proteomic repositories such as PeptideAtlas, Pride, Peptidome, and Tranche data exchange system [101], see Table 1), there is a hope that all peptides that are detectable by MS, at least for the most frequently studies organisms, will eventually be discovered and annotated in spectral libraries. At present, however, the spectral library matching tools remain underutilized and used mostly as an additional step in multi-stage strategies (see section 4.2).
The spectral libraries themselves, however, are becoming a rich and very useful resource for many applications. First, they can be used to obtain an improved understanding of peptide fragmentation trends, which in turn can lead to improved database search or de novo scoring functions [37]. They are also being extensively used for the development of targeted MS assays based on the Selective Reaction Monitoring (SRM) approach [102].
3.3 De novo sequencing
The advantage of the de novo sequencing approach (see Figure 2) over strategies that rely on a sequence database (or spectral library) as a reference is that it allows identification of peptides whose sequence is not present in the searched database (for a recent review on de novo methods see, e.g. [103]). Several tools are available that can automate this process (see Table 1 for a partial list). Still, de novo sequencing has not yet become a practically useful approach for large scale data analysis because it is computationally intensive and requires high quality MS/MS spectra. In the high throughput environment, and if the organism that is being studied has been sequenced, researchers often do not have the need or the time to follow up on peptides for which there is no exact match in the protein sequence database. As a result, in a typical experiment the computational analysis starts with database searching, and only then, if desired, de novo sequencing tools are applied to interrogate remaining unassigned spectra [51]. However, de novo sequencing is an important approach in the case of organisms with unsequenced or only partially sequenced genomes. In those cases, tools such as MS-BLAST and similar approaches or extensions [104-107] can assist with the downstream analysis of the de novo derived peptide sequences to infer the identities of the sample proteins. De novo sequencing results can also be used simply as an additional source of information for validation of the peptide assignments obtained using database searching [108]. Recent computational developments in the area of de novo sequencing focused on data generated using high mass accuracy instruments [109, 110], on data generated using HCD [111] and ETD [112] fragmentation mechanisms, or a combination of several mechanisms (e.g. CID and ETD) [113, 114].
3.4 Hybrid approaches
A number of approaches have also been developed that combine the elements of de novo sequencing and database searching. One common approach is to start by extracting, for each acquired MS/MS spectrum, a set of short “sequence tags” [115] that are likely to be a part of the true peptide sequence. A tag is a short amino acid sequence with a prefix mass and a suffix mass values which designate its position within the peptide sequence. The database search for each MS/MS spectrum is then performed only against those candidate database peptides that contain one of the sequence tags extracted from that spectrum, thus reducing the number of comparisons to be made and the search time. The concept of sequence tag-assisted database searching has been further extended in recent years [116-122]. InsPecT [120] and TagRecon [123] are two examples of freely available open-source peptide identification tools that use tags as a filter to conduct the peptide identification (see Table 1). Several improved methods for sequence tag extraction have been recently presented as well [124-126]. As an alternative to using short sequence tags, one can extract longer subsequences using de novo methods to create a “spectral dictionary” [127, 128], or allow gaps in the sequence tags (“gapped peptides”) [129] which can then be searched against the sequence database.
Hybrid approaches are particularly useful for the identification of post-translationally or chemically modified peptides [123, 130, 131]. Allowing all possible types of modifications at all possible sites leads to a combinatorial explosion of the search space and is therefore poorly compatible with sequence database searching. The use of sequence tags, or related approaches such as look-up peaks[132], can reduce the size of the search space back to manageable levels.
4. Strategies for more comprehensive interrogation of MS/MS datasets
Despite improvements in MS instrumentation and peptide identification methods, in a typical large-scale dataset a significant number of MS/MS spectra remain “unassigned” (i.e. there is no high confidence peptide assignment to the spectrum) when analyzed using existing tools [133]. Many of these spectra are of high quality, as measured using various spectral features [76, 78, 134]. High quality spectra may remain unidentified in a typical data analysis workflow due to several reasons: constrained database search parameters (e.g. search for tryptic peptides only), inaccurate charge state or mass measurement of the precursor peptide ion, the presence of chemical or post-translational modifications not considered in the search, and incompleteness of the searched protein sequence database [133, 135, 136]. As a result, a number of strategies have been recently proposed for more comprehensive interrogation of MS/MS datasets to increase the number of identified peptides, of which peptides containing PTMs and novel peptides are of most biological interest. These strategies include ‘unrestrictive’ or ‘error-tolerant’ database searching, searching against a combination of proteomic and genomic databases [52, 54], and multi-stage search strategies involving multiple peptide identification tools or iterative application of the same tool.
4.1 Unrestrictive (“blind”) and error-tolerant searches
While conventional strategies (including sequence tag-assisted database searching) allow only certain types of user-defined PTMs, unrestrictive or “blind” algorithms attempt to look for all possible post-translational or chemical modifications. In the extreme case, these tools may allow any mass shift between the mass of the database peptide and the precursor ion mass of the sequenced peptide (including mass shifts not corresponding to any known modification). Such methods are sometimes extended to include “error-tolerant” searches in which the algorithm allows one or more mismatches between the sequence of the peptide that produced the MS/MS spectrum and the database peptide sequence as a way to look for peptides containing sequence polymorphisms. One class of unrestrictive PTM search tools naturally builds on the concept of sequence tags [123, 137-139] reflecting the original (error-tolerant search) motivation behind that strategy [115]. Alternatively, the unrestrictive search can be conducted via spectrum to sequence alignment [140-143], spectral clustering [144, 145], peptide motif analysis [146, 147], or other methods [148, 149].
4.2 Multi-stage strategies
Several database search tools (e.g. X! Tandem [150], SpectrumMill, and MASCOT [151]) allow iterative (multi-pass [152]) analysis. Furthermore, some tools, e.g. Paragon [122] - a module of Protein Pilot - implement it as the main strategy [41]. The analysis may start with an enzyme-constrained search and allowing only most common modifications (or no modifications at all), which is then extended to look for peptides with less frequent modifications, nonspecific cleavages, etc. These additional searches may be performed only against the sequences of the proteins that were identified by at least one high scoring peptide in the initial search (“subset database”).
More elaborate multi-stage strategies use a combination of several different computational tools. For example, the analysis may again start with conventional database searching (possibly including multiple database search tools [153, 154]), but then involve the use of spectral library searching [152, 155-157], blind searching for PTMs, and genomic database searching [156] (see Figure 3 for illustration). Application of such strategies in a sequential manner, in which only high quality spectra that remain unassigned at a particular stage are passed to the next level of the analysis, allows increasing the number of assigned MS/MS spectra without a substantial increase in the computational time [51].
Figure 3. Example of a multi-stage peptide identification strategy.

MS/MS spectra are first analyzed using conventional database searching, and peptide identifications are processed using statistical data validation tools. A spectral quality assessment tool is used to select unassigned high quality spectra. These spectra are reanalyzed using multiple search tools, normal and blind PTM search mode, against the subset protein sequence database. In addition, spectra are analyzed using SpectraST spectral library search tool using a combination of the previously available and experiment specific spectral libraries. The remaining unassigned spectra are searched against the translated genomic database to identify novel peptides and peptide polymorphisms. Adapted from [156].
In addition to simply increasing the number of identified MS/MS spectra, multi-stage strategies described above can assist in obtaining a more complete picture of how the rates of various modifications (post-translational and chemical), as well as the proportions of peptides that are semi-tryptic peptides or contain multiple missed cleavages, vary from sample to sample as a function of the experimental or sample handling conditions. Such an analysis is particularly important in the context of targeted proteomic studies using SRM assays, where accurate peptide quantification requires normalization to account for peptide modifications and changes in the efficiency of trypsin digestion [158]. It is likely that multi-stage strategies will play a prominent role in future proteomic studies. It should be noted, however, that routine application of such strategies, especially in the high throughput environment, requires substantial additional work on the development of statistical error rate estimation methods applicable to such complex strategies.
5. Statistical confidence scores and error rates for peptide to spectrum matches
With an ever increasing size of experimental datasets, proteomic research is increasingly dependent on the automated processing of MS/MS spectra using computational tools described above. While the database search tools produce a match for almost every input MS/MS spectrum, only a fraction of those peptide to spectrum matches (PSMs) are true. In certain datasets, especially those generated using low mass accuracy instrumentation, incorrect PSMs are the majority. The main reasons for such a high failure rate are well known (see above and also [51, 159, 160]). Thus, the development of methods for assessing the confidence of PSMs, and for estimating the error rates resulting from filtering PSM data has become a crucial task (see Figure 4 for illustration). In the remainder of this section, unless otherwise noted, the discussion will focus on the statistical validation of the PSMs in the context of sequence database searching.
Figure 4. The need for statistical validation of peptide identification data.
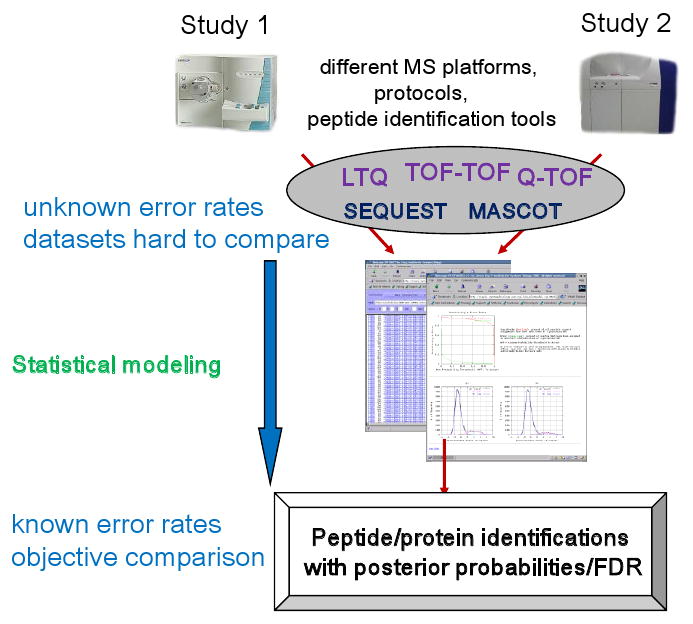
MS/MS data can be generated by different groups using different type of MS instruments, and peptides assigned to spectra using a number of different database search tools. Filtering of peptide and protein identification datasets using simple score cut-offs results in unknown error rates in each dataset, and prevents objective comparison of different datasets. Statistical modeling and conversion of the original search scores into posterior peptide and protein identification probabilities allows error rate estimation and cross-dataset comparison.
The process of assessing the validity of a PSM is not limited to the information contained in the database search score, but also can benefit from the use of auxiliary information (see section 6.2). However, for the sake of clarity, the discussion below will start with a focus on the database search scores as the primary source of information used for distinguishing between true and false identifications. The problem of assessing the confidence of a single PSM is considered first, and then the analysis is extended to the case of large datasets.
5.1 Single spectrum confidence scores
When an MS/MS spectrum is searched against the database, the outcome is a list of top scoring candidate database peptides ranked according to the database search score (e.g. hyperscore in X! Tandem, cross-correlation Xcorr score in SEQUEST) measuring the similarity between the acquired and the theoretical spectrum (or between the acquired spectrum and the library spectrum). Typically, only the top scoring candidate peptide – the best match- is considered as a possible correct match (going beyond the best match was recently investigated in [161]). The score of the best match can be converted into a statistical measure called p-value, or its close relative - the expectation value (E-value) [162] (see Figure 5 for illustration). For each best matching peptide assignment to an MS/MS spectrum, the null (random) distribution of scores can be estimated by constructing the histogram of scores for all candidate database peptides (excluding the best score) that were scored against that spectrum. One can then reference the score of the best match to the null distribution, and assign a significance measure to the best match. The further away the best match score is located from the core of the null distribution, the higher the statistical significance of the match (i.e., it is more likely to be correct). These steps essentially represent the classical p-value computation as the tail probability in the distribution generated from random matches. To calculate the p-value one either has to assume that the distribution of database search scores for any MS/MS spectrum follows a certain parametric (e.g. Poisson) distribution [163, 164] (with spectrum-specific parameters), to justify a (possibly non-parametric) theoretical derivation for the tail part of the distribution [165, 166], or to perform empirical fitting of the observed distribution of scores [162, 167]. Figure 5 provides a simple illustration of how this type of conversion can be done empirically. E-value is related to p-value but has a more convenient interpretation as the expected number of peptides with scores equal to or better than the observed best match score under the assumption that peptides are matching the acquired MS/MS spectrum by random chance. An alternative approach recently proposed in the literature is based on the concept of generating functions, which essentially considers the top score not relative to the distribution of scores for other (lower scoring) candidate database peptides, but rather with respect to the distribution obtained assuming the universe of all theoretically possible peptides [168].
Figure 5. Single spectrum confidence scores.

An acquired MS/MS spectrum is correlated against theoretical spectra constructed for each candidate database peptide. Candidate peptides are ranked according to a scoring function. The highest scoring peptide sequence (the best match) is selected for further analysis. A histogram of the frequency of the occurrence of a particular score S among all performed comparisons is constructed (SEQUEST Xcorr score is used in this example), normalized to the total number of candidate database peptides n, and fitted using a model distribution P(s) (Gaussian distribution, dashed line). The area under the right tail of P(s) that extends beyond the top score Sm is computed, and then converted into the expectation value. The E-value is used in place of the original database search score for all subsequent analysis and data filtering.
The p-values or E-values computed as described above are single-spectrum statistical confidence measures. These scores, unlike the original search scores, are largely invariant under different scoring methods, and thus provide a clearer interpretation of the goodness of the identifications across different instruments, search algorithms, and the search parameters specified in those algorithms. However, the single-spectrum statistical measures are not sufficient when the analysis involves simultaneous processing of multiple MS/MS spectra. In those cases, a multiple testing correction of the individually computed p-values becomes necessary to account for multiple PSMs evaluated simultaneously. Even when requiring a very low p-value indicating high statistical significance for a particular PSM, in the presence of many MS/MS spectra in the dataset there could be many matches with similarly low p-values by random chance alone. At the same time, adjusting the threshold p-value to achieve a specified overall low error rate using classical adjustments such as “Bonferroni correction” [169] is known to produce overly conservative results (the Bonferroni correction, a representative family-wise error rate measure, was not designed for large size of datasets generated in genomics and proteomics applications). Therefore, additional modeling is required to calculate statistical measures more suitable for filtering of very large collections of PSMs.
5.2 Posterior probabilities and false discovery rates (FDR)
In the case of large datasets, the most commonly used and accepted statistical confidence measures are the false discovery rate (FDR) as a summary statistics for the entire collection of PSMs, and the posterior probability or local FDR (denoted here as fdr) for individual PSMs. In the mass spectrometry terminology, FDR is defined as the expected proportion of incorrect PSMs among all accepted PSMs (a global property of a filtered list), whereas the posterior probability of an individual PSM (1 – fdr) is an estimated fraction of correct PSMs among a collection of PSMs having similar search scores (or similar p-values/E-values). The concept of FDR was pioneered by Benjamini and Hochberg, where the initial concept, the so called step-up FDR [170], was applied to ordered p-values under the assumption that all p-values are statistically independent (this and other assumptions have since been removed or relaxed in many following works). Other methods for controlling FDR include permutation-based methods [171] and Empirical Bayes [172, 173]. It should also be noted that the global methods (FDR and posterior probabilities of individual PSMs) and single-spectrum based approaches described above are complementary. In other words, global dataset modeling and FDR analysis can be performed for a set of PSMs ranked by individually computed p-values or E-values. It is also worth repeating that the computation of FDR and posterior probabilities for individual PSMs is based on the analysis of global distribution of PSM scores in the entire dataset (multiple MS/MS spectra, and considering the single top scoring PSM per spectrum), whereas the single-spectrum values such as p-values are based on modeling of the single-spectrum distribution (single MS/MS spectrum scored against all candidate database peptides).
5.3 Target-decoy strategy for FDR assessment
In the area of MS/MS-based proteomics, the methods for computing FDR can be broadly grouped into two categories. The discussion here starts with a simple approach based on the use of the target-decoy database search strategy [174]. The target-decoy approach requires minimal distributional assumptions and is easy to implement, which makes it easily applicable in a variety of situations. The strategy requires that experimental MS/MS spectra are searched against a target database of protein sequences appended with the reversed (or randomized, or shuffled) sequences of the same size (see Figure 6 for illustration). Alternatively, the searches against the target and decoy sequences can be performed separately (the differences between these two approaches are discussed below). A similar approach can be used for spectral library searching [175]. The basic assumption is that matches to decoy peptide sequences (decoy PSMs) and false matches to sequences from the target database follow the same distribution. The plausibility of these assumption was discussed in [174]. In the second step, PSMs are filtered using various score cut-offs (e.g. a certain X! Tandem E-value or MASCOT Ion Score cut-off), and the corresponding FDR for each cut-off is estimated as Nd/Nt, where Nt is the number of target PSMs with scores above the cut-off, and Nd is the number of decoy PSMs among them. The underlying assumption is that, given the equal size of the target and decoy database, the number of incorrect target PSMs, Ninc, can be estimated as the number of decoy PSMs. Alternatively, the FDR is sometime estimated as 2Nd/(Nt+Nd).
Figure 6. Target-decoy strategy for FDR assessment.

In one common application of this strategy, all MS/MS spectra from the entire experiment are searched against a composite target plus decoy protein sequence database. The best peptide match for each spectrum is selected for further analysis. The numbers of matches to decoy peptides are counted and used to estimate the false discovery rate (FDR) resulting from filtering the data using various score thresholds.
The accuracy of these FDR estimates depends on the details of the target-decoy database search. There are two commonly used options: two separate searches against the target and the decoy database, and a single search against the concatenated target plus decoy database [176-178]. In the separate target-decoy search strategy, FDR computed as Nd/Nt is a conservative estimate due to the fact that the number of decoy PSMs, Nd, overestimates Ninc when all MS/MS spectra are allowed to match to sequences in the decoy database (including spectra that can be matched correctly to sequences from the target database). This can be corrected by taking into account the proportion of PSMs in the dataset that are incorrect [179]. Note that such a correction was not applied in many studies that used the separate target and decoy database search strategy, see e.g. [180-182]. In practice, a far more common option is to perform the search against the concatenated target-decoy database (see, e.g. [174] and references therein), which is less sensitive to this problem. Still, the combined strategy may also result in a conservative estimate due to the peptide competition effect: some MS/MS spectra may match to a peptide from the decoy database with a score higher than that the score of the true match. This, in turn, reduces the total number of correct PSMs (a negative characteristics by itself [183]), and thus increases the FDR. To address this, a modified approach has been suggested that is based on the analysis of the distributions of PSM scores obtained using two separate searches, but correcting for the competition effect [184].
Decoy sequences can be created using several methods, e.g. via randomization, shuffling, or simple reversal of the target sequences. A number of studies have investigated the differences between various decoy sequence generation methods, and generally found these differences to be insignificant [174, 183, 185]. A more fundamental issue, however, is that none of the existing decoy database creation methods capture all significant sources of false identifications. As previously noted in [176], incorrect peptide assignments can be considered as coming from two different sources: truly random matches, and incorrect matches to peptides homologous (directly in the sequence domain, or indirectly in the m/z domain) to the true peptides. When creating decoys using any common method, e.g. reversing or randomizing target protein sequences, it should be possible to derive an accurate representation of the distribution of random matches. The second source of the false positives, however, remains underestimated. While the problem may be less severe at the level of PSMs, it may produce a bias in the error rate estimates derived at the protein level. Even at the PSM level, the problem can be quite severe in the case of PTM identifications, or searches performed against large databases such as those generated based on six frame translation of sequences in genomic databases. For example, many high scoring PSMs corresponding to novel peptides resulting from searching against EST databases can be explained as likely false positives, with the true sequences being highly abundant peptides chemically modified during the sample preparation steps. So far, this problem remains underexplored, with only a few attempts to generate decoy databases using more sophisticated rules that preserve some of the sequence homology of the target database [186].
5.4 Mixture model methods for computing posterior probabilities and FDR
While the target-decoy strategy allows estimation of global FDR, it does not provide a statistical confidence score for individual PSMs. The analysis of large datasets can be carried out in a more informative fashion when the posterior probability that a particular PSM is correct (which is essentially the compliment of the local FDR, i.e. 1 – local FDR) is estimated and then utilized as the baseline measure to distinguish between correct and incorrect identifications. Posterior probabilities can be computed using a general class of mixture model-based approaches similar to that introduced by Efron et al. [173]. In the context of peptide identification, the mixture model-based error rate analysis was introduced in [25], and implemented in the computational tool PeptideProphet. Mixture model is a statistical approach that explains the distribution of interest (here, the distribution of database search scores S observed for all PSMs in the dataset) as a mixture of multiple components (here, two: correct and incorrect PSMs), see Figure 7 for illustration. In this approach, the mixing proportion (fraction of all PSMs in the dataset that are correct, π1 in Figure 7) and other parameters governing the distributions of scores for correct and incorrect PSMs (f1(S) and f0(S), respectively) are estimated from the data using, e.g. the expectation maximization (EM) algorithm).
Figure 7. Mixture model approach for computing posterior probabilities.

All MS/MS spectra from the entire experiment are searched against a protein sequence database (without the need to append decoy sequences). The best database match for each spectrum is selected for further analysis. The most likely distributions among correct (dotted line) and incorrect (dashes) PSMs are fitted to the observed data (solid line). A posterior probability is computed for each peptide assignment in the dataset. The parameters of the distributions, including the mixture proportion π1 are learned from the data using e.g. the EM algorithm.
The outcome is a posterior probability computed for each individual PSM, which in turn can be used for probability-based filtering of the entire collection of PSMs (e.g. requiring the posterior probability of PSM P > 0.99). These posterior probabilities can also be used to estimate the FDR. Thus, the dataset can be filtered using the probability threshold that corresponds to a desired FDR. The method is illustrated in Figure 8. Often, PSM data is only minimally filtered and taken as input to the next level of the analysis, in which the probabilities are recomputed and the FDR control is carried out at the protein level (see section 7.2). A note on the choice of terminology: in [25], the FDR measure was described as the false positive identification error rate because the FDR terminology had not been established at the time yet. The explicit connection between the posterior probability computed in PeptideProphet and the local FDR has been discussed in [187]. The term posterior error probability (PEP) is sometimes used instead of local FDR [178].
Figure 8. Example of converting database search scores into posterior probabilities.

The observed distribution (histogram) of MASCOT Ion Scores for all peptide to spectrum matches in this dataset is shown (solid blue line). In the parametric model, MASCOT Ion Scores are modeled in unsupervised way using a mixture of a Gaussian (correct, red dashes) and an extreme value distribution (incorrect, green dashes). Based on the ratio of the tails of these two learned distributions, it converts the Ion Score into a posterior probability. Inset: the mapping between the original score and the probability. Posterior probabilities can be used to filter the data as to achieve a desired FDR, estimated as shown on the right. FDR of 0.01 in this dataset approximately corresponds to a MASCOT Ion Score of 35, indicated by the dashed vertical line in the inset.
While the original mixture model approach for posterior probability calculation was parametric and unsupervised with respect to the distribution modeling step [25] (as illustrated in Figure 8), these limitations have since been relaxed. First, the method was extended to incorporate the information from decoy PSMs in the mixture estimation algorithm [187]. The decoys are exploited by allowing their scores to contribute to the estimation of the incorrect PSM distribution only. This way, decoys effectively yield a stable reference distribution of incorrect PSMs, making the posterior probabilities and FDR estimates more accurate and robust. The use of decoys essentially makes the mixture modeling step semi-supervised, in the sense that the class labels are known a priori for some but not all PSMs. The parametric assumptions of the conventional mixture model approach can be relaxed as well. This can be achieved again by utilizing the decoy peptides for non-parametric estimation of the shape of the distribution for incorrect PSMs, simultaneously with the estimation of the parameters of the correct PSM distribution and the mixture proportion using a semi-parametric density estimation method [188]. A more computationally intensive and thus time consuming m(the variable mixture component model [188]). Non-parametric approaches allows accurate modeling of the distribution of scores for any search engine without the need to select the shapes of the distributions of the mixture components that best fit the data.
These new models [187, 188] have been fully implemented in the current distribution of PeptideProphet [189], which now can process the results from X! Tandem, MASCOT, OMSSA, Phenyx, ProbID, InsPecT, and MyriMatch, in addition to the originally supported SEQUEST. The use of non-parametric methods for computing posterior probabilities has recently been reported in other tools as well [190-193]. Also of note is that the non-parametric models can be successfully applied to model the results of sequence tag-based methods [126], and should be applicable to spectral library searching as well. An alternative method to relax the parametric assumptions is to increase the number of (Gaussian) mixture components as in the variable mixture component model [188]. This model, however, has drawback of being more computationally intensive and thus less practical. The number of mixture components can also be increased in a more computationally efficient way and without the use of decoys [194], although such an approach is likely to be less robust.
Several other classes of statistical methods for computing the probabilities of individual PSMs have been proposed that rely on more elaborate mathematical modeling of the underlying distributions of scores [195, 196]. While these methods may have some advantages over empirical approaches, they are harder to extend to incorporate multiple search scores and/or various auxiliary information. This type of information, as discussed in the next section, can significantly improve the statistical power of the computed confidence scores for separating true from false identifications.
6. Advanced statistical and machine learning methods for the analysis of MS/MS datasets
The discussion above focused on the analysis of MS/MS datasets and the resulting PSMs that were sorted, filtered, and whose confidence was quantified using a single database search score. However, this represents a very incomplete picture of the entire peptide identification process.
6.1 Derivative database search scores
First, in some scoring schemes (especially those based on cross correlation or shared ion counts), one can compute a number of derivative scores. For example, in addition to the main score of SEQUEST, Xcorr, one can define a class of “delta” scores of which the most commonly used one is ΔCn, the normalized difference between the Xcorr scores of the best and the second best scoring candidate database peptides for a given spectrum [25, 187]. These derivative scores are also useful for discriminating between true and false PSMs. In fact, in certain cases the delta scores may be more discriminative than the absolute scores (see section 6.4 for an additional discussion and illustration using a real dataset). It is also interesting to note that when the search score is converted to a p-value by referring it to the null (random) distribution as described above (single-spectrum statistical scores, Figure 5), the resulting p-value (E-value) reflect both the absolute score and the delta score, with a higher contribution from the latter. Similarly, the Energy-score of the generation function approach [168] is closely related to the concept of delta scores, albeit it represents the difference between the best database peptide score and the score of the best possible interpretation (i.e., the best score assuming the universe of all possible peptides). The original (absolute) scores and their derivatives are not independent, e.g., a strong correlation is observed between ΔCn and Xcorr. Still, these scores are complementary, i.e. combining both scores often allows improved discrimination between true and false PSMs [25-27, 29, 197-199].
6.2 Auxiliary information
The discrimination between true and false PSMs in large datasets can also be improved by including auxiliary information that may be generated in the course of the experiment (see Figure 9). These include: (1) mass accuracy, ΔM - the difference between the measured and calculated mass of the peptide ion available from the first stage of MS, MS1; (2) peptide separation coordinates such as retention time [199-201] or pI value [11, 202, 203] (peptide separation steps); (3) the number of peptide termini consistent with the type of enzymatic cleavage used (NTT) and the number of missed cleavage sites (NMC) (digestion step); (4) the presence of a specific amino acid or sequence motif, e.g., cysteine in the case of avidin affinity purification of peptides containing biotinylated cysteines, or the sequence motif N-X-S/T for peptides containing N-linked glycosylation sites [204] (peptide enrichment steps). The most general sources of the auxiliary information (ΔM, NTT, NMC) can be used to restrict the set of candidate database peptides during the database search step. Alternatively, these parameters and other auxiliary information can be used as a part of the post-database search statistical analysis.
Figure 9. Auxiliary information useful for statistical validation of peptide identifications.
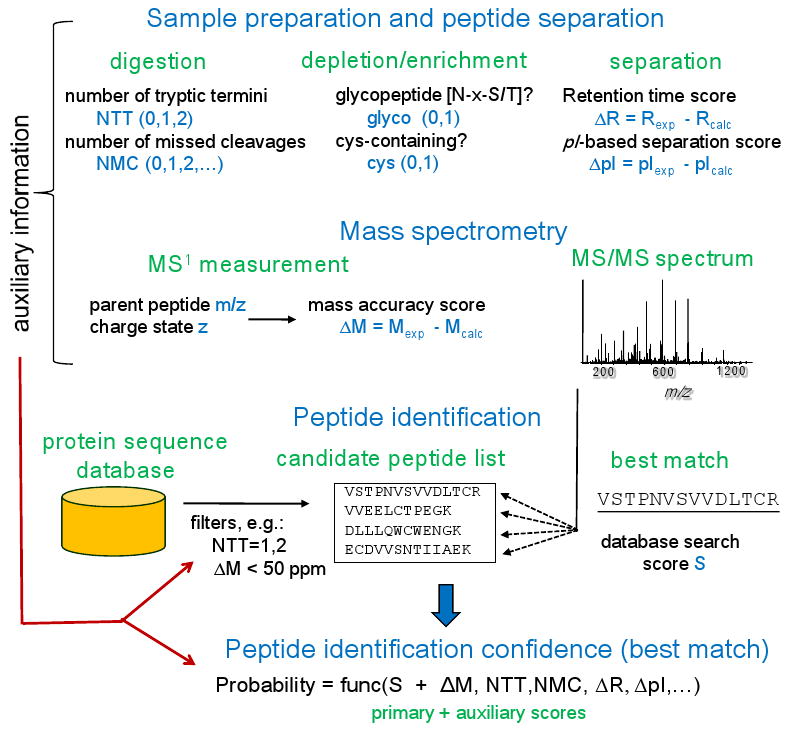
While acquired MS/MS spectra are the primary source of information used for peptide identification, auxiliary information available from various stages of the experiment can also be useful for discriminating between true and false identifications. Some auxiliary parameters (e.g., mass accuracy ΔM and the number of tryptic termini NTT) can be used to restrict the set of candidate database peptides during the database search. Alternatively, it can be utilized in the post-database search statistical analysis in addition to the database search score.
It is possible to take into account the auxiliary information even in simple threshold based-filtering approaches [200, 203, 205-207] coupled with the target-decoy FDR estimation strategy. For example, after performing the database search, one may elect to filter out all PSMs with high ΔM values. In the case of pI-base peptide separation prior to MS analysis, one can filter out all peptide identifications having a calculated (based on the peptide sequence) pI value outside of the range of values expected for peptides from a particular sample fraction. However, in such a simple approach dealing with experimental variation (e.g., a bias in the mass measurement, or inaccurate determination of the expected pI value in each peptide fraction) can be problematic. In part, this can be addressed by using iterative mass [86, 208-212] or retention time [209, 213, 214] or pI data calibration steps. Alternatively, auxiliary information can be incorporated in mixture model-based methods and other advanced statistical approaches as described below.
6.3 Joint modeling of multiple sources of information
While the lists of PSMs can be processed by applying multiple independent filters for both the search scores (e.g. Xcorr, ΔCn) and various auxiliary parameters, such an approach is suboptimal and requires sufficiently large dataset size due to the need to subdivide PSMs into multiple subcategories. This is where statistical modeling approaches such as PeptideProphet have a particular advantage. By jointly modeling multiple sources of information (the search scores and the auxiliary information such as ΔM, NTT, NMC and etc.) [8, 25, 202], PeptideProphet has an inherent flexibility to detect and correct for a measurement bias (e.g. in mass measurement), and to weigh the contributions of the different types of information in an experiment-specific manner when computing posterior probabilities.
The approach implemented in PeptideProphet represents a combination of supervised and unsupervised modeling. Its supervised part is related to the calculation of the combined score (called “discriminant database search score” or just “discriminant score” in PeptideProphet). When multiple scores are used (e.g. Xcorr, ΔCn in SEQUEST; hyperscore and its derivative delta score in X! Tandem), they are combined using the discriminant function developed based on training data [25, 187]. The rest of the analysis for computing the posterior probabilities and FDR estimation is carried out in an unsupervised fashion in which the discriminant score distributions among correct and incorrect PSMs are learned from each dataset anew using the EM algorithm. To include the auxiliary information, the joint distribution of the search score (or the discriminant database search score) and the auxiliary information is modeled as a multivariate mixture distribution with two components representing correct and incorrect PSMs, respectively (see Figure 10 for illustration). It is assumed that conditional on the identification status, the marginal distributions of the individual variables are independent, which is generally the case with variable used in PeptideProphet. Appending decoys to the sequence database enables semi-supervised and semi-parametric mixture modeling for improved accuracy of posterior probability estimates, as discussed above.
Figure 10. Statistical modeling in PeptideProphet.

In addition to the database search score S, PeptideProphet models other discriminant features, e.g. ΔM, NTT, NMC, and the normalized ΔpI score. If the searched protein sequence database contains decoy sequences (optional), the modeling can be performed in a semi-supervised way in which the distributions of scores observed for decoy peptides help to derive the mixture components (histograms) for each of the scores used in the modeling (red: correct PSM; green: incorrect). The outcome of the modeling is the posterior probability P computed for each peptide to spectrum match.
An extension to PeptideProphet that is based on an adaptive approach for computing the coefficients in the discriminant function for combining multiple database scores has being investigated in a recent work [161]. Such an approach removes most of the reliance on the training dataset. The conclusion reached in that study was that the improvement from using the adaptive approach was not significant, except for highly constrained searches (i.e., very narrow mass tolerance, allowing tryptic peptides only). In the case of highly constrained searches the discriminating power of the delta scores (e.g. ΔCn in that study) significantly diminishes reflecting increased variability caused by a significant reduction in the number of candidate database peptides per searched MS/MS spectrum (discussed below in more detail, see section 6.4). As a side note, this observation raises an important question of whether the conventional calculation of the p-values or E-values as described in section 6.1, or even the calculation of the search scores themselves when those scores implement certain elements of probabilistic modeling (e.g. MASCOT's Ion Score) are reliable in the case of such highly constrained searches.
Percolator is another computational tool based on a machine learning approach that utilizes multiple scores and computes posterior error probabilities and FDR (or, more precisely, a closely related measure called q-score) for a set of PSMs. Percolator reduces the dependence on the training data via a dynamic learning approach [215], in which the original fully supervised approach [27] based on a support MASCOT [216] search results. The concept of adaptive (dynamic) training and direct optimization were also recently explored by other groups with a specific focus on phosphorylated peptides [217, 218]. Finally, improved discrimination can be achieved by combining the output from two or more different database search tools [154, 155, 198, 219-223], or by combining data from multiple consecutive stages of mass spectrometry (e.g., MS2 and MS3) [181].
6.4 Database search parameters and their effect on peptide identification and statistical assessment
In peptide identification by database searching, the average number of candidate peptides selected for scoring against each MS/MS spectrum has a significant effect on the downstream statistical analysis and the overall success rate. The question of what search parameters are optimal for deriving the highest number of correct identifications at a fixed FDR is of great practical importance. This question is particularly relevant in the case of high mass accuracy instruments such as LTQ-Orbitrap, where performing searches with very narrow mass tolerance is an attractive option [206]. It has also been debated whether the search should be limited to tryptic peptides only [224, 225]. These questions were recently investigated in [161], with a somewhat counterintuitive observation regarding the outcome of opening up the search space (i.e. using higher mass tolerance than necessary given the accuracy of the instrument). While it leads to an increase in the number of candidate database peptides, and thus an increased possibility of a false match, with the help of the mass accuracy parameter ΔM at the subsequent data analysis stage there may be a net positive effect.
This is further illustrated in Figure 11, which presents the results of two SEQUEST database searches of the same control protein mixture dataset generated on a high mass accuracy LTQ-FT instrument (see [161] for details). The searches were carried out allowing tryptic peptides only and with either narrow precursor ion mass tolerance (0.01 Dalton, which translates into ∼ 10 ppm for peptides with a singly protonated peptide mass around 1000 Dalton), or with a wide mass tolerance (3 Dalton). The effect of the mass tolerance on the distribution of Xcorr score among correct and incorrect PSMs was rather minimal. By opening up the search space, the distribution of Xcorr scores for incorrect PSMs shifted, as expected, slightly toward higher scores, reflecting the large pool of candidate database peptides available for (random) matching (compare Figure 11a and b).
Figure 11. Comparison between peptide identification results in the case of database search with narrow or wide peptide mass tolerance.
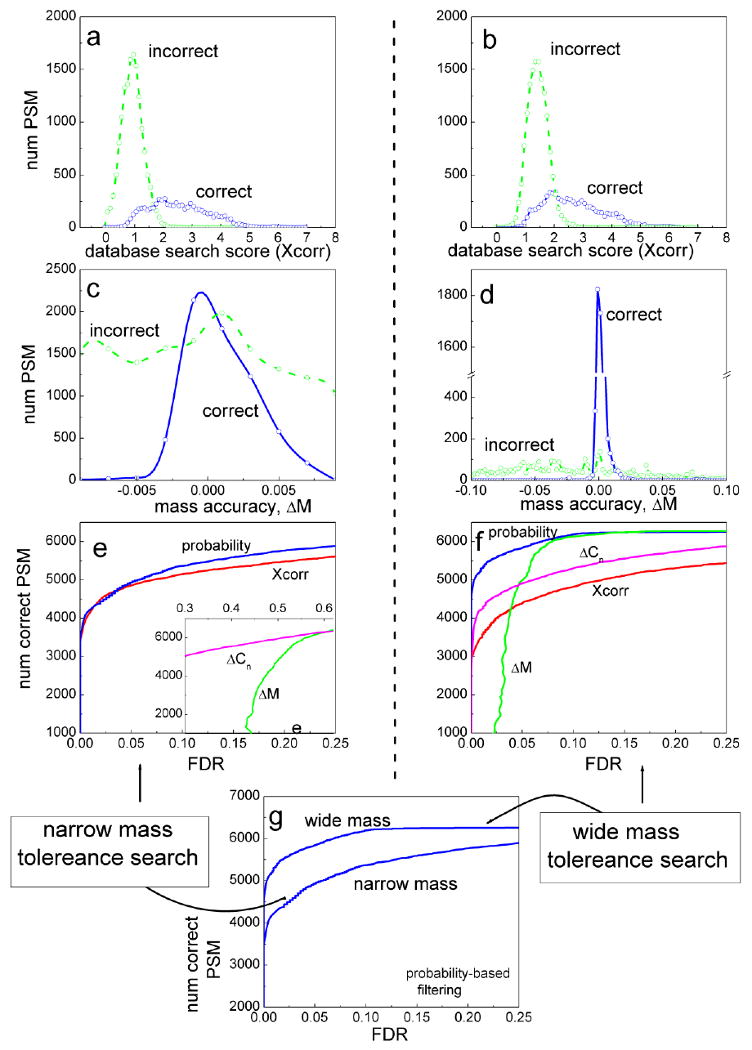
MS/MS data was generated from a control protein mixture using an LTQ-FT instrument (see [161] for details). Spectra were searched with SEQUEST, allowing tryptic peptides only, and with either 0.01 Dalton (left side) or 3 Dalton (right side) peptide ion mass tolerances. (a),(b): the distributions of SEQUEST Xcorr scores among correct (blue) and incorrect (green) PSMs. (c),(d): the distributions of ΔM scores. (e),(f): the number of correct PSMs plotted as a function of FDR that can be obtained by filtering PSMs using cut-offs based on individual scores: Xcorr (red line), ΔCn (purple), ΔM (green), and PeptideProphet computed posterior probabilities (blue). Inset in (e) shows the region of higher FDR values. (g) The number of PSMs identified as a function of FDR in the case of wide and narrow mass tolerance searches (data filtered using posterior probabilities).
The effect of mass tolerance on ΔM distributions was obviously far more pronounced than in the case of Xcorr score. The distribution of ΔM scores for correct PSMs is always centered on 0 (correcting for a small mass measurement bias). At the same time, with increasing mass tolerance, ΔM distribution for incorrect PSMs becomes distributed across a wider range of possible values [187, 188]. This in effect increases the proportion of correct vs. incorrect PSMs with ΔM close to 0. The more pronounced are the differences between ΔM distributions observed for correct and incorrect PSMs, the more discriminant ΔM becomes for filtering the data. In fact, Figure 11f (wide mass tolerance search) shows that ΔM in the higher (but not too high) FDR range becomes a more useful score for separating true from false PSMs than Xcorr and ΔCn scores. In the case of narrow mass tolerance search (Figure 11e), ΔM is only marginally useful since high mass accuracy is already utilized as a filter in selecting candidate database peptides.
At the end, PeptideProphet learns the distributions of ΔM values (and other scores) from the data and factors them into computing the posterior probabilities. The more pronounced are the differences between ΔM distributions among correct and incorrect identifications, the more discriminating the computed probabilities become for filtering the data. As a result, when filtering the data using posterior probabilities computed by PeptideProphet, it is possible to identify a larger number of PSMs at the same FDR in the case of wide mass tolerance search compared to the narrow one (Figure 11g). A similar trend is often true for several other peptide properties, most notably the number of tryptic termini NTT.
To supplement the discussion on the role of the delta scores (see section 6.3 above), Figure 11e and 11f also show the discriminating power of ΔCn score. Interestingly, in the case of wide mass tolerance search ΔCn is more discriminative than Xcorr. In the case of narrow mass tolerance search, however, ΔCn becomes far less useful. The figure also plots the results of filtering the data using the posterior probabilities computed by PeptideProphet. By combining the information from all three scores discussed here, Xcorr, ΔM and ΔCn, in the case of wide mass tolerance search the posterior probabilities are significantly better at separating correct from incorrect PSMs than each score on its own (in the most relevant range of FDR below 0.05). The advantage of posterior probabilities compared to Xcorr for filtering the data is less significant in the case of narrow mass tolerance search because, as discussed above, ΔM and ΔCn in this case do not significantly contribute to discrimination in the range of low FDR values.
It is also worth pointing out that opening up the search space effectively creates a decoy peptide population without actually adding decoy sequences to the database [187]. For example, in an enzyme unconstrained search, each spectrum is compared against a set of candidate peptides that includes peptides not likely to be present in the analyzed sample (i.e., non-tryptic and, to a large degree, semi-tryptic peptides). In the case of protein digestion with trypsin under most common conditions (and not considering samples with a high degree of protein degradation such as serum or plasma), less than 1% of all correct PSMs are non-tryptic peptides (NTT=0), and typically less than 10% are semi-tryptic (NTT=1). In contrast, the majority of incorrect PSMs have NTT=0 or 1. Thus, the shape of the distribution of scores for PSMs with NTT=0 or 1 is a good representation of the distribution of scores of all incorrect PSMs. In other words, PSMs with NTT=0 (and most of PSMs with NTT=1) serve as internal decoys (pseudo-decoys). The same logic applies to other auxiliary scores (again, most notably ΔM in the case of wide mass tolerance searches). As a result, PeptideProphet is able to deconvolute the observed distribution of database search scores even if it does not appear bimodal (see Figure 12). This, in turn, explains in part why PeptideProphet is able to derive accurate posterior probabilities even without the use of artificial decoys added to the database, as long as the database search is performed in not an overly constrained manner. Still, adding at least some decoys to the sequence database is desirable in the case of highly constrained searches or challenging datasets as it enables semi-supervised and semi-parametric modeling (see section 6.2 above) for improved robustness of the mixture model approach.
Figure 12. Unconstrained database searches and improved robustness of posterior probability calculations.

Solid black line shows the observed distribution of PSM scores (SEQUEST discriminant scores, fval) in a mouse liver dataset taken from [224]. MS/MS spectra were searched using SEQUEST against a mouse IPI database with a narrow mass tolerance (0.005 Dalton) but in an enzyme unconstrained mode. Dotted lines show the underlying distributions of scores among correct and incorrect PSMs learned by PeptideProphet. These distributions match closely the distributions of scores observed for fully tryptic (NTT=2) and non-tryptic and semi-tryptic (NTT=0, 1) peptides. PSMs with NTT=0 and 1 effectively serve as pseudo-decoys in statistical modeling, allowing accurate deconvolution of the observed distribution of fval scores into the two mixture component.
One obvious drawback of performing unconstrained searches that may negate all potential benefits of opening up the search space is the substantial increase in the database search time. Furthermore, the optimal settings for performing the searches are likely to be different for different search tools and post-database search processing options. For example, opening up the search space is generally not recommended in the case of MASCOT, in part due to lower sensitivity of the scoring function implemented in that tool compared to that of SEQUEST. The nature of the analyzed sample and the experimental protocols used to generate MS data are bound to play an important role as well. Thus, future work in this area should include a more detailed analysis of the optimality of the database search condition in different setting.
7. Protein identification
In most proteomic studies researchers are interested in the list of identified proteins, and the statistical validation of PSMs described above serves as an intermediate step. To derive the protein summary list, PSMs need to be grouped according to their corresponding protein, and the posterior probabilities and FDR need to be recomputed at the protein level. Many database search tools already provide a protein-centric view of the data in addition to the ranked list of PSMs. However, these tools are not adequate for representing the results of large-scale studies. This is due to the fact that in most studies one has to deal with multiple datasets acquired and processed at different times, and because, as discussed above, post-database search statistical modeling allows improved discrimination between correct and incorrect identifications.
7.1 Issues complicating protein level analysis
Several difficulties have been identified that complicate the process of assembling peptides into proteins: (1) non-random grouping of peptides to proteins, resulting in an amplification of error rates going from PSM to unique peptide to protein level [8, 134]; (2) the loss of connectivity between peptides and proteins due to protein digestion creating the protein inference problem [50].
The first problem is illustrated in Figure 13. The mapping of correct PSMs to proteins is an abundance-driven process, reflecting the fact that more abundant proteins are identified by a higher number of unique peptides and PSMs (as a side note, the relationship between the number of PSMs and the protein abundance can be model using Poisson distribution [226]). For example, in a typical shotgun proteome profiling experiment of a fairly complex organism having 20,000 genes (proteins), a typical outcome would be the identification of ∼ 1000 proteins from an order of magnitude higher number of correct PSMs (filtered at a low FDR). Thus, correct PSMs tend to group into a relatively small number of proteins compared to the size of the proteome of the organism. In contrast, incorrect PSMs are due to semi-random matching to any of the entries (20,000 in this example) from the sequence database. The non-randomness here comes from the differences between proteins in terms of their sequence length, and due to the homology problem that will be discussed later. As a result, in a typical experiment almost every high scoring incorrect PSM adds another incorrect protein identification. This has an important implication in that even a small FDR at the PSM level can translate into a high FDR at the protein level. This effect becomes more pronounced as the number of MS/MS spectra in the dataset increases relative to the number of identifiable proteins in the sample. It also generally makes the identification of proteins based on a single peptide, many of which are low abundance proteins, more difficult.
Figure 13. Amplification of error rates at the protein level.

Multiple correct peptide identifications tend to group into a smaller number of proteins (reflecting the abundance driven nature of MS/MS sequencing). In contrast, incorrect peptide assignments are semi-random matches to entries from a large protein sequence database. Among the 10 shown spectra, 8 are correct (error rate 20%). Incorrect peptide assignments (shown in black) result in two incorrect protein identifications (X1 and X2), whereas 8 correct peptide assignments correspond to only three correct proteins (A, B, C). As a result, a 20% FDR at the peptide level translates into a 40% FDR at the protein level.
The second problem is related to the presence of shared peptides, i.e. peptides whose sequence is present in more than a single entry in the protein sequence database. Such cases most often result from the presence of homologous proteins, alternative splice variants, or redundant entries in the sequence database, and make it difficult to infer the particular corresponding protein (or proteins) present in the sample [50, 227]. Shared peptides are fairly abundant in the case of higher eukaryote organisms. As a result, in shotgun proteomics it is often not possible to differentiate between different protein isoforms. A detailed discussion of the difficulties in interpreting the results of shotgun proteomic experiments at the protein level can be found in [50].
7.2 Computing protein probabilities
For the sake of clarity, the discussion below will first ignore the problem of shared peptides. In this case, the main task of the protein-level modeling is to group PSMs into proteins, and then calculate a statistical confidence score for each protein identification (or, at the minimum, to determine the protein-level FDR for a filtered protein list). A simple and commonly used approach is to apply various filters at the peptide level (e.g. filter the list of PSMs using the database search score(s), E-values, or posterior probabilities) as to achieve a desired protein-level FDR estimated using the target-decoy strategy. The alternative is to perform more advanced analysis combining the evidence from multiple PSMs corresponding to each protein. In statistical methods, the starting point could be the posterior probabilities of PSMs (computed, e.g., using PeptideProphet) and the peptide to protein mappings. The outcome then would be (a) protein posterior probabilities (or just scores) that allows more efficient filtering of data at the protein level and (b) the knowledge of FDR corresponding to each protein probability (score) threshold used to filter the data.
The process of computing protein probabilities necessary involves making various assumptions. A protein can be identified from multiple different peptides. In turn, each peptide can be identified from multiple peptide ions, e.g. from a doubly and a triply charged peptide ion, or in a modified (e.g. phosphorylated) and unmodified forms. In addition, each peptide ion may be sequenced multiple times (redundant PSMs). Additional factors affecting the confidence in the protein identification include the length of the protein (or, more precisely, the number of expected tryptic peptides), the total amount of MS/MS data collected, the size of the protein sequence database, and the number and the dynamic range of proteins in the sample. The question of how to combine different sources of evidence in computing protein probabilities and to account for the factors mentioned above is an active area of research.
In combining the evidence from multiple PSMs corresponding to the same protein, one can simply select the best (i.e. highest score/probability) PSM and use its score as the protein score (the “best peptide” model in Figure 14). This approach can be further extended to require that a protein is identified by not less than a certain number of peptides. For example, in the “two peptide rule” the protein score is essentially computed as 1 if the protein is identified by two or more PSMs with a score above a certain threshold, and 0 otherwise. In doing so, it is typically required that the protein is identified by two different peptides, because redundant PSMs identifying the same peptide sequence cannot be considered as independent events. As a intermediate approach (implemented, e.g., in ProteinProphet), one may count as different peptides the identifications of the unmodified and a modified version of the same peptide, or the identification of a peptide from MS/MS spectra of different charge states.
Figure 14. Computing protein probabilities (scores).

Posterior probabilities (scores) of peptides mapping to the same protein are utilized to compute the protein score. This score is then used to filter the list of protein identifications. Common approaches include taking the score of the highest scoring peptide, applying a multiple- (e.g. two-) peptide rule, computing p-values using a Poisson distribution-based model, or using combined evidence approaches. ProteinProphet utilizes the combined evidence approach, but with an additional adjustment of the initial peptide probabilities to account for non-random grouping of peptides to proteins (adjustment for the number of sibling peptides, NSP). In the case of multiple PSMs identifying the same peptide sequence, typically only the score of the best PSM is used at the protein level. As an option, the unmodified and a modified version of the same peptide can be treated as different peptides, with both contributing to the protein score.
Several statistical methods for combining the evidence from multiple PSMs in computing the protein probabilities (scores) have been reported as well. One approach is to assume that, in the case of incorrect PSMs, the number of such PSMs mapping to a protein follows a certain parametric distribution (e.g. Poisson), leading to the computation of a protein confidence score similar to the conventional p-value statistics. In doing so, the method incorporates the number of PSMs passing a certain minimum score threshold (but not the confidence in individual identifications), the overall size of the database, and the length of each protein [12, 228]. The protein abundance can also be modeled as a latent variable [155]. Statistical methods based hierarchical modeling of peptide and protein identification data have also been recently proposed [229-231], and have certain theoretical advantages compared to the existing simpler approaches. These new methods should be further evaluated in future work, provided the software tools implementing these advanced methods become available.
One commonly used approach, exemplified by the computational model of ProteinProphet, is to compute a cumulative score [223, 232, 233]. ProteinProphet takes as input a list of PSMs and their posterior probabilities (the output from PeptideProphet), and computes a probability that a protein is present in the sample by combining together the probabilities of its corresponding PSMs. However, using the initial PSM probabilities would result in a significantly overestimated probability for many proteins, most notably those identified by a single peptide. This is a direct consequence of the non-random grouping problem mentioned above (see Figure 13). To further illustrate this, assume that all 10 peptides shown in Figure 13 have a posterior probability of 0.8 (i.e. in perfect agreement with the actual FDR of 0.2). At the protein level, these accurate peptide probabilities would translate (using the combined peptide evidence equation shown in Figure 13) into a 0.998 probability for protein A, 0.992 for protein B, and 0.8 for proteins X1, X2, and C. These protein-level estimates are clearly not accurate, as they predict that there is less than one incorrect protein within the list (0.61 to be precise, FDR = 0.12), whereas the actual number is 2 (FDR = 0.4).
To address this problem, ProteinProphet implements an adjustment of the initial PSM probabilities (p → p′ in Figure 13) to account for the protein grouping information - the number of sibling peptides (NSP). Via this adjustment, the method penalizes, i.e. reduces the probabilities of peptides corresponding to ‘single hit’ proteins such as proteins X1, X2, and C in Figure 13, and rewards those corresponding to ‘multi-hit’ proteins (proteins A and B). The appropriate amount of adjustment (reflected in the ratio of the NSP distributions, f0(NSP) and f1(NSP)) depends on the sample complexity, the number of acquired MS/MS spectra, and other factors, and is determined automatically for each dataset via an iterative procedure. In this example, the ideal outcome would be a reduction of the initial probabilities of peptides 2, 8, 9, and 10 (that have no siblings) from 0.8 to ∼ 0.3, resulting in the computed probability of 0.3 for proteins X1, X2, and C, in agreement with the actual protein-level FDR.
Application of more stringent filtering criteria to single hit protein identifications (in ProteinProphet, via the penalty described above) is necessary to keep the error rates under control. However, eliminating all single hit proteins from the final protein summary list is in most cases a suboptimal approach given that these proteins represent 20-30% of all correctly identified proteins in a typical shotgun proteomic dataset. Despite applying the penalty, ProteinProphet does not exclude proteins identified by a single peptide when the peptide has very high posterior probability. In other words, for each protein, the method considers the quality of the supporting evidence (i.e., the peptide probability) in addition to considering the quantity (the number of identified peptides for that protein). While this goes against the commonly used “two peptide rule”, other recent reports also argue in favor of such an approach [234]. To paraphrase the words of Anacharsis (6th century BC) about friendship, “it is better to have one good peptide than many of worthless ones”. Furthermore, empirical evidence suggests that this statement is even more true in the case of very large datasets, where filtering the protein identifications using the simple “best peptide” approach is actually more efficient than using the combined peptide evidence approach.
In evaluating the performance of computational methods for computing posterior protein identification probabilities, one should consider two related but distinct metrics: discriminating power of the probability as a score for separating correct from incorrect protein identifications and the accuracy of the probabilities (i.e. whether they can be considered as true posterior probabilities or just as scores). The later question is important for estimating the FDR at the protein level. If the posterior protein identification probability is accurate, then FDR can be estimated without adding decoy protein sequences to the database via the sum of the posterior probabilities of all identifications passing the threshold [134] (as illustrated in Figure 8 in the case of PSMs). This has a number of advantages, especially in the case of small datasets where simple decoy count-based FDR estimates may not be reliable. For example, it is not possible to reliably estimate FDR based on decoy counts in the case of experiments profiling samples containing less than a few hundred proteins. In those cases where the computed score has no expectation of being a true posterior probability (as in the best peptide approach mentioned above), FDR can only be estimated with a help of decoy sequences analogous to the methods used at the PSM level [174, 182].
As in the case of PSM-level analysis, protein-level analysis may benefit from incorporation of various sources of auxiliary information or data generated in parallel experiments, e.g. predicted peptide detectability [223, 235] and external data such as transcriptomic data, interaction networks, and pathway information [236-238]. In the absence of well defined benchmark datasets, evaluating the accuracy of data analysis methods becomes difficult. Computed protein probabilities thus should be considered as just one source of information (the best of what one can do computationally), and protein identifications of biological importance but with borderline statistical confidence should be confirmed by independent technical and biological replication of the experiment, or using alternative strategies such targeted protein identification using SRM [239].
7.3 Protein inference and presentation of the results at the protein level
In the presence of shared peptides (i.e., peptides whose sequence is present in multiple entries in the protein sequence database), the task of computing protein confidence scores becomes more complicated. Even when using simple filtering approaches, a choice has to be made as to what degree one should utilize shared peptides. While considering only non-shared peptides is an overly conservative approach, treating shared and non-shared peptides equally erroneously inflates the number of reported proteins identifications.
The grouping of peptides to protein sequences can be done deterministically [182, 198, 240-242], or probabilistically, e.g. by apportioning peptides to proteins with some weights [50, 134, 155] or using graph-transforming algorithms [243]. An alternative approach [244] sidesteps the process of spectral identification, combines overlapping uninterpreted MS/MS spectra into longer chains, and maps these chains to protein sequences directly. With both approaches, combining peptides into proteins is often insufficient for unambiguous identification of the protein form due to a large number of shared peptides. This is particularly true in those cases where the protein sequence database contains many homologous proteins and splice isoforms (e.g. in the analysis of higher eukaryotes), or when the database intentionally includes sequences from multiple organisms [245].
In early studies, some groups were reporting all proteins identified with at least one non-shared peptide, whereas others reported everything or selected one representative protein among isoforms or homologs [12]. Many currently used tools present the results in a more transparent format by creating protein groups. This approach, and the nomenclature for describing various grouping scenarios, is partly based on the parsimony principle or the Occam's razor – “entities must not be multiplied beyond necessity” - which suggests that one should report the smallest number of proteins (protein groups) that can account for all observed peptides [50]. In this approach, protein database entries that are indistinguishable given the sequences of identified peptides are collapsed into a single protein group. Other scenarios include subset proteins, i.e. proteins that share all of its peptides with another protein that is identified by at least one non-shared peptide, and other more complicated cases [50]. Such a nomenclature provides a more consistent and concise format for representing the results of shotgun proteomic experiments (for a simple illustration see Figure 15).
Figure 15. Apportionment of shared peptides and creation of the protein-level summary list.

Peptides are apportioned among all their corresponding proteins, and a minimal list of proteins is derived that can explain all observed peptides. At the same time, peptide posterior probabilities are used to compute the protein probabilities. Proteins that are impossible to differentiate on the basis of identified peptides are presented as a group (G/E). It is not possible to conclude that protein B is present in the sample because it is identified by shared peptides only that can be explained by other proteins.
In certain cases, e.g. for comparison of proteomic and transcriptomic data, or to simplify the visualization of proteomic data in genomic context, it is advantageous to assemble and interpret the data using not a protein but a gene index as a reference. To achieve this, one can map peptides directly to the genome (or utilize protein-to-gene mappings already available for some protein sequence databases), and collapse the protein groups to keep unique gene accession numbers only. More elaborate gene model – protein sequence – protein accession relationships have also been suggested [246]. Interpretation of the results at the gene level has an additional benefit of providing more conservative protein lists by eliminating erroneous identifications of homologous proteins. One common example of this kind would be a minor isoform of a protein reported as unambiguously identified by a single non-shared peptide which is in fact a false identification, and where the true (highly homologous) peptide sequence belongs to another protein isoforms of the same gene.
8. Concluding remarks and outlook
Assessment of error rates in very large proteomic datasets remains an important issue. Given the fast pace of proteomic technology development, the definition of the term “large-scale” is frequently revised. What used to be a large dataset just a few years ago nowadays can be generated on a single instrument in a day. In addition to the dramatic increase in the speed of data acquisition, many datasets are now collected in multiple replicates. Many applications are concerned with generation of highly overlapping datasets, e.g. label-free quantitative analysis across multiple samples [247], or comprehensive characterization of the proteomes of model organisms such as Drosophila [248] or C. elegans [249]. This has a profound effect on many aspects of proteomic data analysis, most notably on protein-level filtering and error rate estimation. While the methods and approaches for global and local FDR estimation at the peptide level are now well understood, there has been much less development in the area of protein level analysis. While ProteinProphet [134] provides accurate probability estimates for data from typical shotgun proteomic experiments, our recent evaluation of its performance using large multi-replicate datasets indicated that the approach does not always scale well with the dataset size, in line with other recent reports [250]. More advanced, recently proposed methods cannot be easily implemented, whereas methods that are simple enough to implement perform poorly due oversimplifying assumptions (e.g. the Poisson model [12]). Thus, besides the simple target-decoy approach, the field is essentially lacking a robust and statistically powerful model with a practical software implementation for the analysis of very large proteomic datasets. Several efforts to address this problem are currently under way, including the development of a new computational tool iProphet (manuscript in preparation).
Searching genomic databases is becoming an increasingly popular approach, but should be practiced with great caution. Accurate translation of the DNA sequences into protein sequences is complicated due to frame-shifts, incorrectly predicted open reading frames, and other factors. Performing an accurate FDR assessment becomes difficult due to the need to distinguish between the identification of a potentially novel peptide and, e.g., a chemically modified version if a known, high abundance peptide (homologous to the novel sequence). Furthermore, the FDR estimation methods should take into account a much lower prior likelihood of observing a novel peptide compared to a known peptide (same statement applies to the problem of identifying rare PTMs). To our knowledge, FDR assessment in many published studies focusing on genomic database searching did not go beyond the standard procedures, and thus the true error rate for datasets reported in those studies may not be known. Significant concerns also remain regarding the application of multi-stage peptide and protein identification methods due to the violation of many common assumption about the rates of false identifications in those strategies [152, 251].
Global analysis of PTMs is one area of research that has become possible with recent improvements in MS instrumentation and biochemical methods. There is a tremendous interest in a variety of biologically significant PTMs, including phosphorylation (cell signaling), acetylation, and methylation (epigenetics) [3]. Yet PTM analysis presents many challenges [252, 253]. Using phosphorylation as an exemplary PTM, not only phosphorylated peptides are typically present in the cell at substoichiometric amounts, but their MS/MS fragmentation is often dominated by neutral losses of the phosphate group making the spectra uninformative [254-256]. As a result, sensitive identification of phosphopeptides requires application of complementary data acquisition techniques, e.g. MS3, multi-stage activation (MSA) [257-259], and/or electron transfer dissociation (ETD) [260]. While there has been significant progress in the development of the experimental platforms, computational algorithms for PTM analysis require substantial improvements. In particular, statistical validation of peptides with PTMs is of great concern. Another challenge is localizing the site of the PTM. The existing peptide identification tools were neither optimized for PTM site localization, nor do they provide any confidence score for the assigned site. While several site localization algorithms were previously described [261-263], they implement simplified approaches and have not been rigorously tested. As a result, phosphopeptide identifications often need to be manually verified – an obviously time consuming and subjective process. As well summarized in [256], “false-positive identifications are particularly dangerous for biologists interested in studying the function of these selected phosphorylation sites, as each phosphorylation site may take one to two years to fully investigate”. The problems related to PTM analysis are also acknowledged in the data publication guidelines from the journal Molecular and Cellular Proteomics [264].
It can be expected that improvement in tools and methods for shotgun proteomic data analysis will further increase the quality of published proteomic data. Still, such issues as the large dynamic range of protein abundances within the cell [265] and the limited ability to differentiate between protein isoforms cannot be easily overcome. Thus, it is possible that new significant advances will come from the development of alternative proteomic workflows. One possibility comes in the form of integration of shotgun and intact protein sequencing, which has a potential to provide improved resolution of populations of proteins into its components (including splice isoforms and post-translationally modified forms) [266-269]. Another promising alternative involves targeted analysis of specific peptides of high information content (proteotypic peptides) using SRM or related methods. These and other emerging strategies, however, present their own data analysis issues. Thus, there is every indication to expect that the field of computational proteomics in general, and the development of new algorithms and data analysis tools in particular, will remain an active area of research for years to come.
Acknowledgments
This work was supported in part by NIH/NCI Grant R01 CA126239.
Footnotes
Publisher's Disclaimer: This is a PDF file of an unedited manuscript that has been accepted for publication. As a service to our customers we are providing this early version of the manuscript. The manuscript will undergo copyediting, typesetting, and review of the resulting proof before it is published in its final citable form. Please note that during the production process errors may be discovered which could affect the content, and all legal disclaimers that apply to the journal pertain.
References
- 1.Aebersold R, Mann M. Mass spectrometry-based proteomics. Nature. 2003;422:198–207. doi: 10.1038/nature01511. [DOI] [PubMed] [Google Scholar]
- 2.Chen R, Snyder M. Yeast Proteomics and Protein Microarrays. Journal of Proteomics. doi: 10.1016/j.jprot.2010.08.003. In Press, Accepted Manuscript. [DOI] [PMC free article] [PubMed] [Google Scholar]
- 3.Witze ES, Old WM, Resing KA, Ahn NG. Mapping protein post-translational modifications with mass spectrometry. Nature Methods. 2007;4:798–806. doi: 10.1038/nmeth1100. [DOI] [PubMed] [Google Scholar]
- 4.Gstaiger M, Aebersold R. Applying mass spectrometry-based proteomics to genetics, genomics and network biology. Nature Reviews Genetics. 2009;10:617–27. doi: 10.1038/nrg2633. [DOI] [PubMed] [Google Scholar]
- 5.de Godoy LMF, Olsen JV, Cox J, Nielsen ML, Hubner NC, Frohlich F, et al. Comprehensive mass-spectrometry-based proteome quantification of haploid versus diploid yeast. Nature. 2008;455:1251–U60. doi: 10.1038/nature07341. [DOI] [PubMed] [Google Scholar]
- 6.Weston AD, Hood L. Systems biology, proteomics, and the future of health care: Toward predictive, preventative, and personalized medicine. Journal of Proteome Research. 2004;3:179–96. doi: 10.1021/pr0499693. [DOI] [PubMed] [Google Scholar]
- 7.Riffle M, Eng JK. Proteomics data repositories. Proteomics. 2009;9:4653–63. doi: 10.1002/pmic.200900216. [DOI] [PMC free article] [PubMed] [Google Scholar]
- 8.Nesvizhskii AI, Aebersold R. Analysis, statistical validation and dissemination of large-scale proteomics datasets generated by tandem MS. Drug Discovery Today. 2004;9:173–81. doi: 10.1016/S1359-6446(03)02978-7. [DOI] [PubMed] [Google Scholar]
- 9.Russell SA, Old W, Resing KA, Hunter L. Proteomic Informatics. Int Rev Neurobiol. 2004;61:129–57. doi: 10.1016/S0074-7742(04)61006-3. [DOI] [PubMed] [Google Scholar]
- 10.Baldwin MA. Protein identification by mass spectrometry - Issues to be considered. Molecular & Cellular Proteomics. 2004;3:1–9. doi: 10.1074/mcp.R300012-MCP200. [DOI] [PubMed] [Google Scholar]
- 11.Xie H, Griffin TJ. Trade-Off between High Sensitivity and Increased Potential for False Positive Peptide Sequence Matches Using a Two-Dimensional Linear Ion Trap for Tandem Mass Spectrometry-Based Proteomics. J Proteome Res. 2006;5:1093–9. doi: 10.1021/pr050472i. [DOI] [PubMed] [Google Scholar]
- 12.States DJ, Omenn GS, Blackwell TW, Fermin D, Eng J, Speicher DW, et al. Challenges in deriving high-confidence protein identifications from data gathered by a HUPO plasma proteome collaborative study. Nature Biotechnology. 2006;24:333–8. doi: 10.1038/nbt1183. [DOI] [PubMed] [Google Scholar]
- 13.Boguski MS, McIntosh MW. Biomedical informatics for proteomics. Nature. 2003;422:233–7. doi: 10.1038/nature01515. [DOI] [PubMed] [Google Scholar]
- 14.Patterson SD. Data analysis - the Achilles heel of proteomics. Nature Biotechnology. 2003;21:221–2. doi: 10.1038/nbt0303-221. [DOI] [PubMed] [Google Scholar]
- 15.Carr S, Aebersold R, Baldwin M, Burlingame A, Clauser K, Nesvizhskii A. The Need for Guidelines in Publication of Peptide and Protein Identification Data: Working Group On Publication Guidelines For Peptide And Protein Identification Data. Mol Cell Proteomics. 2004;3:531–3. doi: 10.1074/mcp.T400006-MCP200. [DOI] [PubMed] [Google Scholar]
- 16.Steen H, Mann M. The ABC's (and XYZ's) of peptide sequencing. Nat Rev Mol Cell Biol. 2004;5:699–711. doi: 10.1038/nrm1468. [DOI] [PubMed] [Google Scholar]
- 17.Marcotte EM. How do shotgun proteomics algorithms identify proteins? Nature Biotechnology. 2007;25:755–7. doi: 10.1038/nbt0707-755. [DOI] [PubMed] [Google Scholar]
- 18.Yates JR, Ruse CI, Nakorchevsky A. Proteomics by Mass Spectrometry: Approaches, Advances, and Applications. Annu Rev Biomed Eng. 2009;11:49–79. doi: 10.1146/annurev-bioeng-061008-124934. [DOI] [PubMed] [Google Scholar]
- 19.Leitner A, Lindner W. Chemistry meets proteomics: The use of chemical tagging reactions for MS-based proteomics. Proteomics. 2006;6:5418–34. doi: 10.1002/pmic.200600255. [DOI] [PubMed] [Google Scholar]
- 20.Bantscheff M, Schirle M, Sweetman G, Rick J, Kuster B. Quantitative mass spectrometry in proteomics: a critical review. Analytical and Bioanalytical Chemistry. 2007;389:1017–31. doi: 10.1007/s00216-007-1486-6. [DOI] [PubMed] [Google Scholar]
- 21.Nesvizhskii AI. Protein identification by tandem mass spectrometry and sequence database searching. Methods Mol Biol. 2007;367:87–119. doi: 10.1385/1-59745-275-0:87. [DOI] [PubMed] [Google Scholar]
- 22.Kapp EA, Schutz F, Connolly LM, Chakel JA, Meza JE, Miller CA, et al. An evaluation, comparison, and accurate benchmarking of several publicly available MS/MS search algorithms: Sensitivity and specificity analysis. Proteomics. 2005;5:3475–90. doi: 10.1002/pmic.200500126. [DOI] [PubMed] [Google Scholar]
- 23.Elias JE, Haas W, Faherty BK, Gygi SP. Comparative evaluation of mass spectrometry platforms used in large-scale proteomics investigations. Nature Methods. 2005;2:667–75. doi: 10.1038/nmeth785. [DOI] [PubMed] [Google Scholar]
- 24.Kandasamy K, Pandey A, Molina H. Evaluation of Several MS/MS Search Algorithms for Analysis of Spectra Derived from Electron Transfer Dissociation Experiments. Analytical Chemistry. 2009;81:7170–80. doi: 10.1021/ac9006107. [DOI] [PubMed] [Google Scholar]
- 25.Keller A, Nesvizhskii AI, Kolker E, Aebersold R. Empirical statistical model to estimate the accuracy of peptide identifications made by MS/MS and database search. Analytical Chemistry. 2002;74:5383–92. doi: 10.1021/ac025747h. [DOI] [PubMed] [Google Scholar]
- 26.Lopez-Ferrer D, Martinez-Bartolome S, Villar M, Campillos M, Martin-Maroto F, Vazquez J. Statistical model for large-scale peptide identification in databases from tandem mass spectra using SEQUEST. Analytical Chemistry. 2004;76:6853–60. doi: 10.1021/ac049305c. [DOI] [PubMed] [Google Scholar]
- 27.Anderson DC, Li WQ, Payan DG, Noble WS. A new algorithm for the evaluation of shotgun peptide sequencing in proteomics: Support vector machine classification of peptide MS/MS spectra and SEQUEST scores. Journal of Proteome Research. 2003;2:137–46. doi: 10.1021/pr0255654. [DOI] [PubMed] [Google Scholar]
- 28.Kislinger T, Rahman K, Radulovic D, Cox B, Rossant J, Emili A. PRISM, a generic large scale proteomic investigation strategy for mammals. Molecular & Cellular Proteomics. 2003;2:96–106. doi: 10.1074/mcp.M200074-MCP200. [DOI] [PubMed] [Google Scholar]
- 29.Ulintz PJ, Zhu J, Qin ZHS, Andrews PC. Improved classification of mass spectrometry database search results using newer machine learning approaches. Molecular & Cellular Proteomics. 2006;5:497–509. doi: 10.1074/mcp.M500233-MCP200. [DOI] [PubMed] [Google Scholar]
- 30.Sadygov RG, Good DM, Swaney DL, Coon JJ. A New Probabilistic Database Search Algorithm for ETD Spectra. Journal of Proteome Research. 2009;8:3198–205. doi: 10.1021/pr900153b. [DOI] [PMC free article] [PubMed] [Google Scholar]
- 31.Payne SH, Yau M, Smolka MB, Tanner S, Zhou HL, Bafna V. Phosphorylation-specific MS/MS scoring for rapid and accurate phosphoproteome analysis. Journal of Proteome Research. 2008;7:3373–81. doi: 10.1021/pr800129m. [DOI] [PMC free article] [PubMed] [Google Scholar]
- 32.Baker PR, Medzihradszky KF, Chalkley RJ. Improving software performance for peptide ETD data analysis by implementation of charge-state and sequence-dependent scoring. Molecular & Cellular Proteomics. 2010 doi: 10.1074/mcp.M110.000422. In press. [DOI] [PMC free article] [PubMed] [Google Scholar]
- 33.Elias JE, Gibbons FD, King OD, Roth FP, Gygi SP. Intensity-based protein identification by machine learning from a library of tandem mass spectra. Nature Biotechnology. 2004;22:214–9. doi: 10.1038/nbt930. [DOI] [PubMed] [Google Scholar]
- 34.Havilio M, Haddad Y, Smilansky Z. Intensity-based statistical scorer for tandem mass spectrometry. Analytical Chemistry. 2003;75:435–44. doi: 10.1021/ac0258913. [DOI] [PubMed] [Google Scholar]
- 35.Zhou C, Bowler LD, Feng JF. A machine learning approach to explore the spectra intensity pattern of peptides using tandem mass spectrometry data. Bmc Bioinformatics. 2008;9:325. doi: 10.1186/1471-2105-9-325. [DOI] [PMC free article] [PubMed] [Google Scholar]
- 36.Frank AM. A Ranking-Based Scoring Function for Peptide-Spectrum Matches. Journal of Proteome Research. 2009;8:2241–52. doi: 10.1021/pr800678b. [DOI] [PMC free article] [PubMed] [Google Scholar]
- 37.Frank AM. Predicting Intensity Ranks of Peptide Fragment Ions. Journal of Proteome Research. 2009;8:2226–40. doi: 10.1021/pr800677f. [DOI] [PMC free article] [PubMed] [Google Scholar]
- 38.Klammer AA, Reynolds SM, Bilmes JA, MacCoss MJ, Noble WS. Modeling peptide fragmentation with dynamic Bayesian networks for peptide identification. Bioinformatics. 2008;24:I348–I56. doi: 10.1093/bioinformatics/btn189. [DOI] [PMC free article] [PubMed] [Google Scholar]
- 39.Sun SJ, Meyer-Arendt K, Eichelberger B, Brown R, Yen CY, Old WM, et al. Improved validation of peptide MS/MS assignments using spectral intensity prediction. Molecular & Cellular Proteomics. 2007;6:1–17. doi: 10.1074/mcp.M600320-MCP200. [DOI] [PubMed] [Google Scholar]
- 40.Zhang ZQ. Prediction of Electron-Transfer/Capture Dissociation Spectra of Peptides. Analytical Chemistry. 2010;82:1990–2005. doi: 10.1021/ac902733z. [DOI] [PubMed] [Google Scholar]
- 41.Li GZ, Vissers JPC, Silva JC, Golick D, Gorenstein MV, Geromanos SJ. Database searching and accounting of multiplexed precursor and product ion spectra from the data independent analysis of simple and complex peptide mixtures. Proteomics. 2009;9:1696–719. doi: 10.1002/pmic.200800564. [DOI] [PubMed] [Google Scholar]
- 42.Li Y, Chi H, Wang LH, Wang HP, Fu Y, Yuan ZF, et al. Speeding up tandem mass spectrometry based database searching by peptide and spectrum indexing. Rapid Communications in Mass Spectrometry. 2010;24:807–14. doi: 10.1002/rcm.4448. [DOI] [PubMed] [Google Scholar]
- 43.Park CY, Klammer AA, Kall L, MacCoss MJ, Noble WS. Rapid and accurate peptide identification from tandem mass spectra. Journal of Proteome Research. 2008;7:3022–7. doi: 10.1021/pr800127y. [DOI] [PMC free article] [PubMed] [Google Scholar]
- 44.Li DQ, Gao W, Ling CX, Wang XB, Sun RX, He SM. IndexToolkit: an open source toolbox to index protein databases for high-throughput proteomics. Bioinformatics. 2006;22:2572–3. doi: 10.1093/bioinformatics/btl410. [DOI] [PubMed] [Google Scholar]
- 45.Ramakrishnan SR, Mao R, Nakorchevskiy AA, Prince JT, Willard WS, Xu WJ, et al. A fast coarse filtering method for peptide identification by mass spectrometry. Bioinformatics. 2006;22:1524–31. doi: 10.1093/bioinformatics/btl118. [DOI] [PubMed] [Google Scholar]
- 46.Roos FF, Jacob R, Grossmann J, Fischer B, Buhmann JM, Gruissem W, et al. PepSplice: cache-efficient search algorithms for comprehensive identification of tandem mass spectra. Bioinformatics. 2007;23:3016–23. doi: 10.1093/bioinformatics/btm417. [DOI] [PubMed] [Google Scholar]
- 47.Dutta D, Chen T. Speeding up tandem mass spectrometry database search: metric embeddings and fast near neighbor search. Bioinformatics. 2007;23:612–8. doi: 10.1093/bioinformatics/btl645. [DOI] [PubMed] [Google Scholar]
- 48.Quandt A, Masselot A, Hernandez P, Hernandez C, Maffioletti S, Appel RD, et al. SwissPIT: An workflow-based platform for analyzing tandem-MS spectra using the Grid. Proteomics. 2009;9:2648–55. doi: 10.1002/pmic.200800207. [DOI] [PubMed] [Google Scholar]
- 49.Halligan BD, Geiger JF, Vallejos AK, Greene AS, Twigger SN. Low Cost, Scalable Proteomics Data Analysis Using Amazon's Cloud Computing Services and Open Source Search Algorithms. Journal of Proteome Research. 2009;8:3148–53. doi: 10.1021/pr800970z. [DOI] [PMC free article] [PubMed] [Google Scholar]
- 50.Nesvizhskii AI, Aebersold R. Interpretation of shotgun proteomic data - The protein inference problem. Molecular & Cellular Proteomics. 2005;4:1419–40. doi: 10.1074/mcp.R500012-MCP200. [DOI] [PubMed] [Google Scholar]
- 51.Nesvizhskii AI, Roos FF, Grossmann J, Vogelzang M, Eddes JS, Gruissem W, et al. Dynamic Spectrum Quality Assessment and Iterative Computational Analysis of Shotgun Proteomic Data: Toward More Efficient Identification of Post-translational Modifications, Sequence Polymorphisms, and Novel Peptides. Mol Cell Proteomics. 2006;5:652–70. doi: 10.1074/mcp.M500319-MCP200. [DOI] [PubMed] [Google Scholar]
- 52.Choudhary JS, Blackstock WP, Creasy DM, Cottrell JS. Interrogating the human genome using uninterpreted mass spectrometry data. Proteomics. 2001;1:651–67. doi: 10.1002/1615-9861(200104)1:5<651::AID-PROT651>3.0.CO;2-N. [DOI] [PubMed] [Google Scholar]
- 53.Colinge J, Cusin I, Reffas S, Mahe E, Niknejad A, Rey PA, et al. Experiments in Searching Small Proteins in Unannotated Large Eukaryotic Genomes. J Proteome Res. 2005;4:167–74. doi: 10.1021/pr049811i. [DOI] [PubMed] [Google Scholar]
- 54.Edwards NJ. Novel peptide identification from tandem mass spectra using ESTs and sequence database compression. Molecular Systems Biology. 2007;3:102. doi: 10.1038/msb4100142. [DOI] [PMC free article] [PubMed] [Google Scholar]
- 55.Desiere F, Deutsch EW, Nesvizhskii AI, Mallick P, King NL, Eng JK, et al. Integration with the human genome of peptide sequences obtained by high-throughput mass spectrometry. Genome Biology. 2005;6:R9. doi: 10.1186/gb-2004-6-1-r9. [DOI] [PMC free article] [PubMed] [Google Scholar]
- 56.Bitton DA, Smith DL, Connolly Y, Scutt PJ, Miller CJ. An Integrated Mass-Spectrometry Pipeline Identifies Novel Protein Coding-Regions in the Human Genome. Plos One. 2010;5:e8949. doi: 10.1371/journal.pone.0008949. [DOI] [PMC free article] [PubMed] [Google Scholar]
- 57.Chang KY, Georgianna DR, Heber S, Payne GA, Muddiman DC. Detection of Alternative Splice Variants at the Proteome Level in Aspergillus flavus. Journal of Proteome Research. 2010;9:1209–17. doi: 10.1021/pr900602d. [DOI] [PubMed] [Google Scholar]
- 58.Findlay GD, MacCoss MJ, Swanson WJ. Proteomic discovery of previously unannotated, rapidly evolving seminal fluid genes in Drosophila. Genome Research. 2009;19:886–96. doi: 10.1101/gr.089391.108. [DOI] [PMC free article] [PubMed] [Google Scholar]
- 59.Loevenich SN, Brunner E, King NL, Deutsch EW, Stein SE, Aebersold R, et al. The Drosophila melanogaster PeptideAtlas facilitates the use of peptide data for improved fly proteomics and genome annotation. Bmc Bioinformatics. 2009;10:59. doi: 10.1186/1471-2105-10-59. [DOI] [PMC free article] [PubMed] [Google Scholar]
- 60.Merrihew GE, Davis C, Ewing B, Williams G, Kall L, Frewen BE, et al. Use of shotgun proteomics for the identification, confirmation, and correction of C. elegans gene annotations. Genome Research. 2008;18:1660–9. doi: 10.1101/gr.077644.108. [DOI] [PMC free article] [PubMed] [Google Scholar]
- 61.Tress ML, Bodenmiller B, Aebersold R, Valencia A. Proteomics studies confirm the presence of alternative protein isoforms on a large scale. Genome Biology. 2008;9:R162. doi: 10.1186/gb-2008-9-11-r162. [DOI] [PMC free article] [PubMed] [Google Scholar]
- 62.Wright JC, Sugden D, Francis-McIntyre S, Riba-Garcia I, Gaskell SJ, Grigoriev IV, et al. Exploiting proteomic data for genome annotation and gene model validation in Aspergillus niger. Bmc Genomics. 2009;10:61. doi: 10.1186/1471-2164-10-61. [DOI] [PMC free article] [PubMed] [Google Scholar]
- 63.Fermin D, Allen BB, Blackwell TW, Menon R, Adamski M, Xu Y, et al. Novel gene and gene model detection using a whole genome open reading frame analysis in proteomics. Genome Biology. 2006;7:R35. doi: 10.1186/gb-2006-7-4-r35. [DOI] [PMC free article] [PubMed] [Google Scholar]
- 64.Kalume D, Peri S, Reddy R, Zhong J, Okulate M, Kumar N, et al. Genome annotation of Anopheles gambiae using mass spectrometry-derived data. BMC Genomics. 2005;6:128. doi: 10.1186/1471-2164-6-128. [DOI] [PMC free article] [PubMed] [Google Scholar]
- 65.Tanner S, Shen ZX, Ng J, Florea L, Guigo R, Briggs SP, et al. Improving gene annotation using peptide mass spectrometry. Genome Research. 2007;17:231–9. doi: 10.1101/gr.5646507. [DOI] [PMC free article] [PubMed] [Google Scholar]
- 66.Gentzel M, Kocher T, Ponnusamy S, Wilm M. Preprocessing of tandem mass spectrometric data to support automatic protein identification. Proteomics. 2003;3:1597–610. doi: 10.1002/pmic.200300486. [DOI] [PubMed] [Google Scholar]
- 67.Mujezinovic N, Raidl G, Hutchins JRA, Peters JM, Mechtler K, Eisenhaber F. Cleaning of raw peptide MS/MS spectra: Improved protein identification following deconvolution of multiply charged peaks, isotope clusters, and removal of background noise. Proteomics. 2006;6:5117–31. doi: 10.1002/pmic.200500928. [DOI] [PubMed] [Google Scholar]
- 68.Good DM, Wenger CD, McAlister GC, Bai DL, Hunt DF, Coon JJ. Post-Acquisition ETD Spectral Processing for Increased Peptide Identifications. Journal of the American Society for Mass Spectrometry. 2009;20:1435–40. doi: 10.1016/j.jasms.2009.03.006. [DOI] [PMC free article] [PubMed] [Google Scholar]
- 69.Beer I, Barnea E, Ziv T, Admon A. Improving large-scale proteomics by clustering of mass spectrometry data. Proteomics. 2004;4:950–60. doi: 10.1002/pmic.200300652. [DOI] [PubMed] [Google Scholar]
- 70.Tabb DL, Thompson MR, Khalsa-Moyers G, VerBerkmoes NC, McDonald WH. MS2Grouper: Group assessment and synthetic replacement of duplicate proteomic tandem mass spectra. Journal of the American Society for Mass Spectrometry. 2005;16:1250–61. doi: 10.1016/j.jasms.2005.04.010. [DOI] [PubMed] [Google Scholar]
- 71.Houel S, Abernathy R, Renganathan K, Meyer-Arendt K, Ahn N, Old WM. Quantifying the impact of chimera MS/MS spectra on peptide identification in large scale proteomics studies. Journal of Proteome Research. 2010 doi: 10.1021/pr1003856. in press. [DOI] [PMC free article] [PubMed] [Google Scholar]
- 72.Alves G, Ogurtsov AY, Kwok S, Wu WW, Wang GH, Shen RF, et al. Detection of co-eluted peptides using database search methods. Biology Direct. 2008;3:1–16. doi: 10.1186/1745-6150-3-27. [DOI] [PMC free article] [PubMed] [Google Scholar]
- 73.Bern M, Finney G, Hoopmann MR, Merrihew G, Toth MJ, MacCoss MJ. Deconvolution of Mixture Spectra from Ion-Trap Data-Independent-Acquisition Tandem Mass Spectrometry. Analytical Chemistry. 2010;82:833–41. doi: 10.1021/ac901801b. [DOI] [PMC free article] [PubMed] [Google Scholar]
- 74.Zhang N, Li XJ, Ye ML, Pan S, Schwikowski B, Aebersold R. ProblDtree: An automated software program capable of identifying multiple peptides from a single collision-induced dissociation spectrum collected by a tandem mass spectrometer. Proteomics. 2005;5:4096–106. doi: 10.1002/pmic.200401260. [DOI] [PubMed] [Google Scholar]
- 75.Wang J, Perez-Santiago J, Katz JE, Mallick P, Bandeira N. Peptide identification from mixture tandem mass spectra. Molecular & Cellular Proteomics. 2010 doi: 10.1074/mcp.M000136-MCP201. in press. [DOI] [PMC free article] [PubMed] [Google Scholar]
- 76.Moore RE, Young MK, Lee TD. Method for screening peptide fragment ion mass spectra prior to database searching. Journal of the American Society for Mass Spectrometry. 2000;11:422–6. doi: 10.1016/S1044-0305(00)00097-0. [DOI] [PubMed] [Google Scholar]
- 77.Wong JWH, Sullivan MJ, Cartwright HM, Cagney G. msmsEval: tandem mass spectral quality assignment for high-throughput proteomics. Bmc Bioinformatics. 2007;8 doi: 10.1186/1471-2105-8-51. [DOI] [PMC free article] [PubMed] [Google Scholar]
- 78.Flikka K, Martens L, Vandekerckhoe J, Gevaert K, Eidhammer I. Improving the reliability and throughput of mass spectrometry-based proteomics by spectrum quality filtering. Proteomics. 2006;6:2086–94. doi: 10.1002/pmic.200500309. [DOI] [PubMed] [Google Scholar]
- 79.Xu M, Geer LY, Bryant SH, Roth JS, Kowalak JA, Maynard DM, et al. Assessing data quality of peptide mass spectra obtained by quadrupole ion trap mass spectrometry. Journal of Proteome Research. 2005;4:300–5. doi: 10.1021/pr049844y. [DOI] [PubMed] [Google Scholar]
- 80.Junqueira M, Spirin V, Balbuena TS, Waridel P, Surendranath V, Kryukov G, et al. Separating the wheat from the chaff: unbiased filtering of background tandem mass spectra improves protein identification. Journal of Proteome Research. 2008;7:3382–95. doi: 10.1021/pr800140v. [DOI] [PMC free article] [PubMed] [Google Scholar]
- 81.Koenig T, Menze BH, Kirchner M, Monigatti F, Parker KC, Patterson T, et al. Robust prediction of the MASCOT score for an improved quality assessment in mass spectrometric proteomics. Journal of Proteome Research. 2008;7:3708–17. doi: 10.1021/pr700859x. [DOI] [PubMed] [Google Scholar]
- 82.Na S, Paek E, Lee C. CIFTER: Automated charge-state determination for peptide tandem mass spectra. Analytical Chemistry. 2008;80:1520–8. doi: 10.1021/ac702038q. [DOI] [PubMed] [Google Scholar]
- 83.Colinge J, Magnin J, Dessingy T, Giron M, Masselot A. Improved peptide charge state assignment. Proteomics. 2003;3:1434–40. doi: 10.1002/pmic.200300489. [DOI] [PubMed] [Google Scholar]
- 84.Tabb DL, Shah MB, Strader MB, Connelly HM, Hettich RL, Hurst GB. Determination of peptide and protein ion charge states by Fourier transformation of isotope-resolved mass spectra. Journal of the American Society for Mass Spectrometry. 2006;17:903–15. doi: 10.1016/j.jasms.2006.02.003. [DOI] [PubMed] [Google Scholar]
- 85.Sadygov RG, Hao Z, Huhmer AFR. Charger: Combination of signal processing and statistical learning algorithms for precursor charge-state determination from electron-transfer dissociation spectra. Analytical Chemistry. 2008;80:376–86. doi: 10.1021/ac071332q. [DOI] [PubMed] [Google Scholar]
- 86.Luethy R, Kessner DE, Katz JE, McLean B, Grothe R, Kani K, et al. Precursor-ion mass re-estimation improves peptide identification on hybrid instruments. Journal of Proteome Research. 2008;7:4031–9. doi: 10.1021/pr800307m. [DOI] [PMC free article] [PubMed] [Google Scholar]
- 87.Mayampurath AM, Jaitly N, Purvine SO, Monroe ME, Auberry KJ, Adkins JN, et al. DeconMSn: a software tool for accurate parent ion monoisotopic mass determination for tandem mass spectra. Bioinformatics. 2008;24:1021–3. doi: 10.1093/bioinformatics/btn063. [DOI] [PMC free article] [PubMed] [Google Scholar]
- 88.Shinkawa T, Nagano K, Inomata N, Haramura M. A software program for more reliable precursor ion assignation from LC-MS analysis using LTQ ultra zoom scan. Journal of Proteomics. 2009;73:357–60. doi: 10.1016/j.jprot.2009.08.009. [DOI] [PubMed] [Google Scholar]
- 89.Yates JR, Morgan SF, Gatlin CL, Griffin PR, Eng JK. Method to compare collision-induced dissociation spectra of peptides: Potential for library searching and subtractive analysis. Analytical Chemistry. 1998;70:3557–65. doi: 10.1021/ac980122y. [DOI] [PubMed] [Google Scholar]
- 90.Craig R, Cortens JC, Fenyo D, Beavis RC. Using annotated peptide mass spectrum libraries for protein identification. Journal of Proteome Research. 2006;5:1843–9. doi: 10.1021/pr0602085. [DOI] [PubMed] [Google Scholar]
- 91.Frewen BE, Merrihew GE, Wu CC, Noble WS, MacCoss MJ. Analysis of peptide MS/MS spectra from large-scale proteomics experiments using spectrum libraries. Analytical Chemistry. 2006;78:5678–84. doi: 10.1021/ac060279n. [DOI] [PubMed] [Google Scholar]
- 92.Lam H, Deutsch EW, Eddes JS, Eng JK, King N, Stein SE, et al. Development and validation of a spectral library searching method for peptide identification from MS/MS. Proteomics. 2007;7:655–67. doi: 10.1002/pmic.200600625. [DOI] [PubMed] [Google Scholar]
- 93.Stein SE, Scott DR. Optimization and Testing of Mass-Spectral Library Search Algorithms for Compound Identification. Journal of the American Society for Mass Spectrometry. 1994;5:859–66. doi: 10.1016/1044-0305(94)87009-8. [DOI] [PubMed] [Google Scholar]
- 94.Lam H, Deutsch EW, Eddes JS, Eng JK, Stein SE, Aebersold R. Building consensus spectral libraries for peptide identification in proteomics. Nat Meth. 2008;5:873–5. doi: 10.1038/nmeth.1254. [DOI] [PMC free article] [PubMed] [Google Scholar]
- 95.Srikumar T, Jeram SM, Lam H, Raught B. A ubiquitin and ubiquitin-like protein spectral library. Proteomics. 2010;10:337–42. doi: 10.1002/pmic.200900627. [DOI] [PubMed] [Google Scholar]
- 96.Bodenmiller B, Campbell D, Gerrits B, Lam H, Jovanovic M, Picotti P, et al. PhosphoPep-a database of protein phosphorylation sites in model organisms. Nature Biotechnology. 2008;26:1339–40. doi: 10.1038/nbt1208-1339. [DOI] [PMC free article] [PubMed] [Google Scholar]
- 97.King NL, Deutsch EW, Ranish JA, Nesvizhskii AI, Eddes JS, Mallick P, et al. Analysis of the Saccharomyces cerevisiae proteome with PeptideAtlas. Genome Biology. 2006;7:R106. doi: 10.1186/gb-2006-7-11-r106. [DOI] [PMC free article] [PubMed] [Google Scholar]
- 98.Brunner E, Ahrens CH, Mohanty S, Baetschmann H, Loevenich S, Potthast F, et al. A high-quality catalog of the Drosophila melanogaster proteome. 2007;25:576–83. doi: 10.1038/nbt1300. [DOI] [PubMed] [Google Scholar]
- 99.Yen CY, Meyer-Arendt K, Eichelberger B, Sun SJ, Houel S, Old WM, et al. A Simulated MS/MS Library for Spectrum-to-spectrum Searching in Large Scale Identification of Proteins. Molecular & Cellular Proteomics. 2009;8:857–69. doi: 10.1074/mcp.M800384-MCP200. [DOI] [PMC free article] [PubMed] [Google Scholar]
- 100.Ye D, Fu Y, Sun RX, Wang HP, Yuan ZF, Chi H, et al. Open MS/MS spectral library search to identify unanticipated post-translational modifications and increase spectral identification rate. Bioinformatics. 2010;26:i399–i406. doi: 10.1093/bioinformatics/btq185. [DOI] [PMC free article] [PubMed] [Google Scholar]
- 101.Vizcaíno JA, Foster JM, Martens L. Proteomics data repositories: Providing a safe haven for your data and acting as a springboard for further research. Journal of Proteomics. 2010 doi: 10.1016/j.jprot.2010.06.008. In Press, Corrected Proof. [DOI] [PMC free article] [PubMed] [Google Scholar]
- 102.Deutsch EW, Lam H, Aebersold R. PeptideAtlas: a resource for target selection for emerging targeted proteomics workflows. Embo Reports. 2008;9:429–34. doi: 10.1038/embor.2008.56. [DOI] [PMC free article] [PubMed] [Google Scholar]
- 103.Seidler J, Zinn N, Boehm ME, Lehmann WD. De novo sequencing of peptides by MS/MS. Proteomics. 2010;10:634–49. doi: 10.1002/pmic.200900459. [DOI] [PubMed] [Google Scholar]
- 104.Liska AJ, Shevchenko A. Expanding the organismal scope of proteomics: Cross-species protein identification by mass spectrometry and its implications. Proteomics. 2003;3:19–28. doi: 10.1002/pmic.200390004. [DOI] [PubMed] [Google Scholar]
- 105.Grossmann J, Fischer B, Baerenfaller K, Owiti J, Buhmann JM, Gruissem W, et al. A workflow to increase the detection rate of proteins from unsequenced organisms in high-throughput proteomics experiments. Proteomics. 2007;7:4245–54. doi: 10.1002/pmic.200700474. [DOI] [PubMed] [Google Scholar]
- 106.Junqueira M, Spirin V, Balbuena TS, Thomas H, Adzhubei I, Sunyaev S, et al. Protein identification pipeline for the homology-driven proteomics. Journal of Proteomics. 2008;71:346–56. doi: 10.1016/j.jprot.2008.07.003. [DOI] [PMC free article] [PubMed] [Google Scholar]
- 107.Tessier D, Yclon P, Jacquemin I, Larre C, Rogniaux H. OVNIp: An open source application facilitating the interpretation, the validation and the edition of proteomics data generated by MS analyses and de novo sequencing. Proteomics. 2010;10:1794–801. doi: 10.1002/pmic.200800783. [DOI] [PubMed] [Google Scholar]
- 108.Thomas H, Shevchenko A. Simplified validation of borderline hits of database searches. Proteomics. 2008;8:4173–7. doi: 10.1002/pmic.200800250. [DOI] [PMC free article] [PubMed] [Google Scholar]
- 109.Frank AM, Savitski MM, Nielsen ML, Zubarev RA, Pevzner PA. De novo peptide sequencing and identification with precision mass spectrometry. Journal of Proteome Research. 2007;6:114–23. doi: 10.1021/pr060271u. [DOI] [PMC free article] [PubMed] [Google Scholar]
- 110.Pan C, Park BH, McDonald WH, Carey PA, Banfield JF, VerBerkmoes NC, et al. A high-throughput de novo sequencing approach for shotgun proteomics using high-resolution tandem mass spectrometry. Bmc Bioinformatics. 2010;11:18. doi: 10.1186/1471-2105-11-118. [DOI] [PMC free article] [PubMed] [Google Scholar]
- 111.Chi H, Sun RX, Yang B, Song CQ, Wang LH, Liu C, et al. pNovo: De novo Peptide Sequencing and Identification Using HCD Spectra. Journal of Proteome Research. 2010;9:2713–24. doi: 10.1021/pr100182k. [DOI] [PubMed] [Google Scholar]
- 112.van Breukelen B, Georgiou A, Drugan MM, Taouatas N, Mohammed S, Heck AJR. LysNDeNovo: An algorithm enabling de novo sequencing of Lys-N generated peptides fragmented by electron transfer dissociation. Proteomics. 2010;10:1196–201. doi: 10.1002/pmic.200900405. [DOI] [PubMed] [Google Scholar]
- 113.Datta R, Bern M. Spectrum Fusion: Using Multiple Mass Spectra for De Novo Peptide Sequencing. Journal of Computational Biology. 2009;16:1169–82. doi: 10.1089/cmb.2009.0122. [DOI] [PubMed] [Google Scholar]
- 114.Bertsch A, Leinenbach A, Pervukhin A, Lubeck M, Hartmer R, Baessmann C, et al. De novo peptide sequencing by tandem MS using complementary CID and electron transfer dissociation. Electrophoresis. 2009;30:3736–47. doi: 10.1002/elps.200900332. [DOI] [PubMed] [Google Scholar]
- 115.Mann M, Wilm M. Error Tolerant Identification of Peptides in Sequence Databases by Peptide Sequence Tags. Analytical Chemistry. 1994;66:4390–9. doi: 10.1021/ac00096a002. [DOI] [PubMed] [Google Scholar]
- 116.Han Y, Ma B, Zhang K. SPIDER: software for protein identification from sequence tags with de novo sequencing error. J Bioinform Comput Biol. 2005;3:697–716. doi: 10.1142/s0219720005001247. [DOI] [PubMed] [Google Scholar]
- 117.Searle BC, Dasari S, Wilmarth PA, Turner M, Reddy AP, David LL, et al. Identification of Protein Modifications Using MS/MS de Novo Sequencing and the OpenSea Alignment Algorithm. J Proteome Res. 2005;4:546–54. doi: 10.1021/pr049781j. [DOI] [PubMed] [Google Scholar]
- 118.Sunyaev S, Liska AJ, Golod A, Shevchenko A, Shevchenko A. MultiTag: Multiple Error-Tolerant Sequence Tag Search for the Sequence-Similarity Identification of Proteins by Mass Spectrometry. Anal Chem. 2003;75:1307–15. doi: 10.1021/ac026199a. [DOI] [PubMed] [Google Scholar]
- 119.Tabb DL, Saraf A, Yates JR. GutenTag: High-Throughput Sequence Tagging via an Empirically Derived Fragmentation Model. Anal Chem. 2003;75:6415–21. doi: 10.1021/ac0347462. [DOI] [PMC free article] [PubMed] [Google Scholar]
- 120.Tanner S, Shu H, Frank A, Wang LC, Zandi E, Mumby M, et al. InsPecT: Identification of Posttranslationally Modified Peptides from Tandem Mass Spectra. Anal Chem. 2005;77:4626–39. doi: 10.1021/ac050102d. [DOI] [PubMed] [Google Scholar]
- 121.Savitski MM, Nielsen ML, Zubarev RA. New data base-independent, sequence tag-based scoring of peptide MS/MS data validates Mowse scores, recovers below threshold data, singles out modified peptides, and assesses the quality of MS/MS techniques. Molecular & Cellular Proteomics. 2005;4:1180–8. doi: 10.1074/mcp.T500009-MCP200. [DOI] [PubMed] [Google Scholar]
- 122.Shilov IV, Seymour SL, Patel AA, Loboda A, Tang WH, Keating SP, et al. The paragon algorithm, a next generation search engine that uses sequence temperature values and feature probabilities to identify peptides from tandem mass spectra. Molecular & Cellular Proteomics. 2007;6:1638–55. doi: 10.1074/mcp.T600050-MCP200. [DOI] [PubMed] [Google Scholar]
- 123.Dasari S, Chambers MC, Slebos RJ, Zimmerman LJ, Ham AJL, Tabb DL. TagRecon: High-Throughput Mutation Identification through Sequence Tagging. Journal of Proteome Research. 2010;9:1716–26. doi: 10.1021/pr900850m. [DOI] [PMC free article] [PubMed] [Google Scholar]
- 124.Frank A, Tanner S, Bafna V, Pevzner P. Peptide sequence tags for fast database search in mass-spectrometry. Journal of Proteome Research. 2005;4:1287–95. doi: 10.1021/pr050011x. [DOI] [PubMed] [Google Scholar]
- 125.Tabb DL, Ma ZQ, Martin DB, Ham AJL, Chambers MC. DirecTag: Accurate sequence tags from peptide MS/MS through statistical scoring. Journal of Proteome Research. 2008;7:3838–46. doi: 10.1021/pr800154p. [DOI] [PMC free article] [PubMed] [Google Scholar]
- 126.Cao X, Nesvizhskii AI. Improved sequence tag generation method for peptide identification in tandem mass spectrometry. Journal of Proteome Research. 2008;7:4422–34. doi: 10.1021/pr800400q. [DOI] [PMC free article] [PubMed] [Google Scholar]
- 127.Johnson RS, Taylor JA. Searching sequence databases via de novo peptide sequencing by tandem mass spectrometry. Molecular Biotechnology. 2002;22:301–15. doi: 10.1385/MB:22:3:301. [DOI] [PubMed] [Google Scholar]
- 128.Kim S, Gupta N, Bandeira N, Pevzner PA. Spectral Dictionaries: Integrating de novo peptide sequencing with database search of tandem mass spectra. Molecular & Cellular Proteomics. 2009;8:53–69. doi: 10.1074/mcp.M800103-MCP200. [DOI] [PMC free article] [PubMed] [Google Scholar]
- 129.Kim S, Bandeira N, Pevzner PA. Spectral Profiles, a Novel Representation of Tandem Mass Spectra and Their Applications for de Novo Peptide Sequencing and Identification. Molecular & Cellular Proteomics. 2009;8:1391–400. doi: 10.1074/mcp.M800535-MCP200. [DOI] [PMC free article] [PubMed] [Google Scholar]
- 130.Shen YF, Tolic N, Hixson KK, Purvine SO, Anderson GA, Smith RD. De novo sequencing of unique sequence tags for discovery of post-translational modifications of proteins. Analytical Chemistry. 2008;80:7742–54. doi: 10.1021/ac801123p. [DOI] [PMC free article] [PubMed] [Google Scholar]
- 131.Shen YF, Tolic N, Hixson KK, Purvine SO, Pasa-Tolic L, Qian WJ, et al. Proteome-wide identification of proteins and their modifications with decreased ambiguities and improved false discovery rates using unique sequence tags. Analytical Chemistry. 2008;80:1871–82. doi: 10.1021/ac702328x. [DOI] [PMC free article] [PubMed] [Google Scholar]
- 132.Bern M, Cai YH, Goldberg D. Lookup peaks: A hybrid of de novo sequencing and database search for protein identification by tandem mass spectrometry. Analytical Chemistry. 2007;79:1393–400. doi: 10.1021/ac0617013. [DOI] [PubMed] [Google Scholar]
- 133.Nesvizhskii AI, Roos FF, Grossmann J, Vogelzang M, Eddes JS, Gruissem W, et al. Dynamic spectrum quality assessment and iterative computational analysis of shotgun proteomic data: toward more efficient identification of post-translational modifications, sequence polymorphisms, and novel peptides. Mol Cell Proteomics. 2006;5:652–70. doi: 10.1074/mcp.M500319-MCP200. [DOI] [PubMed] [Google Scholar]
- 134.Nesvizhskii AI, Keller A, Kolker E, Aebersold R. A statistical model for identifying proteins by tandem mass spectrometry. Analytical Chemistry. 2003;75:4646–58. doi: 10.1021/ac0341261. [DOI] [PubMed] [Google Scholar]
- 135.Chalkley RJ, Baker PR, Huang L, Hansen KC, Allen NP, Rexach M, et al. Comprehensive analysis of a multidimensional liquid chromatography mass spectrometry dataset acquired on a quadrupole selecting, quadrupole collision cell, time-of-flight mass spectrometer - II. New developments in protein prospector allow for reliable and comprehensive automatic analysis of large datasets. Molecular & Cellular Proteomics. 2005;4:1194–204. doi: 10.1074/mcp.D500002-MCP200. [DOI] [PubMed] [Google Scholar]
- 136.Nielsen ML, Savitski MM, Zubarev RA. Extent of modifications in human proteome samples and their effect on dynamic range of analysis in shotgun proteomics. Mol Cell Proteomics. 2006;5:2384–91. doi: 10.1074/mcp.M600248-MCP200. [DOI] [PubMed] [Google Scholar]
- 137.Na S, Jeong J, Park H, Lee KJ, Paek E. Unrestrictive Identification of Multiple Post-translational Modifications from Tandem Mass Spectrometry Using an Error-tolerant Algorithm Based on an Extended Sequence Tag Approach. Molecular & Cellular Proteomics. 2008;7:2452–63. doi: 10.1074/mcp.M800101-MCP200. [DOI] [PubMed] [Google Scholar]
- 138.Liu C, Yan B, Song Y, Xu Y, Cai L. Peptide sequence tag-based blind identification of post-translational modifications with point process model. Bioinformatics. 2006;22:E307–E13. doi: 10.1093/bioinformatics/btl226. [DOI] [PubMed] [Google Scholar]
- 139.Chalkley RJ, Baker PR, Medzihradszky KF, Lynn AJ, Burlingame AL. In-depth Analysis of Tandem Mass Spectrometry Data from Disparate Instrument Types. Molecular & Cellular Proteomics. 2008;7:2386–98. doi: 10.1074/mcp.M800021-MCP200. [DOI] [PMC free article] [PubMed] [Google Scholar]
- 140.Chen Y, Chen W, Cobb MH, Zhao YM. PTMap-A sequence alignment software for unrestricted, accurate, and full-spectrum identification of post-translational modification sites. Proceedings of the National Academy of Sciences of the United States of America. 2009;106:761–6. doi: 10.1073/pnas.0811739106. [DOI] [PMC free article] [PubMed] [Google Scholar]
- 141.Tanner S, Payne SH, Dasari S, Shen Z, Wilmarth PA, David LL, et al. Accurate annotation of peptide modifications through unrestrictive database search. Journal of Proteome Research. 2008;7:170–81. doi: 10.1021/pr070444v. [DOI] [PubMed] [Google Scholar]
- 142.Tsur D, Tanner S, Zandi E, Bafna V, Pevzner PA. Identification of post-translational modifications by blind search of mass spectra. Nature Biotechnology. 2005;23:1562–7. doi: 10.1038/nbt1168. [DOI] [PubMed] [Google Scholar]
- 143.Ahrne E, Muller M, Lisacek F. Unrestricted identification of modified proteins using MS/MS. Proteomics. 2010;10:671–86. doi: 10.1002/pmic.200900502. [DOI] [PubMed] [Google Scholar]
- 144.Menschaert G, Vandekerckhove TTM, Landuyt B, Hayakawa E, Schoofs L, Luyten W, et al. Spectral clustering in peptidomics studies helps to unravel modification profile of biologically active peptides and enhances peptide identification rate. Proteomics. 2009;9:4381–8. doi: 10.1002/pmic.200900248. [DOI] [PubMed] [Google Scholar]
- 145.Falkner JA, Falkner JW, Yocum AK, Andrews PC. A Spectral Clustering Approach to MS/MS Identification of Post-Translational Modifications. Journal of Proteome Research. 2008;7:4614–22. doi: 10.1021/pr800226w. [DOI] [PubMed] [Google Scholar]
- 146.Liebler DC, Hansen BT, Davey SW, Tiscareno L, Mason DE. Peptide sequence motif analysis of tandem MS data with the SALSA algorithm. Analytical Chemistry. 2002;74:203–10. doi: 10.1021/ac0155512. [DOI] [PubMed] [Google Scholar]
- 147.Erassov JLA, Halina P, Canete M, Vo ND, Chung C, Cagney G, et al. Sequential interval motif search: Unrestricted database surveys of global MS/MS data sets for detection of putative post-translational modifications. Analytical Chemistry. 2008;80:7846–54. doi: 10.1021/ac8009017. [DOI] [PubMed] [Google Scholar]
- 148.Baumgartner C, Rejtar T, Kullolli M, Akella LM, Karger BL. SeMoP: A new computational strategy for the unrestricted search for modified peptides using LC-MS/MS data. Journal of Proteome Research. 2008;7:4199–208. doi: 10.1021/pr800277y. [DOI] [PMC free article] [PubMed] [Google Scholar]
- 149.Havilio M, Wool A. Large-scale unrestricted identification of post-translation modifications using tandem mass spectrometry. Analytical Chemistry. 2007;79:1362–8. doi: 10.1021/ac061515x. [DOI] [PubMed] [Google Scholar]
- 150.Craig R, Beavis RC. TANDEM: matching proteins with tandem mass spectra. Bioinformatics. 2004;20:1466–7. doi: 10.1093/bioinformatics/bth092. [DOI] [PubMed] [Google Scholar]
- 151.Perkins DN, Pappin DJC, Creasy DM, Cottrell JS. Probability-based protein identification by searching sequence databases using mass spectrometry data. Electrophoresis. 1999;20:3551–67. doi: 10.1002/(SICI)1522-2683(19991201)20:18<3551::AID-ELPS3551>3.0.CO;2-2. [DOI] [PubMed] [Google Scholar]
- 152.Tharakan R, Edwards N, Graham DRM. Data maximization by multipass analysis of protein mass spectra. Proteomics. 2010;10:1160–71. doi: 10.1002/pmic.200900433. [DOI] [PubMed] [Google Scholar]
- 153.Searle BC, Turner M, Nesvizhskii AI. Improving sensitivity by probabilistically combining results from multiple MS/MS search methodologies. Journal of Proteome Research. 2008;7:245–53. doi: 10.1021/pr070540w. [DOI] [PubMed] [Google Scholar]
- 154.Yu W, Taylor JA, Davis MT, Bonilla LE, Lee KA, Auger PL, et al. Maximizing the sensitivity and reliability of peptide identification in large-scale proteomic experiments by harnessing multiple search engines. Proteomics. 2010;10:1172–89. doi: 10.1002/pmic.200900074. [DOI] [PubMed] [Google Scholar]
- 155.Price TS, Lucitt MB, Wu WC, Austin DJ, Pizarro A, Yocum AK, et al. EBP, a program for protein identification using multiple tandem mass spectrometry datasets. Molecular & Cellular Proteomics. 2007;6:527–36. doi: 10.1074/mcp.T600049-MCP200. [DOI] [PubMed] [Google Scholar]
- 156.Ning K, Fermin D, Nesvizhskii AI. Computational analysis of unassigned high quality MS/MS spectra in proteomic datasets. Proteomics. 2010;10:2712–8. doi: 10.1002/pmic.200900473. [DOI] [PMC free article] [PubMed] [Google Scholar]
- 157.Ahrne E, Masselot A, Binz PA, Muller M, Lisacek F. A simple workflow to increase MS2 identification rate by subsequent spectral library search. Proteomics. 2009;9:1731–6. doi: 10.1002/pmic.200800410. [DOI] [PubMed] [Google Scholar]
- 158.Addona TA, Abbatiello SE, Schilling B, Skates SJ, Mani DR, Bunk DM, et al. Multi-site assessment of the precision and reproducibility of multiple reaction monitoring-based measurements of proteins in plasma. Nat Biotech. 2009;27:633–41. doi: 10.1038/nbt.1546. [DOI] [PMC free article] [PubMed] [Google Scholar]
- 159.Chalkley RJ, Baker PR, Hansen KC, Medzihradszky KF, Allen NP, Rexach M, et al. Comprehensive analysis of a multidimensional liquid chromatography mass spectrometry dataset acquired on a quadrupole selecting, quadrupole collision cell, time-of-flight mass spectrometer - I. How much of the data is theoretically interpretable by search engines? Molecular & Cellular Proteomics. 2005;4:1189–93. doi: 10.1074/mcp.D500001-MCP200. [DOI] [PubMed] [Google Scholar]
- 160.Chen Y, Zhang JM, Xing G, Zhao YM. Mascot-Derived False Positive Peptide Identifications Revealed by Manual Analysis of Tandem Mass Spectra. Journal of Proteome Research. 2009;8:3141–7. doi: 10.1021/pr900172v. [DOI] [PMC free article] [PubMed] [Google Scholar]
- 161.Ding Y, Choi H, Nesvizhskii AI. Adaptive Discriminant Function Analysis and Reranking of MS/MS Database Search Results for Improved Peptide Identification in Shotgun Proteomics. Journal of Proteome Research. 2008;7:4878–89. doi: 10.1021/pr800484x. [DOI] [PMC free article] [PubMed] [Google Scholar]
- 162.Fenyo D, Beavis RC. A method for assessing the statistical significance of mass spectrometry-based protein identifications using general scoring schemes. Analytical Chemistry. 2003;75:768–74. doi: 10.1021/ac0258709. [DOI] [PubMed] [Google Scholar]
- 163.Geer LY, Markey SP, Kowalak JA, Wagner L, Xu M, Maynard DM, et al. Open mass spectrometry search algorithm. Journal of Proteome Research. 2004;3:958–64. doi: 10.1021/pr0499491. [DOI] [PubMed] [Google Scholar]
- 164.Sadygov RG, Yates JR. A hypergeometric probability model for protein identification and validation using tandem mass spectral data and protein sequence databases. Analytical Chemistry. 2003;75:3792–8. doi: 10.1021/ac034157w. [DOI] [PubMed] [Google Scholar]
- 165.Alves G, Ogurtsov AY, Wu WW, Wang G, Shen RF, Yu YK. Calibrating e-values for MS2 database search methods. Biology Direct. 2007;2:26. doi: 10.1186/1745-6150-2-26. [DOI] [PMC free article] [PubMed] [Google Scholar]
- 166.Alves G, Ogurtsov AY, Yu YK. RAId_DbS: Peptide identification using database searches with realistic statistics. Biology Direct. 2007;2:25. doi: 10.1186/1745-6150-2-25. [DOI] [PMC free article] [PubMed] [Google Scholar]
- 167.Klammer AA, Park CY, Noble WS. Statistical Calibration of the SEQUEST XCorr Function. Journal of Proteome Research. 2009;8:2106–13. doi: 10.1021/pr8011107. [DOI] [PMC free article] [PubMed] [Google Scholar]
- 168.Kim S, Gupta N, Pevzner PA. Spectral probabilities and generating functions of tandem mass spectra: A strike against decoy databases. Journal of Proteome Research. 2008;7:3354–63. doi: 10.1021/pr8001244. [DOI] [PMC free article] [PubMed] [Google Scholar]
- 169.Dudoit S, Yang YH, Callow MJ, Speed TP. Statistical methods for identifying differentially expressed genes in replicated cDNA microarray experiments. Statistica Sinica. 2002;12:111–39. [Google Scholar]
- 170.Benjamini Y, Hochberg Y. Controlling the False Discovery Rate - a Practical and Powerful Approach to Multiple Testing. Journal of the Royal Statistical Society Series B-Methodological. 1995;57:289–300. [Google Scholar]
- 171.Tusher VG, Tibshirani R, Chu G. Significance analysis of microarrays applied to the ionizing radiation response. Proceedings of the National Academy of Sciences of the United States of America. 2001;98:5116–21. doi: 10.1073/pnas.091062498. [DOI] [PMC free article] [PubMed] [Google Scholar]
- 172.Storey JD, Tibshirani R. Statistical significance for genomewide studies. Proceedings of the National Academy of Sciences of the United States of America. 2003;100:9440–5. doi: 10.1073/pnas.1530509100. [DOI] [PMC free article] [PubMed] [Google Scholar]
- 173.Efron B, Tibshirani R, Storey JD, Tusher V. Empirical Bayes analysis of a microarray experiment. Journal of the American Statistical Association. 2001;96:1151–60. [Google Scholar]
- 174.Elias JE, Gygi SP. Target-decoy search strategy for increased confidence in large-scale protein identifications by mass spectrometry. Nature Methods. 2007;4:207–14. doi: 10.1038/nmeth1019. [DOI] [PubMed] [Google Scholar]
- 175.Lam H, Deutsch EW, Aebersold R. Artificial Decoy Spectral Libraries for False Discovery Rate Estimation in Spectral Library Searching in Proteomics. Journal of Proteome Research. 2010;9:605–10. doi: 10.1021/pr900947u. [DOI] [PubMed] [Google Scholar]
- 176.Choi H, Nesvizhskii AI. False discovery rates and related statistical concepts in mass spectrometry-based proteomics. Journal of Proteome Research. 2008;7:47–50. doi: 10.1021/pr700747q. [DOI] [PubMed] [Google Scholar]
- 177.Fitzgibbon M, Li QH, McIntosh M. Modes of inference for evaluating the confidence of peptide identifications. Journal of Proteome Research. 2008;7:35–9. doi: 10.1021/pr7007303. [DOI] [PMC free article] [PubMed] [Google Scholar]
- 178.Kall L, Storey JD, MacCoss MJ, Noble WS. Posterior error probabilities and false discovery rates: Two sides of the same coin. Journal of Proteome Research. 2008;7:40–4. doi: 10.1021/pr700739d. [DOI] [PubMed] [Google Scholar]
- 179.Kall L, Storey JD, MacCoss MJ, Noble WS. Assigning significance to peptides identified by tandem mass spectrometry using decoy databases. Journal of Proteome Research. 2008;7:29–34. doi: 10.1021/pr700600n. [DOI] [PubMed] [Google Scholar]
- 180.Higgs RE, Knierman MD, Freeman AB, Gelbert LM, Patil ST, Hale JE. Estimating the statistical significance of peptide identifications from shotgun proteomics experiments. Journal of Proteome Research. 2007;6:1758–67. doi: 10.1021/pr0605320. [DOI] [PubMed] [Google Scholar]
- 181.Olsen JV, Mann M. Improved peptide identification in proteomics by two consecutive stages of mass spectrometric fragmentation. Proceedings of the National Academy of Sciences of the United States of America. 2004;101:13417–22. doi: 10.1073/pnas.0405549101. [DOI] [PMC free article] [PubMed] [Google Scholar]
- 182.Weatherly DB, Atwood JA, Minning TA, Cavola C, Tarleton RL, Orlando R. A heuristic method for assigning a false-discovery rate for protein identifications from mascot database search results. Molecular & Cellular Proteomics. 2005;4:762–72. doi: 10.1074/mcp.M400215-MCP200. [DOI] [PubMed] [Google Scholar]
- 183.Bianco L, Mead JA, Bessant C. Comparison of Novel Decoy Database Designs for Optimizing Protein Identification Searches Using ABRF sPRG2006 Standard MS/MS Data Sets. Journal of Proteome Research. 2009;8:1782–91. doi: 10.1021/pr800792z. [DOI] [PubMed] [Google Scholar]
- 184.Navarro P, Vazquez J. A Refined Method To Calculate False Discovery Rates for Peptide Identification Using Decoy Databases. Journal of Proteome Research. 2009;8:1792–6. doi: 10.1021/pr800362h. [DOI] [PubMed] [Google Scholar]
- 185.Wang G, Wu WW, Zhang Z, Masilamani S, Shen RF. Decoy Methods for Assessing False Positives and False Discovery Rates in Shotgun Proteomics. Analytical Chemistry. 2009;81:146–59. doi: 10.1021/ac801664q. [DOI] [PMC free article] [PubMed] [Google Scholar]
- 186.Feng J, Naiman DQ, Cooper B. Probability-based pattern recognition and statistical framework for randomization: modeling tandem mass spectrum/peptide sequence false match frequencies. Bioinformatics. 2007;23:2210–7. doi: 10.1093/bioinformatics/btm267. [DOI] [PubMed] [Google Scholar]
- 187.Choi H, Nesvizhskii AI. Semisupervised model-based validation of peptide identifications in mass spectrometry-based proteomics. Journal of Proteome Research. 2008;7:254–65. doi: 10.1021/pr070542g. [DOI] [PubMed] [Google Scholar]
- 188.Choi H, Ghosh D, Nesvizhskii AI. Statistical validation of peptide identifications in large-scale proteomics using the target-decoy database search strategy and flexible mixture modeling. Journal of Proteome Research. 2008;7:286–92. doi: 10.1021/pr7006818. [DOI] [PubMed] [Google Scholar]
- 189.Deutsch EW, Mendoza L, Shteynberg D, Farrah T, Lam H, Tasman N, et al. A guided tour of the Trans-Proteomic Pipeline. Proteomics. 10:1150–9. doi: 10.1002/pmic.200900375. [DOI] [PMC free article] [PubMed] [Google Scholar]
- 190.Kall L, Storey JD, Noble WS. Non-parametric estimation of posterior error probabilities associated with peptides identified by tandem mass spectrometry. Bioinformatics. 2008;24:I42–I8. doi: 10.1093/bioinformatics/btn294. [DOI] [PMC free article] [PubMed] [Google Scholar]
- 191.Tang WH, Shilov IV, Seymour SL. Nonlinear fitting method for determining local false discovery rates from decoy database searches. Journal of Proteome Research. 2008;7:3661–7. doi: 10.1021/pr070492f. [DOI] [PubMed] [Google Scholar]
- 192.Zhang JY, Li JQ, Liu X, Xie HW, Zhu YP, He FC. A nonparametric model for quality control of database search results in shotgun proteomics. Bmc Bioinformatics. 2008;9:29. doi: 10.1186/1471-2105-9-29. [DOI] [PMC free article] [PubMed] [Google Scholar]
- 193.Zhang JY, Ma J, Dou L, Wu SF, Qian XH, Xie HW, et al. Bayesian Nonparametric Model for the Validation of Peptide Identification in Shotgun Proteomics. Molecular & Cellular Proteomics. 2009;8:547–57. doi: 10.1074/mcp.M700558-MCP200. [DOI] [PMC free article] [PubMed] [Google Scholar]
- 194.Renard BY, Timm W, Kirchner M, Steen JAJ, Hamprecht FA, Steen H. Estimating the Confidence of Peptide Identifications without Decoy Databases. Analytical Chemistry. 2010;82:4314–8. doi: 10.1021/ac902892j. [DOI] [PubMed] [Google Scholar]
- 195.Martinez-Bartolome S, Navarro P, Martin-Maroto F, Lopez-Ferrer D, Ramos-Fernandez A, Villar M, et al. Properties of average score distributions of SEQUEST. Molecular & Cellular Proteomics. 2008;7:1135–45. doi: 10.1074/mcp.M700239-MCP200. [DOI] [PubMed] [Google Scholar]
- 196.Ramos-Fernandez A, Paradela A, Navajas R, Albar JP. Generalized method for probability-based peptide and protein identification from tandem mass Spectrometry data and sequence database searching. Molecular & Cellular Proteomics. 2008;7:1748–54. doi: 10.1074/mcp.M800122-MCP200. [DOI] [PMC free article] [PubMed] [Google Scholar]
- 197.Razumovskaya J, Olman V, Xu D, Uberbacher EC, VerBerkmoes NC, Hettich RL, et al. A computational method for assessing peptide-identification reliability in tandem mass spectrometry analysis with SEQUEST. Proteomics. 2004;4:961–9. doi: 10.1002/pmic.200300656. [DOI] [PubMed] [Google Scholar]
- 198.Resing KA, Meyer-Arendt K, Mendoza AM, Aveline-Wolf LD, Jonscher KR, Pierce KG, et al. Improving reproducibility and sensitivity in identifying human proteins by shotgun proteomics. Analytical Chemistry. 2004;76:3556–68. doi: 10.1021/ac035229m. [DOI] [PubMed] [Google Scholar]
- 199.Strittmatter EF, Kangas LJ, Petritis K, Mottaz HM, Anderson GA, Shen YF, et al. Application of peptide LC retention time information in a discriminant function for peptide identification by tandem mass spectrometry. Journal of Proteome Research. 2004;3:760–9. doi: 10.1021/pr049965y. [DOI] [PubMed] [Google Scholar]
- 200.Qian WJ, Liu T, Monroe ME, Strittmatter EF, Jacobs JM, Kangas LJ, et al. Probability-based evaluation of peptide and protein identifications from tandem mass spectrometry and SEQUEST analysis: The human proteome. Journal of Proteome Research. 2005;4:53–62. doi: 10.1021/pr0498638. [DOI] [PubMed] [Google Scholar]
- 201.Baczek T, Kaliszan R. Predictions of peptides' retention times in reversed-phase liquid chromatography as a new supportive tool to improve protein identification in proteomics. Proteomics. 2009;9:835–47. doi: 10.1002/pmic.200800544. [DOI] [PubMed] [Google Scholar]
- 202.Malmstrom J, Lee H, Nesvizhskii AI, Shteynberg D, Mohanty S, Brunner E, et al. Optimized peptide separation and identification for mass spectrometry based proteomics via free-flow electrophoresis. Journal of Proteome Research. 2006;5:2241–9. doi: 10.1021/pr0600632. [DOI] [PubMed] [Google Scholar]
- 203.Cargile BJ, Bundy JL, Freeman TW, Stephenson JL. Gel based isoelectric focusing of peptides and the utility of isoelectric point in protein identification. Journal of Proteome Research. 2004;3:112–9. doi: 10.1021/pr0340431. [DOI] [PubMed] [Google Scholar]
- 204.Zhang H, Yi EC, Li XJ, Mallick P, Kelly-Spratt KS, Masselon CD, et al. High throughput quantitative analysis of serum proteins using glycopeptide capture and liquid chromatography mass spectrometry. Molecular & Cellular Proteomics. 2005;4:144–55. doi: 10.1074/mcp.M400090-MCP200. [DOI] [PubMed] [Google Scholar]
- 205.Heller M, Ye ML, Michel PE, Morier P, Stalder D, Junger MA, et al. Added value for tandem mass spectrometry shotgun proteomics data validation through isoelectric focusing of peptides. Journal of Proteome Research. 2005;4:2273–82. doi: 10.1021/pr050193v. [DOI] [PubMed] [Google Scholar]
- 206.Olsen JV, de Godoy LMF, Li GQ, Macek B, Mortensen P, Pesch R, et al. Parts per million mass accuracy on an orbitrap mass spectrometer via lock mass injection into a C-trap. Molecular & Cellular Proteomics. 2005;4:2010–21. doi: 10.1074/mcp.T500030-MCP200. [DOI] [PubMed] [Google Scholar]
- 207.Rudnick PA, Wang YJ, Evans E, Lee CS, Balgley BM. Large scale analysis of MASCOT results using a mass accuracy-based THreshold (MATH) effectively improves data interpretation. Journal of Proteome Research. 2005;4:1353–60. doi: 10.1021/pr0500509. [DOI] [PubMed] [Google Scholar]
- 208.Joo JWJ, Na S, Baek JH, Lee C, Paek E. Target-Decoy with Mass Binning: A Simple and Effective Validation Method for Shotgun Proteomics Using High Resolution Mass Spectrometry. Journal of Proteome Research. 2010;9:1150–6. doi: 10.1021/pr9006377. [DOI] [PubMed] [Google Scholar]
- 209.May D, Fitzgibbon M, Liu Y, Holzman T, Eng J, Kemp CJ, et al. A platform for accurate mass and time analyses of mass spectrometry data. Journal of Proteome Research. 2007;6:2685–94. doi: 10.1021/pr070146y. [DOI] [PubMed] [Google Scholar]
- 210.Petyuk VA, Mayampurath AM, Monroe ME, Polpitiya AD, Purvine SO, Anderson GA, et al. DtaRefinery, a Software Tool for Elimination of Systematic Errors from Parent Ion Mass Measurements in Tandem Mass Spectra Data Sets. Molecular & Cellular Proteomics. 2010;9:486–96. doi: 10.1074/mcp.M900217-MCP200. [DOI] [PMC free article] [PubMed] [Google Scholar]
- 211.Scherl A, Tsai YS, Shaffer SA, Goodlett DR. Increasing information from shotgun proteomic data by accounting for misassigned precursor ion masses. Proteomics. 2008;8:2791–7. doi: 10.1002/pmic.200800045. [DOI] [PubMed] [Google Scholar]
- 212.Shin B, Jung HJ, Hyung SW, Kim H, Lee D, Lee C, et al. Postexperiment monoisotopic mass filtering and refinement (PE-MMR) of tandem mass spectrometric data increases accuracy of peptide identification in LC/MS/MS. Molecular & Cellular Proteomics. 2008;7:1124–34. doi: 10.1074/mcp.M700419-MCP200. [DOI] [PubMed] [Google Scholar]
- 213.Pfeifer N, Leinenbach A, Huber CG, Kohlbacher O. Improving Peptide Identification in Proteome Analysis by a Two-Dimensional Retention Time Filtering Approach. Journal of Proteome Research. 2009;8:4109–15. doi: 10.1021/pr900064b. [DOI] [PubMed] [Google Scholar]
- 214.Klammer AA, Yi XH, MacCoss MJ, Noble WS. Improving tandem mass spectrum identification using peptide retention time prediction across diverse chromatography conditions. Analytical Chemistry. 2007;79:6111–8. doi: 10.1021/ac070262k. [DOI] [PubMed] [Google Scholar]
- 215.Kall L, Canterbury JD, Weston J, Noble WS, MacCoss MJ. Semi-supervised learning for peptide identification from shotgun proteomics datasets. Nature Methods. 2007;4:923–5. doi: 10.1038/nmeth1113. [DOI] [PubMed] [Google Scholar]
- 216.Brosch M, Yu L, Hubbard T, Choudhary J. Accurate and Sensitive Peptide Identification with Mascot Percolator. Journal of Proteome Research. 2009;8:3176–81. doi: 10.1021/pr800982s. [DOI] [PMC free article] [PubMed] [Google Scholar]
- 217.Cerqueira FR, Graber A, Schwikowski B, Baumgartner C. MUDE: A New Approach for Optimizing Sensitivity in the Target-Decoy Search Strategy for Large-Scale Peptide/Protein Identification. Journal of Proteome Research. 2010;9:2265–77. doi: 10.1021/pr901023v. [DOI] [PubMed] [Google Scholar]
- 218.Du X, Yang F, Manes NP, Stenoien DL, Monroe ME, Adkins JN, et al. Linear Discriminant Analysis-Based Estimation of the False Discovery Rate for Phosphopeptide Identifications. Journal of Proteome Research. 2008;7:2195–203. doi: 10.1021/pr070510t. [DOI] [PMC free article] [PubMed] [Google Scholar]
- 219.Higgs RE, Knierman MD, BonnerFreeman A, Gelbert LM, Patil ST, Hale JE. Estimating the Statistical Significance of Peptide Identifications from Shotgun Proteomics Experiments. J Proteome Res. 2007;6:1758–67. doi: 10.1021/pr0605320. [DOI] [PubMed] [Google Scholar]
- 220.Keller A, Eng J, Zhang N, Li Xj, Aebersold R. A uniform proteomics MS/MS analysis platform utilizing open XML file formats. 2005;1:msb4100024-E1–msb-E8. doi: 10.1038/msb4100024. [DOI] [PMC free article] [PubMed] [Google Scholar]
- 221.Alves G, Wu WW, Wang GH, Shen RF, Yu YK. Enhancing peptide identification confidence by combining search methods. Journal of Proteome Research. 2008;7:3102–13. doi: 10.1021/pr700798h. [DOI] [PMC free article] [PubMed] [Google Scholar]
- 222.Jones AR, Siepen JA, Hubbard SJ, Paton NW. Improving sensitivity in proteome studies by analysis of false discovery rates for multiple search engines. Proteomics. 2009;9:1220–9. doi: 10.1002/pmic.200800473. [DOI] [PMC free article] [PubMed] [Google Scholar]
- 223.Li YFG, Arnold RJ, Li YX, Radivojac P, Sheng QH, Tang HX. A Bayesian Approach to Protein Inference Problem in Shotgun Proteomics. Journal of Computational Biology. 2009;16:1183–93. doi: 10.1089/cmb.2009.0018. [DOI] [PMC free article] [PubMed] [Google Scholar]
- 224.Olsen JV, Ong SE, Mann M. Trypsin cleaves exclusively C-terminal to arginine and lysine residues. Molecular & Cellular Proteomics. 2004;3:608–14. doi: 10.1074/mcp.T400003-MCP200. [DOI] [PubMed] [Google Scholar]
- 225.Picotti P, Aebersold R, Domon B. The implications of proteolytic background for shotgun proteomics. Molecular & Cellular Proteomics. 2007;6:1589–98. doi: 10.1074/mcp.M700029-MCP200. [DOI] [PubMed] [Google Scholar]
- 226.Choi H, Fermin D, Nesvizhskii AI. Significance Analysis of Spectral Count Data in Label-free Shotgun Proteomics. Molecular & Cellular Proteomics. 2008;7:2373–85. doi: 10.1074/mcp.M800203-MCP200. [DOI] [PMC free article] [PubMed] [Google Scholar]
- 227.Rappsilber J, Mann M. What does it mean to identify a protein in proteomics? Trends in Biochemical Sciences. 2002;27:74–8. doi: 10.1016/s0968-0004(01)02021-7. [DOI] [PubMed] [Google Scholar]
- 228.Sadygov RG, Liu HB, Yates JR. Statistical models for protein validation using tandem mass spectral data and protein amino acid sequence databases. Analytical Chemistry. 2004;76:1664–71. doi: 10.1021/ac035112y. [DOI] [PubMed] [Google Scholar]
- 229.Gerster S, Qeli E, Ahrens CH, Buhlmann P. Protein and gene model inference based on statistical modeling in k-partite graphs. Proceedings of the National Academy of Sciences of the United States of America. 2010;107:12101–6. doi: 10.1073/pnas.0907654107. [DOI] [PMC free article] [PubMed] [Google Scholar]
- 230.Shen CY, Wang ZP, Shankar G, Zhang X, Li L. A hierarchical statistical model to assess the confidence of peptides and proteins inferred from tandem mass spectrometry. Bioinformatics. 2008;24:202–8. doi: 10.1093/bioinformatics/btm555. [DOI] [PubMed] [Google Scholar]
- 231.Li Q, MacCoss MJ, Stephens M. A nested mixture model for protein identification using mass spectrometry. Ann Appl Stat. 2010;4:962–87. [Google Scholar]
- 232.Feng J, Naiman DQ, Cooper B. Probability model for assessing proteins assembled from peptide sequences inferred from tandem mass spectrometry data. Analytical Chemistry. 2007;79:3901–11. doi: 10.1021/ac070202e. [DOI] [PubMed] [Google Scholar]
- 233.Bern M, Goldberg D. Improved ranking functions for protein and modification-site identifications. Journal of Computational Biology. 2008;15:705–19. doi: 10.1089/cmb.2007.0119. [DOI] [PubMed] [Google Scholar]
- 234.Gupta N, Pevzner PA. False Discovery Rates of Protein Identifications: A Strike against the Two-Peptide Rule. Journal of Proteome Research. 2009;8:4173–81. doi: 10.1021/pr9004794. [DOI] [PMC free article] [PubMed] [Google Scholar]
- 235.Mallick P, Schirle M, Chen SS, Flory MR, Lee H, Martin D, et al. eComputational prediction of proteotypic peptides for quantitative proteomics. Nature Biotechnology. 2007;25:125–31. doi: 10.1038/nbt1275. [DOI] [PubMed] [Google Scholar]
- 236.Li J, Zimmerman LJ, Park BH, Tabb DL, Liebler DC, Zhang B. Network-assisted protein identification and data interpretation in shotgun proteomics. Molecular Systems Biology. 2009;5:303. doi: 10.1038/msb.2009.54. [DOI] [PMC free article] [PubMed] [Google Scholar]
- 237.Ramakrishnan SR, Vogel C, Kwon T, Penalva LO, Marcotte EM, Miranker DP. Mining gene functional networks to improve mass-spectrometry-based protein identification. Bioinformatics. 2009;25:2955–61. doi: 10.1093/bioinformatics/btp461. [DOI] [PMC free article] [PubMed] [Google Scholar]
- 238.Ramakrishnan SR, Vogel C, Prince JT, Li ZH, Penalva LO, Myers M, et al. Integrating shotgun proteomics and mRNA expression data to improve protein identification. Bioinformatics. 2009;25:1397–403. doi: 10.1093/bioinformatics/btp168. [DOI] [PMC free article] [PubMed] [Google Scholar]
- 239.Lange V, Picotti P, Domon B, Aebersold R. Selected reaction monitoring for quantitative proteomics: a tutorial. Molecular Systems Biology. 2008;4:422. doi: 10.1038/msb.2008.61. [DOI] [PMC free article] [PubMed] [Google Scholar]
- 240.Yang XY, Dondeti V, Dezube R, Maynard DM, Geer LY, Epstein J, et al. DBParser: Web-based software for shotgun proteomic data analyses. Journal of Proteome Research. 2004;3:1002–8. doi: 10.1021/pr049920x. [DOI] [PubMed] [Google Scholar]
- 241.Cox J, Mann M. MaxQuant enables high peptide identification rates, individualized p.p.b.-range mass accuracies and proteome-wide protein quantification. Nature Biotechnology. 2008;26:1367–72. doi: 10.1038/nbt.1511. [DOI] [PubMed] [Google Scholar]
- 242.Ma ZQ, Dasari S, Chambers MC, Litton MD, Sobecki SM, Zimmerman LJ, et al. IDPicker 2.0: Improved Protein Assembly with High Discrimination Peptide Identification Filtering. Journal of Proteome Research. 2009;8:3872–81. doi: 10.1021/pr900360j. [DOI] [PMC free article] [PubMed] [Google Scholar]
- 243.Serang O, MacCoss MJ, Noble WS. Efficient marginalization to compute protein posterior probabilities from shotgun mass spectrometry data. Journal of Proteome Research. doi: 10.1021/pr100594k. in press. [DOI] [PMC free article] [PubMed] [Google Scholar]
- 244.Bandeira N, Tsur D, Frank A, Pevzner PA. Protein identification by spectral networks analysis. PNAS. 2007;104:6140–5. doi: 10.1073/pnas.0701130104. [DOI] [PMC free article] [PubMed] [Google Scholar]
- 245.Padliya ND, Garrett WM, Campbell KB, Tabb DL, Cooper B. Tandem mass spectrometry for the detection of plant pathogenic fungi and the effects of database composition on protein inferences. Proteomics. 2007;7:3932–42. doi: 10.1002/pmic.200700419. [DOI] [PMC free article] [PubMed] [Google Scholar]
- 246.Grobei MA, Qeli E, Brunner E, Rehrauer H, Zhang RX, Roschitzki B, et al. Deterministic protein inference for shotgun proteomics data provides new insights into Arabidopsis pollen development and function. Genome Research. 2009;19:1786–800. doi: 10.1101/gr.089060.108. [DOI] [PMC free article] [PubMed] [Google Scholar]
- 247.Isserlin R, Emili A. Interpretation of large-scale quantitative shotgun proteomic profiles for biomarker discovery. Curr Opin Mol Ther. 2008;10:231–42. [PubMed] [Google Scholar]
- 248.Brunner E, Ahrens CH, Mohanty S, Baetschmann H, Loevenich S, Potthast F, et al. A high-quality catalog of the Drosophila melanogaster proteome. Nature Biotechnology. 2007;25:576–83. doi: 10.1038/nbt1300. [DOI] [PubMed] [Google Scholar]
- 249.Baerenfaller K, Grossmann J, Grobei MA, Hull R, Hirsch-Hoffmann M, Yalovsky S, et al. Genome-Scale Proteomics Reveals Arabidopsis thaliana Gene Models and Proteome Dynamics. Science. 2008;320:938–41. doi: 10.1126/science.1157956. [DOI] [PubMed] [Google Scholar]
- 250.Reiter L, Claassen M, Schrimpf SP, Jovanovic M, Schmidt A, Buhmann JM, et al. Protein Identification False Discovery Rates for Very Large Proteomics Data Sets Generated by Tandem Mass Spectrometry. Molecular & Cellular Proteomics. 2009;8:2405–17. doi: 10.1074/mcp.M900317-MCP200. [DOI] [PMC free article] [PubMed] [Google Scholar]
- 251.Everett LJ, Bierl C, Master SR. Unbiased Statistical Analysis for Multi-Stage Proteomic Search Strategies. Journal of Proteome Research. 2010;9:700–7. doi: 10.1021/pr900256v. [DOI] [PubMed] [Google Scholar]
- 252.Piggee C. Phosphoproteomics: Miles To Go Before It's Routine. Anal Chem. 2009;81:2418–20. doi: 10.1021/ac802740t. [DOI] [PubMed] [Google Scholar]
- 253.Mayya V, Han DK. Phosphoproteomics by mass spectrometry: insights, implications, applications and limitations. Expert Rev Proteomics. 2009;6:605–18. doi: 10.1586/epr.09.84. [DOI] [PMC free article] [PubMed] [Google Scholar]
- 254.Bodenmiller B, Mueller LN, Mueller M, Domon B, Aebersold R. Reproducible isolation of distinct, overlapping segments of the phosphoproteome. 2007;4:231–7. doi: 10.1038/nmeth1005. [DOI] [PubMed] [Google Scholar]
- 255.Steen H, Jebanathirajah JA, Rush J, Morrice N, Kirschner MW. Phosphorylation Analysis by Mass Spectrometry: Myths, Facts, and the Consequences for Qualitative and Quantitative Measurements. Mol Cell Proteomics. 2006;5:172–81. doi: 10.1074/mcp.M500135-MCP200. [DOI] [PubMed] [Google Scholar]
- 256.White FM. Quantitative phosphoproteomic analysis of signaling network dynamics. Current Opinion in Biotechnology. 2008;19:404–9. doi: 10.1016/j.copbio.2008.06.006. [DOI] [PMC free article] [PubMed] [Google Scholar]
- 257.Ulintz PJ, Bodenmiller B, Andrews PC, Aebersold R, Nesvizhskii AI. Investigating MS2/MS3 Matching Statistics: A Model For Coupling Consecutive Stage Mass Spectrometry Data For Increased Peptide Identification Confidence. Mol Cell Proteomics. 2008;7:71–87. doi: 10.1074/mcp.M700128-MCP200. [DOI] [PubMed] [Google Scholar]
- 258.Ulintz PJ, Yocum AK, Bodenmiller B, Aebersold R, Andrews PC, Nesvizhskii AI. Comparison of MS2-Only, MSA, and MS2/MS3 Methodologies for Phosphopeptide Identification. Journal of Proteome Research. 2009;8:887–99. doi: 10.1021/pr800535h. [DOI] [PMC free article] [PubMed] [Google Scholar]
- 259.Alcolea MP, Kleiner O, Cutillas PR. Increased Confidence in Large-Scale Phosphoproteomics Data by Complementary Mass Spectrometric Techniques and Matching of Phosphopeptide Data Sets. J Proteome Res. 2009;8:3808–15. doi: 10.1021/pr800955n. [DOI] [PubMed] [Google Scholar]
- 260.Grimsrud PA, Swaney DL, Wenger CD, Beauchene NA, Coon JJ. ACS Chem Biol. Vol. 5. Phosphoproteomics for the Masses; pp. 105–19. [DOI] [PMC free article] [PubMed] [Google Scholar]
- 261.Bailey CM, Sweet SMM, Cunningham DL, Zeller M, Heath JK, Cooper HJ. SLoMo: Automated Site Localization of Modifications from ETD/ECD Mass Spectra. J Proteome Res. 2009;8:1965–71. doi: 10.1021/pr800917p. [DOI] [PubMed] [Google Scholar]
- 262.Beausoleil SA, Villen J, Gerber SA, Rush J, Gygi SP. A probability-based approach for high-throughput protein phosphorylation analysis and site localization. Nature Biotechnology. 2006;24:1285–92. doi: 10.1038/nbt1240. [DOI] [PubMed] [Google Scholar]
- 263.Ruttenberg BE, Pisitkun T, Knepper MA, Hoffert JD. PhosphoScore: An open-source phosphorylation site assignment tool for MSn data. J Proteome Res. 2008;7:3054–9. doi: 10.1021/pr800169k. [DOI] [PMC free article] [PubMed] [Google Scholar]
- 264.Bradshaw RA, Burlingame AL, Carr S, Aebersold R. Reporting protein identification data - The next generation of guidelines. Mol Cell Proteomics. 2006;5:787–8. doi: 10.1074/mcp.E600005-MCP200. [DOI] [PubMed] [Google Scholar]
- 265.Wu L, Han DK. Overcoming the dynamic range problem in mass spectrometry-based shotgun proteomics. Expert Review of Proteomics. 2006;3:611–9. doi: 10.1586/14789450.3.6.611. [DOI] [PubMed] [Google Scholar]
- 266.Meng FY, Forbes AJ, Miller LM, Kelleher NL. Detection and localization of protein modifications by high resolution tandem mass spectrometry. Mass Spectrometry Reviews. 2005;24:126–34. doi: 10.1002/mas.20009. [DOI] [PubMed] [Google Scholar]
- 267.Krogan NJ, Cagney G, Yu H, Zhong G, Guo X, Ignatchenko A, et al. Global landscape of protein complexes in the yeast Saccharomyces cerevisiae. Nature. 2006;440:637–43. doi: 10.1038/nature04670. [DOI] [PubMed] [Google Scholar]
- 268.Chait BT. CHEMISTRY: Mass Spectrometry: Bottom-Up or Top-Down? Science. 2006;314:65–6. doi: 10.1126/science.1133987. [DOI] [PubMed] [Google Scholar]
- 269.Garcia BA. What Does the Future Hold for Top Down Mass Spectrometry? J Am Soc Mass Spectrom. 21:193–202. doi: 10.1016/j.jasms.2009.10.014. [DOI] [PubMed] [Google Scholar]
- 270.Frank A, Pevzner P. PepNovo: De novo peptide sequencing via probabilistic network modeling. Analytical Chemistry. 2005;77:964–73. doi: 10.1021/ac048788h. [DOI] [PubMed] [Google Scholar]
- 271.Ma B, Zhang KZ, Hendrie C, Liang CZ, Li M, Doherty-Kirby A, et al. PEAKS: powerful software for peptide de novo sequencing by tandem mass spectrometry. Rapid Communications in Mass Spectrometry. 2003;17:2337–42. doi: 10.1002/rcm.1196. [DOI] [PubMed] [Google Scholar]
- 272.Eng JK, McCormack AL, Yates JR. An Approach to Correlate Tandem Mass-Spectral Data of Peptides with Amino-Acid-Sequences in a Protein Database. Journal of the American Society for Mass Spectrometry. 1994;5:976–89. doi: 10.1016/1044-0305(94)80016-2. [DOI] [PubMed] [Google Scholar]
- 273.Clauser KR, Baker P, Burlingame AL. Role of accurate mass measurement (+/- 10 ppm) in protein identification strategies employing MS or MS MS and database searching. Analytical Chemistry. 1999;71:2871–82. doi: 10.1021/ac9810516. [DOI] [PubMed] [Google Scholar]
- 274.Zhang N, Aebersold R, Schwilkowski B. ProbID: A probabilistic algorithm to identify peptides through sequence database searching using tandem mass spectral data. Proteomics. 2002;2:1406–12. doi: 10.1002/1615-9861(200210)2:10<1406::AID-PROT1406>3.0.CO;2-9. [DOI] [PubMed] [Google Scholar]
- 275.Colinge J, Masselot A, Giron M, Dessingy T, Magnin J. OLAV: Towards high-throughput tandem mass spectrometry data identification. Proteomics. 2003;3:1454–63. doi: 10.1002/pmic.200300485. [DOI] [PubMed] [Google Scholar]
- 276.Matthiesen R, Trelle MB, Hojrup P, Bunkenborg J, Jensen ON. VEMS 3.0: Algorithms and computational tools for tandem mass spectrometry based identification of post-translational modifications in proteins. Journal of Proteome Research. 2005;4:2338–47. doi: 10.1021/pr050264q. [DOI] [PubMed] [Google Scholar]
- 277.Tabb DL, Fernando CG, Chambers MC. MyriMatch: Highly accurate tandem mass spectral peptide identification by multivariate hypergeometric analysis. Journal of Proteome Research. 2007;6:654–61. doi: 10.1021/pr0604054. [DOI] [PMC free article] [PubMed] [Google Scholar]
- 278.Xu H, Freitas MA. Monte Carlo Simulation-based algorithms for analysis of shotgun proteomic data. Journal of Proteome Research. 2008;7:2605–15. doi: 10.1021/pr800002u. [DOI] [PMC free article] [PubMed] [Google Scholar]
- 279.Tanner S, Shu HJ, Frank A, Wang LC, Zandi E, Mumby M, et al. InsPecT: Identification of posttransiationally modified peptides from tandem mass spectra. Analytical Chemistry. 2005;77:4626–39. doi: 10.1021/ac050102d. [DOI] [PubMed] [Google Scholar]
- 280.Hernandez P, Gras R, Frey J, Appel RD. Popitam: Towards new heuristic strategies to improve protein identification from tandem mass spectrometry data. Proteomics. 2003;3:870–8. doi: 10.1002/pmic.200300402. [DOI] [PubMed] [Google Scholar]
- 281.Craig R, Cortens JP, Beavis RC. The use of proteotypic peptide libraries for protein identification. Rapid Communications in Mass Spectrometry. 2005;19:1844–50. doi: 10.1002/rcm.1992. [DOI] [PubMed] [Google Scholar]
- 282.Searle BC. Scaffold: A bioinformatic tool for validating MS/MS-based proteomic studies. Proteomics. 2010;10:1265–9. doi: 10.1002/pmic.200900437. [DOI] [PubMed] [Google Scholar]
- 283.Slotta DJ, McFarland MA, Markey SP. MassSieve: Panning MS/MS Peptide Data for Proteins. Proteomics. 2010;10:3035–9. doi: 10.1002/pmic.200900370. [DOI] [PMC free article] [PubMed] [Google Scholar]
- 284.Qeli E, Ahrens CH. PeptideClassifier for protein inference and targeted quantitative proteomics. Nat Biotech. 2010;28:647–50. doi: 10.1038/nbt0710-647. [DOI] [PubMed] [Google Scholar]
- 285.Hakkinen J, Vincic G, Mansson O, Warell K, Levander F. The Proteios Software Environment: An Extensible Multiuser Platform for Management and Analysis of Proteomics Data. Journal of Proteome Research. 2009;8:3037–43. doi: 10.1021/pr900189c. [DOI] [PubMed] [Google Scholar]
- 286.Rauch A, Bellew M, Eng J, Fitzgibbon M, Holzman T, Hussey P, et al. Computational Proteomics Analysis System (CPAS): An extensible, open-source analytic system for evaluating and publishing proteomic data and high throughput biological experiments. Journal of Proteome Research. 2006;5:112–21. doi: 10.1021/pr0503533. [DOI] [PubMed] [Google Scholar]
- 287.Martens L, Hermjakob H, Jones P, Adamski M, Taylor C, States D, et al. PRIDE: The proteomics identifications database. Proteomics. 2005;5:3537–45. doi: 10.1002/pmic.200401303. [DOI] [PubMed] [Google Scholar]
- 288.Slotta DJ, Barrett T, Edgar R. NCBI Peptidome: a new public repository for mass spectrometry peptide identifications. Nature Biotechnology. 2009;27:600–1. doi: 10.1038/nbt0709-600. [DOI] [PMC free article] [PubMed] [Google Scholar]
- 289.Mohien CU, Hartler J, Breitwieser F, Rix U, Rix LR, Winter GE, et al. MASPECTRAS 2: An integration and analysis platform for proteomic data. Proteomics. 2010;14:4. doi: 10.1002/pmic.201000075. [DOI] [PubMed] [Google Scholar]