

Abstract
Antibody display systems have been successfully applied to screen, select and characterize antibody fragments. These systems typically use prokaryotic organisms such as phage and bacteria or lower eukaryotic organisms, such as yeast. These organisms possess either no or different post-translational modification functions from mammalian cells and prefer to display small antibody fragments instead of full-length IgGs. We report here a novel mammalian cell-based antibody display platform that displays full-length functional antibodies on the surface of mammalian cells. Through recombinase-mediated DNA integration, each host cell contains one copy of the gene of interest in the genome. Utilizing a hot-spot integration site, the expression levels of the gene of interest are high and comparable between clones, ensuring a high signal to noise ratio. Coupled with fluorescence-activated cell sorting (FACS) technology, our platform is high throughput and can distinguish antibodies with very high antigen binding affinities directly on the cell surface. Single-round FACS can enrich high affinity antibodies by more than 500-fold. Antibodies with significantly improved neutralizing activity have been identified from a randomly mutagenized library, demonstrating the power of this platform in screening and selecting antibody therapeutics.
Key words: antibody display, mammalian display, antibody library, vector, antibody screen, affinity maturation
Introduction
Monoclonal antibodies (mAbs) have proven to be valuable therapeutics for the treatment of cancers, inflammatory diseases and many other human diseases. More than twenty therapeutic mAbs have been approved by the Food and Drug Administration and more than 150 mAbs are in different stages of clinical trials.1,2 Historically, most of the antibodies were generated through hybridoma technology. During the past decade, antibody display technology has become increasingly valuable for the development of antibody therapeutics. Several cell-based display techniques have been developed including phage display,3–8 E. coli display9–11 and more recently, yeast display.12–17 Each display system has its strengths and weaknesses.1
The majority of antibody therapeutics developed thus far are full-length bivalent IgG molecules produced in mammalian cells. Therefore, an ideal display system for therapeutic antibody screening should be mammalian cell-based and able to display full-length antibodies. Researchers have applied multiple strategies in the effort to develop mammalian display technology, including using different mammalian cell types, e.g., COS cells, lymphoma-derived B cells, 293T cells, BHK cells and different delivery vehicles, e.g., plasmids, retroviral vectors, vaccinia virus and sindbis virus, to display peptides, antibody fragments or full-length antibodies.19–26 Most of these systems, however, display multiple copies of antibodies with different specificities on a single cell surface, making it difficult to identify and isolate antibodies with a desired property. These limitations significantly hamper the application of mammalian display technology in the development of therapeutic antibodies.
In this report, we describe the development of a novel mammalian display platform that can display full-length, bivalent functional antibodies with defined specificity on the surface of mammalian cells, including CHO cells, which are the most widely used cell line for production of antibody therapeutics in industry.27 The results have demonstrated that our display platform, when coupled with FACS, is a very robust technology for screening and selecting antibodies with high levels of expression and affinity.
Results
Development of display scaffold.
For rapid and unambiguous antibody screening, it is important that each host cell express only one specific antibody. In humans, each matured B cell expresses only one kind of antibody even though these cells contain all genes necessary for the entire repertoire of antibodies. For phage display, as well as E. coli and yeast display platforms, there may be several to over a thousand copies of an antibody fragment displayed on each cell surface, all with a single defined specificity.
To develop a comparable platform in mammalian cells, the Flp-In™ system (Invitrogen,28) was chosen for its ability to integrate a gene of interest into the host cell at a specific genomic location. The Flp-In™ mechanism involves introduction of an Flp Recombination Target (FRT) site into the genome of the mammalian cell line of choice, and subsequent integration of an expression vector containing the gene of interest into the genome via Flp recombinase-mediated DNA recombination at the single FRT site. The selectable hygromycin gene in the vector contains no start codon and no promoter, therefore it can only be expressed when it is integrated in-frame with the ATG codon and up-stream promoter of the FRT site within the host cell genome. Two parallel expression cassettes for the expression of both heavy and light chains were created in the pcDNA5/FRT vector to generate the Flp vector (FV; Fig. 1). Among the promoters we have tested, the CMV promoter was chosen for its ability to drive the expression of both heavy and light chains at fairly high and relatively equal levels.
Figure 1.

Schematic illustration of Homologous Recombination by the Flp-In™ System. Two expression cassettes for heavy and light chains were inserted into pcDNA5/FRT to form vector FV. Vector pOG44 contained the Flp recombinase gene. After co-transfection of both vectors FV and pOG44, the Flp recombinase expressed from pOG44 catalyzes a homologous recombination event between the FRT sites of the Flp-In host cell and the vector FV. Then the whole vector is inserted by homologous integration into the genome of the host cell only at the location of FRT.
To verify that each cell expressed only one specific protein under this system, a second expression vector, pcDNA5/FRT-Fc-Fusion, was constructed to express an Fc-fusion protein that can be distinguished from full-length antibody. Both FV and pcDNA5/FRT-Fc-Fusion vectors were stably co-transfected into Flp-In CHO (FCHO) cells together with pOG44 vector, and the resulting recombinant antibody and Fc-fusion protein expressed in the conditioned media were analyzed by western blotting. Our results showed that among the randomly selected 100 clones analyzed, 99 clones expressed only one protein, either antibody or Fc-Fusion protein (Fig. 2A), indicating that under almost all circumstances only one copy of the vector, either FV or pcDNA5/FRT-Fc-Fusion, is integrated into the host cell genome. In a single case, we observed one colony expressing both antibody and Fc-fusion protein.
Figure 2.

Western blot analysis of antibody expression in single cell clones. The selected single stable-cell clones were expanded in selection medium which was replaced with serum-free medium. Day 4 serum-free conditioned medium (CM) from each clone was collected and analyzed by SDS-PAGE. After electrophoretic separation, the proteins were transferred onto PVDF membrane, stained by anti human-Fc monoclonal antibody and visualized by SEC technology (Amersham). (A) FCHO cell clones stably transfected by a mixture of both vectors FV and pcDNA5/FRT-Fc-Fusion. (B) Regular CHO cell clones stably transfected by vector pcDNA5/FRT-FC-Fusion. (C) FCHO cell clones stably transfected by vector pcDNA5/FRT-FC-Fusion.
To further confirm single copy plasmid integration per cell mediated by the Flp-In™ system, FACS was used to isolate single cell clones from a library pool of FCHO cells. These individual clones were further analyzed by RT-PCR to identify antibody genes. The data demonstrated that only one pair of antibody heavy chain and light chain genes were identified by RT-PCR, confirming that only a single antibody expression vector is integrated into the host cell genome.
In order to compare the relative expression level of the Flp-In™ system with non-Flp-In system, 9 FCHO cell clones transfected by vector pcDNA5/FRT-Fc-Fusion (Fig. 2C) were randomly picked and evaluated against 9 regular CHO cell clones stably transfected with the same vector (Fig. 2B). FCHO clones expressed similar levels of Fc-fusion protein at about 1 µg per ml of conditioned medium. In contrast, protein expression levels in the regular CHO cell clones were variable, with little to no detectable expression in some of the clones.
Verification of expression and surface display of full-length antibodies.
To display antibodies on the cell surface, we constructed another vector (FVTM) that contains a trans-membrane domain as described in Materials and Methods (Fig. 3). The antibody heavy and light chain coding sequences were cloned into the FVTM and the resulting vector was transiently transfected into Flp-In 293 (F293) cells (Invitrogen). At 48 h post-transfection, the cell surface displayed antibodies were probed with fluorescent dye-conjugated specific antigen or antibodies against human light chain or heavy chain and were analyzed by flow cytometry (Fig. 4).
Figure 3.

Schematic illustration of mammalian display system. The PDGFR trans-membrane domain was C-terminally fused to the heavy chain constant region in vector FV to form the antibody display vector FVTM. After transfection of the vector FVTM into Flp-In cells, both heavy and light chains were expressed, assembled and displayed on the cell surface.
Figure 4.

Flow cytometry analysis of antibodies displayed on the cell surface. Flp-In 293 cells were transiently transfected by FVTM containing the same human antibody gene (B–E) or a library of antibody genes (F). Cells were labeled 48-hrs post transfection with fluorescence-conjugated antibodies and/or antigen and then analyzed by flow cytometry. Kappa-PE, Phycoerythrin (PE)-conjugated mouse anti-human Kappa chain antibody; FC-FITC, FITC-conjugated mouse anti-human IgG antibody; Antigen-FITC, FITC-conjugated specific antigen. The x- and y-axis indicate the fluorescence intensities of FITC and PE fluorophores respectively. The cells carrying vector without antibody genes were used as the control (A).
Two-color flow cytometric analysis of transfected cells demonstrated the accessible display of full-length specific antibodies on the cell surface (Fig. 4). Bivariate dot-blots demonstrated a linear relationship between the fluorescence intensity of FITC [level of anti-IgG Fc binding (Fig. 4C) or antigen binding (Fig. 4D–F)] and PE level of anti-kappa chain antibody binding, (Fig. 4B, C, E and F) for the cells carrying FVTM vector. As a control, background fluorescence was measured in cells carrying the vector without antibody genes (Fig. 4A). The fluorescence intensity of anti-IgG Fc antibody binding indicated the level of antibody expression on the cell surface. As described in Materials and Methods, the heavy and light chain coding sequences are driven by their promoters and transcribed and translated separately. Only the heavy chain contains an in-frame fusion of the PDGFR trans-membrane domain at the carboxy-terminus. The fluorescent signal of anti-light chain antibody binding indicated not only the expression of light chain, but the assembly of light chain with its complementary heavy chain on the cell surface. Figure 4D shows the antigen binding on the surface of cells transfected with the specific antibody expression vector when the cells were stained with only the antigen. This binding may come from three different sources: specific antibody displayed on the cell surface, specific endogenous receptor or non-specific binding of the antigen to surface proteins. Single staining of cells with antigen only cannot distinguish between these events, but double staining of the cells with anti-kappa antibodies and specific antigen may allow one to distinguish binding to the displayed antibody from both the non-specific binding and binding of the antigen to endogenous receptors. To investigate how double staining can be used to distinguish specific antibody binding, a stable selected antibody-displaying cell population was stained with anti-kappa antibodies and specific antigen (Fig. 4E). The concentration of the antigen used was identified by pre-titration with parent cells to allow binding to antibodies, but not specific receptors. In FACS analysis, the cells with non-specific binding are distributed randomly in the display graph and the cells with endogenous receptor binding will be located in the bottom of the graph (Fig. 4D). The linear distribution of the cells in Figure 4E from low-left corner to up-right corner indicated that most, if not all, of the binding results from the specific binding between antigen and its specific antibodies.
This double staining strategy can also be used to distinguish the cells expressing a library of proteins including antibodies as shown in Figure 4F. The y-axis indicates the expression of antibodies and the x-axis indicates the affinity of antibodies. The cells located close to the left in the graph display the antibodies without antigen binding ability and the cells located upper right of the graph display the antibodies with high antigen binding ability and high expression level. The cells displaying antibodies with low to moderate binding activity are distributed in between.
Analysis of antibody display on the cell surface.
The Biacore platform is the most commonly used method to analyze the binding affinity between antibodies and their respective antigen molecules. To test whether the mammalian display platform can mimic Biacore analysis to measure the affinity directly on the cell surface, an experiment was designed to assess the antigen binding patterns of surface-displayed antibodies. Different concentrations of antigen from 6.25 pM to 62.5 nM were used with the previously described two-step double staining procedure utilizing anti-kappa chain antibody to stain the stably transfected antibody-displaying FCHO cells. The results (Fig. 5) demonstrate the dosage-dependent binding of the antibody to specific antigen. The trend is that the higher the concentration of antigen needed to show binding, the weaker the affinity of the antibody displayed. This characteristic allows the screening of antibodies with desired affinity by using different concentrations of antigen. By lowering the antigen concentration used in screening, one can isolate antibodies with higher affinities.
Figure 5.

Characteristics of antibody display on cell surface. FCHO cells stably transfected with antibody display vectors directing the surface expression of antibodies were co-stained with PE-conjugated anti-kappa chain antibody and FITC-conjugated antigen and then analyzed by flow cytometry. The concentration of anti-kappa chain antibody was fixed and the concentration of the antigen was titrated in a range of 6.25 pM–62.5 nM. Neg is the negative control and the cells were stained by neither antibody nor antigen. (A) Dose dependent binding of antigen to antibody-displaying cells. The X-axis indicates the fluorescence strength of FITC and Y-axis represents the fluorescence strength of PE. (B) Analysis of cell populations displaying antibodies with different affinities. The RBA for each antigen concentration was calculated and the data for both Ab-1 and Ab-2 are presented as antigen dose dependent binding curves.
To demonstrate that the mammalian display platform can sensitively distinguish antibodies with pico-molar affinities, two antibodies (Ab-1 and Ab-2) with known picomolar affinities were displayed on the surface of FCHO cells. Both antibodies showed picomolar affinities to the same antigen with only about a 5-fold difference (Ab-1 = 24 pM, Ab-2 = 118 pM). A dose-dependent binding experiment was carried out and fluorescence strength of expression (FSE), fluorescence strength of binding (FSB) and relative binding ability (RBA) values were calculated as described in Materials and Methods. Results from this experiment demonstrated that the binding parameters of these two antibodies can be distinguished most clearly using an antigen concentration of 6.25 nM (Fig. 5B).
Enrichment of cells displaying high affinity antibody.
The ability to distinguish different binding affinities and subsequently isolate antibodies with higher affinities is an important function of antibody screening technology. FACS analysis is a powerful screening tool to enrich for antibody-displaying cells with specific affinities. As previously described, our mammalian display platform can generally distinguish antibody affinities within picomolar range. To demonstrate that FACS can efficiently enrich for antibodies with high affinities, the two antibody-displaying cell populations were mixed with untransfected parental FCHO cells at different ratios and co-stained with 100 ng/ml of specific antigen and anti-kappa chain antibody as indicated and then analyzed by flow cytometry. Again, these three populations in the mixture can be clearly distinguished (Fig. 6A); 0.17% of the cells were identified as displaying high affinity antibody and these cells were expanded and re-analyzed, showing 500–1,000 fold enrichment after a single sorting (Fig. 6B and C).
Figure 6.

Enrichment of cells displaying high affinity antibodies. (A) A mixture of cell populations displaying Ab-1 and Ab-2 were combined with parental untransfected Flp-In CHO cells at a ratio of 50:50. The ratios of Ab-1 and Ab-2 in final cell suspension were 1:10, 1:100 or 1:1,000 as indicated. The final cell mixtures were double stained by 100 nM of FITC-antigen and PE-anti-kappa chain antibody and then analyzed by flow cytometry. (B) 0.17% of the cells displaying Ab-1 were sorted from the mixture by FACS for expansion and re-analysis. (C) The sorted cells were re-analyzed by flow cytometry after 10 days expansion.
Affinity maturation of neutralizing antibody by mammalian display.
Construction and diversity analysis of antibody library. MacCallum et al.29 analyzed the crystal structure of 26 antibody-antigen complexes and found that certain positions in CDRs make contact with antigens more frequently than others, indicating the importance of these positions in antibody-antigen interactions. H33, H50, H52, H56 H95-98 are among these key positions. Mutagenesis of these residues may impact the specific affinity of an antibody towards the target antigen. To further evaluate the application of the mammalian display platform for affinity maturation, one anti-OX40 ligand antibody, Mab40-L11, was chosen (Fig. 7). Mab40-L11 was comprised of the IgG1 heavy chain and Lambda light chain. Considering the library size limitations for mammalian display, four codons in the variable domain of heavy chain (Vh) at positions Y33 in CDR1, Y50 in CDR 2, F96 and T97 in CDR3 were chosen for random mutagenesis. The light chain was left unchanged. Codon mutations were introduced by PCR amplification and the mutagenized Vh fragments were assembled with the human IgG1 constant domain to form a full-length heavy chain library. To adequately cover the diversity of the mutagenesis at four positions, a library of 1 × 10⁶ transformants was constructed and screened.
Figure 7.

Strategy of combinatorial mutagenesis of VH domain. Fragments 1, 2 and 3 were amplified separately using primer pairs as indicated, and the three fragments were assembled to form the mutagenized full-length heavy chain library using sequence overlap extension PCR with primers P1 and P6. The library was then inserted into the display vector using the HindIII and BamHI cloning sites.
To analyze the diversity of the library, plasmid DNAs from 23 bacteria colonies were isolated and the Vh domains were sequenced. Four out of 23 did not contain the necessary open reading frames to cover all of the four positions. The amino acid residues at these four positions in the other 19 clones are listed in Table 1. Compared with the heavy chain of Mab40-L11, 18 out of 19 clones are different from the parental clone by at least two amino acids and all of the four residues were mutated in 15 out of 19 clones. Additionally, 10 or more different residues were observed at each position, showing a diverse representation of amino acids. Purified plasmid DNA from 12 of these 19 clones was transfected into FCHO cells where expression and binding activity were assessed by flow cytometry. As shown in Table 1, only 8 out of 12 clones expressed antibodies on the cell surfaces and none of the clones showed specific antigen binding. These results indicate the rarity of clones in the library retaining specific antigen binding ability after combinational random amino acid substitution at the specified positions.
Table 1.
Residue changes at 4 positions in Mab40-L11 Vh domain
| DNA clones | H33* | H50* | H96* | H97* | Expression** | Binding** |
| mAb40-L11 | Tyr | Tyr | Phe | Thr | Yes | Yes |
| 110 | Glu | Thr | Asn | ND | ND | |
| 111 | Arg | Pro | ND | ND | ||
| 112 | Asn | Met | Asn | Ser | ND | ND |
| 113 | Ser | Leu | Met | Ser | ND | ND |
| 114 | Ala | Arg | Leu | Ala | ND | ND |
| 117 | Ile | Lys | Thr | Ser | ND | ND |
| 118 | Pro | Trp | Ser | Asp | ND | ND |
| 119 | Pro | Ser | Leu | Arg | No | No |
| 121 | Asn | Gln | Lys | Gly | Yes | No |
| 122 | Ala | Ile | Gly | Cys | No | No |
| 123 | Cys | Met | Asp | Pro | No | No |
| 124 | Ser | Asn | Ile | Yes | No | |
| 125 | Leu | Yes | No | |||
| 126 | Ile | Leu | Met | Gln | Yes | No |
| 127 | Lys | Thr | Arg | Ala | No | No |
| 128 | Glu | Trp | Leu | Phe | Yes (low) | No |
| 129 | Thr | Leu | Gly | Tyr | Yes | No |
| 130 | Asn | Val | Asp | Val | Yes | No |
| 132 | Leu | Leu | Ser | Cys | Yes | No |
| Total*** | 11/18 | 13/18 | 10/17 | 13/16 | 8/12 | 0/12 |
Residue number in heavy chain CDR. The residue names are not shown if they are not changed relative to parental clone Mab40-L11.
ND, Experiment was not done.
mAb40-L11 is not counted. For expression and binding, clones marked ND are not counted.
Display and screen of the antibody library on FCHO cell surface. An FCHO cell pool stably expressing the anti-OX40 ligand antibody library was established as described in Materials and Methods and used in antibody display and affinity screening analysis. A concentration of 100 nM of FITC-labeled OX40 ligand was used in the screening of library. As shown in Figure 8, distribution of the cells showed a wide range in expression and affinity. The majority of the cells did not display antibodies on the cell surface, and less than 7% of the cells displayed antibodies with specific antigen binding ability. Forty-eight single cell clones sorted from gate R3 (Fig. 8) were analyzed by flow cytometry after 16 days of expansion. Five clones with an X-mean value larger than 100 were selected for further relative binding ability (RBA) and Vh domain DNA sequences analysis. Every one of the 5 clones analyzed had a RBA higher than the parental antibody Mab40-L11 (Table 2).
Figure 8.
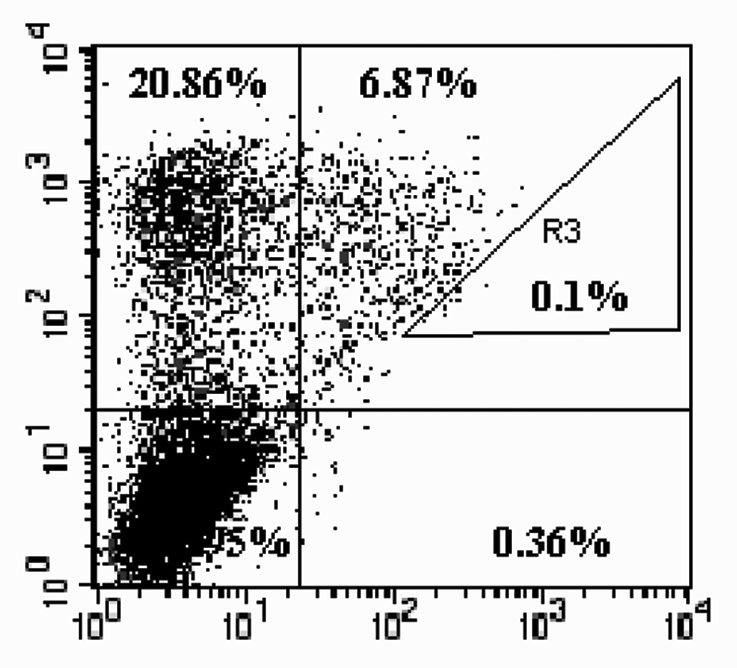
Sorting of the library for high affinity clones. An FCHO cell pool stably transfected with mutant library was double-labeled using both PE-conjugated anti-Lambda chain antibody and FITC-conjugated OX40 ligand (100 nM) and analyzed by flow cytometry. Cells located in gate R3 (0.1%) were single-cell sorted into a 96-well plate with one cell per well and expanded for further analysis.
Table 2.
Sequences and binding activity of selected clones
| Clones | H33/CDR1 | H50/CDR2 | H96/CDR3 | H97/CDR3 | sAg to mAb | RBA | sAb to mAg | IC50 |
| Mab40-L11 | Tyr | Tyr | Phe | Thr | Yes | 0.1308 | Yes | 8.950e-010 |
| 12 | Asp | Asp | Tyr | Yes | 0.1358 | No | N/A | |
| 13/22 | Pro | Ala | Yes | 0.1464 | Yes | 2.005e-010 | ||
| 21 | Cys | Yes | 0.1529 | Yes | 8.526e-008 | |||
| 32 | Lys | Yes | 0.2082 | Yes | 1.336e-009 |
The cDNA sequences of the Vh domains from 4 clones were analyzed by alignment with the parental sequence. Amino acid changes in the mutated positions were identified and listed in Table 2. An empty box indicates no changes from the parental sequence. Clones 13 and 22 show same amino acid changes and are listed together in one row. sAg to mAb: Soluble antigen binding to membrane-displayed antibody; RBA, Relative binding ability; sAb to mAg, Soluble antibody binding to membrane-expressed antigen; N/A, not applicable.
Sequences and binding ability of selected clones. Total RNA was isolated from the FCHO single-cell clones and RT-PCR was used to amplify the VH domains for sequence analysis. The results confirmed that they are single clones and represent four different variable domains of the heavy chain. The mutations are listed in Table 2 along with the comparison to the parental sequence. The cDNAs of the VH domains of these four mutants were inserted into vector FV for expression of secreted antibodies. The vectors were stably transfected into FCHO cells and the soluble antibodies were purified. The binding affinities of soluble antibodies to OX40 ligand on cell surface were analyzed by flow cytometry. Three antibodies (clone 13/22, 21 and 32) showed similar binding affinity to OX40 ligand on cell surface as the parental antibody, Mab40-L11, while clone 12 showed no binding activity. The three antibodies with binding activity were tested in a Biacore system to determine their blocking activity and the results are shown in Table 2.. Clone 13/22 shows a blocking activity that is 3.5-fold higher than the parental antibody.
Discussion
A desired characteristic of display systems is the ability to integrate one plasmid per cell, resulting in uniform antibody display with defined specificity. Technology advances have made uniform display possible for both phage and yeast display platforms. Stable transfection of foreign DNA into mammalian cells, however, can often result in multiple integrations in the host cell genome. As previously described in the Results (Fig. 2B), conventional stable transfection results in multiple insertions of the gene and expression levels can vary dramatically between cells. Factors influencing gene expression after gene integration into the host genome include the intrinsic properties of the gene, the flanking sequences surrounding the integration site, and the accessibility of various host cell transcriptional regulatory factors. In the case of library screening, multiple copies of vectors containing different antibody genes could be introduced into a single cell. The multiple integrations and differential levels of expression make it difficult to screen a library and identify antibodies with desired characteristics. The Flp-In™ system provides defined integration at a single site in each host cell genome, leading to relatively equal antibody expression levels between clones. Single integration in each genome allows one to compare cell clones expressing different antibodies. Under well-controlled conditions, the expression and affinity of displayed antibodies on the cell surface will mainly be dependent on the properties of the antibodies to be analyzed.
Lee et al. described a method to display bivalent antibody (Fab)2 fragments on the phage surface to mimic natural immunoglobulin avidity binding.30 In this design, a leucine zipper and part of the hinge region of IgG were used to assemble two copies of monovalent Fabs together, allowing stronger avidity binding. In our mammalian display system, the native assembly machinery of the antibody was utilized to display the full-length antibody, evidenced by detection of both heavy and light chains on the cell surface.
Affinity and expression level are two critical parameters in evaluating the quality of clone candidates in the development of antibody therapeutics. One of the strengths of mammalian display of full-length antibodies is its compatibility with fluorescent-activated cell sorting (FACS) technology. FACS is a powerful tool that allows fine resolution between cell types, providing the ability to separate a heterogeneous suspension of cells into a homogenous fraction of single cells based on fluorescence and light scattering properties.16 Coupled with FACS, the mammalian display platform can directly use CHO cells as the host for screening in a manner similar to a yeast surface display system. Investigators can titrate the antigen concentration as shown in Figure 5, precisely control the concentration of antigen to distinguish antibodies with different affinity and establish a threshold to select antibodies with a desired affinity. We have used Mab40-L11 as the control and chosen a concentration of 100 ng/ml of OX40 ligand in our experiment to identify antibodies with higher RBA. At the same time, investigators can also fix the concentration of anti-light chain or anti-IgG antibody to select for antibodies with higher expression levels, which usually correlates with the level of expression of selected antibodies secreted from the same host cell.
In phage display screening, single and multiple copies of an antibody fragment are displayed on the phage surface while the antigen molecules are fixed either on beads or on plates. This solid phase screening technique greatly enhances antibody-antigen binding because of the avidity effect, favoring phages with multiple display. Codon usage in bacteria is different from mammalian cells and an antibody fragment expressed from bacteria may be toxic to mammalian cells. Therefore, binders selected through the phage display platform may not express in mammalian cells or may not express at the level necessary to meet the requirements as a candidate for further development. Additional optimization of affinity and expression is often required for antibodies generated from phages. This can be time-consuming and the outcome of the optimization is hard to predict. A display system has also been developed in yeast, which makes the maturation of affinity and expression less problematic.12–14 The expression level of the antibody fragments on the yeast cell surface is correlated to the level of the secreted version, but it is still difficult to predict what the expression level will be when the fragments are converted into full-length IgG and expressed from mammalian cell lines used for industrial antibody production.
To monitor affinity and expression level simultaneously, our mammalian display platform applies a double-staining procedure to calculate fluorescent strength of binding (FSB) and fluorescent strength of expression (FSE). Antibodies can have similar affinities while having dramatically different expression levels. When these antibodies are displayed on the cell surface, differences in expression level will affect the signal strength of FSB, but not necessarily affect the binding ability. Double-staining is necessary for calculation of relative binding ability (RBA), a number that reflects more closely the real affinity of the antibody being analyzed. In our mammalian display platform, a specific antigen is used to monitor binding affinity while an anti-light chain antibody is used to monitor expression level. This is because the light chain contains no anchor sequence and can only be detected when it has been correctly assembled with heavy chain on the cell surface. Normalization to the expression level is especially important when there are different numbers of cells of the multiple clones being compared. In the described affinity maturation experiment, the primary screen was conducted as early as 15 days post-single cell seeding into 96-well plates. Because the cell clones are growing at different speeds, there could be a several-fold difference in cell numbers available at the time of analysis. The RBA will more closely reflect the real binding ability of antibodies, and the comparison of RBA will be more accurate for the isolation of antibodies with improved affinity.
Double-staining was also used to distinguish specific antigen/antibody binding from antigen/endogenous receptor binding and from non-specific binding. While the presence of a large number of high-affinity antigen receptors on the cell surface or strong non-specific binding will complicate the screening process, we did not encounter these situations likely due to the use of Flp-In CHO cells or Flp-In 293 cells.
Among the four antibodies identified by this display platform, clone 12 is incapable of binding to the antigen OX40 ligand on the cell surface, suggesting that the conformation of the soluble antigen changes when it is expressed on the cell membrane and parts of the protein may be buried in, or adjacent to the membrane. Therefore, it is entirely possible that the epitopes recognized by newly selected antibodies may be different from the original epitope and may not be accessible in the native conformation.
The results of Biacore analysis of three antibodies (Table 2) showed some inconsistency with that of the mammalian display analysis. Biacore results of clone 13 showed higher affinity, as well as higher blocking activity, compared to that of the mammalian display analysis. For clone 21, the antigen binding ability increased, but the blocking activity dramatically decreased. Different factors may contribute to the inconsistency in these results. First, these two assays examined different properties of the antibodies, with the display system measuring affinity and Biacore measuring blocking activity. Second, the display system mimics the native environment of antibody-antigen binding while the Biacore analysis utilizes purified proteins. It is well established that binding affinity may not always closely correlate with functional activity such as blocking activity. Nevertheless, we have been able to isolate clones from a display library with both higher affinity and higher blocking activity. More importantly, the identification of the antibody clone 13/22 has been achieved by direct single-cycle cell sorting and FACS analysis of less than 50 single cell clones, which is much more efficient than other display systems and demonstrates the power of this system in the screening and selection of candidates for antibody therapeutics.
Higuchi and colleagues have described a similar method to display full-length antibodies on the surface of COS cells by electroporation of vectors containing both heavy and light chain expression cassettes into the host cells.19 Ho et al. have described a system to display single chain anti-CD22 Fv fragments on 293T cells.21 Both groups have successfully screened for clones expressing antibodies with antigen specificity19 or higher affinity.21 Standard transfection or electroporation methods, however, will typically introduce multiple copies of vectors into each cell. It is difficult to control the number of vectors introduced into each cell and, more importantly, the location of the integration into the host cell genome. Multiple copies of vectors and multiple integration sites in the host cell create a time-consuming process for screening and characterization. It also becomes extremely difficult to compare precisely the affinity and expression on the mammalian cell surface and isolate the desired cell clones efficiently. It has been realized that, in both systems mentioned,19,21 the calculated diversity required for selection of clones with better affinity or antigen specificity is about one thousand or less. This relative abundance of the desired populations in a library facilitates the screening in randomly integrated or transiently transfected systems. Beerli et al. has recently reported the use of a sindbis virus expression system to display a ScFv library on BHK cells and isolate antigen specific antibodies. Though the library has a combinatory size of 106, it was constructed based on 230 pre-selected B cell clones.26 The library constructed for this report has a size of 106 with a calculated protein diversity of 1.6 × 10⁵ (204), which is much larger than those previously reported. Antibodies with high affinity and significantly improved neutralizing activity have been identified from this randomly mutagenized library.
The mammalian display system described here is successful in solving the critical issues of single integration and relatively equal expression, making this screening platform a powerful tool in the development of antibody therapeutics. We have presented data on the development of the platform to demonstrate its application in affinity maturation and library screening. The library size we have screened is in the range of one million, complex enough for affinity maturation as shown by the results presented and adequate for the screening of immune libraries.
Materials and Methods
Reagents and cell lines.
Restriction enzymes were purchased from NEB. MMLV, TagDNA polymerase and LipoFectamin 2,000 were purchased from Invitrogen. Antibody reagents were purchased from BD Pharmingen.
293 Cells (ATCC) were maintained in DMEM supplemented with 10% FBS. CHO cells were maintained in DMEM supplemented with 10% FBS and 1× HT. CHO/OX40L cell line was established by stable transfection of OX40L expression vector. pcDNA5-FRT and pOD44 vectors were purchased from Invitrogen. Flp-In CHO (FCHO) and Flp-In 293 (F293) cell lines were purchased from Invitrogen and cultured according to manufacturer's recommendations.
Construction of vectors for antibody expression and display.
Flp-vector (FV, Fig. 1) was constructed by inserting two expression cassettes into pcDNA5-FRT (Invitrogen) for the expression of the secreted version of full-length antibody. For display of antibodies on the surface of mammalian cells, PDGFR transmembrane domain was fused in frame to the c-terminus of IgG constant region in FV vector to form the antibody display vector (FVTM, Fig. 3). Two sets of restriction enzyme cutting sites were introduced into the vector FVTM for the insertion of heavy chain (HindIII and BamHI) and light chain (ClaI and XhoI). The variable domains of selected antibody genes were amplified by PCR and inserted into the vector FV or FVTM accordingly as required in the experiments.
Establishment of cell lines stably expressing secreted and displayed antibodies.
Flp-In CHO cells were cultured and co-transfected with FV plus pOG44 or FVTM plus pOG44 at a ratio of 1:9 using LipoFectamin 2,000 following instructions described in the manual (Invitrogen). Transfected cells were cultured in growth medium containing Hygromycin (500 mg/ml). Single cell clones were picked and expanded for analysis.
For analysis of secreted antibody, 106 cells were seeded in each well of a 6-well plate and cultured in growth medium. The medium was replaced with serum-free medium 24-hrs post-transfection. After another 24 hour culture, serum-free condition medium (CM) was collected and 20 µl of the CM from each clone were tested by western blotting.
Fluorescent labeling of mammalian cells displaying antibodies or expressing specific antigens.
To analyze antibodies displayed or antigens expressed on the cell surface, transiently or stably transfected cells were collected and suspended in wash buffer (PBS containing 2% of FBS) at a density of 1–5 × 10⁶ cells per 100 µl of buffer. After addition of fluorescent-conjugated specific antigen or antibodies against human IgG or light chain constant regions as mentioned in the experiments, the cell suspensions were incubated on ice for 30 minutes and the cells were washed twice with wash buffer. The staining procedure was repeated as needed for a second or even a third staining. The stained cells were finally re-suspended in wash buffer at a density of 1–5 × 10⁶ cells per ml for flow cytometric analysis or cell sorting. The antigens used in this report were chosen according to the antibody specificity.
Flow cytometric analysis and sorting.
Labeled mammalian cells were analyzed on a flow cytometer and the cell flow rate was adjusted to be between 500–10,000 cells/sec. The cell population was gated by size scatter to analyze only the single cell population and typically the data for 10,000 events were collected. For cell sorting, the gate conditions were first set up using non-transfected parent cells and positive control cells. Only the cells that met pre-set conditions were bulk sorted or single cell sorted as needed.
Quantitative analysis of expression level and binding activity of surface-displayed antibodies.
The binding activity of expressed antibody on the cell surface was analyzed by flow cytometry. The relative expression level was calculated as the fluorescent strength of expression (FSE) by the following formula:
FSE = % of light chain (or heavy chain) positive cells × Mean of florescent strength of expression signal.
The reactive binding activity was calculated as the fluorescent strength of binding (FSB) by the following formula:
FSB = % of specific antigen binding cells × Mean of fluorescent strength of binding signal.
The relative binding ability (RBA) of a specific antibody was normalized by its expression on the cell surface and calculated by the following formula:
Mutagenesis of variable domain of heavy chain and construction of mutant library.
To mutagenize heavy chains, trinucleotide sequence NNS was incorporated into primers at the corresponding codons for mutation. After primary PCR amplification to incorporate the mutations into the designated locations, secondary sequence overlap extension PCR was carried out to form the full-length heavy chain containing HindIII at the 5′-end and BamHI at the 3′-end as illustrated in Figure 7. After digestion, the HindIII-BamHI fragments of the mutant library were inserted into the antibody display vector containing parental light chain. Then, the mutant plasmid library was transformed into DH10B cells by electroporation and 106 bacteria transformants were collected as the bacteria library.
The plasmid DNA was isolated from the bacteria library and 1 mg of library DNA was transfected into 3 × 10⁸ FCHO cells in ten T172 flasks by LipFectamin-2000 as instructed by the manual. A stable selected FCHO cell pool was used in the analysis of the antibody display and affinity screen.
Conversion of displayed antibodies to secretion antibodies.
Total RNA was isolated from individual cell populations selected by single cell sorting. First-strand cDNA of Vh domain was synthesized from total RNA by MMLV (Invitrogen) as instructed. The fragments of Vh were then PCR amplified. The primers used for the first-strand synthesis and PCR amplification are 5′-CAG CAG AAG CTT CTA GAC CAC CAT GGA CAT GAG GGT GCC CGC TCA GCT CCT GGG-3′ (forward primer) and 5′-CTG AGT TCC ACG ACA CC-3′ (reverse primer). After sequence confirmation, the genes of variable domains were inserted into vector FV and encoded antibody genes were expressed as the soluble type of antibodies.
Acknowledgements
We would like to acknowledge Drs. Frank Martin, Richard Zhang, Jie Tang, Qiang Liu, Yan Wang, Mr. Timothy Yu and Mr. Jared Higabe, from Amgen, and Karen M. Page, from Merck, for critical reading of the manuscript and Ms. Laura Chiu for performing the FACS sorting. We also like to thank Mr. Kevin Graham, Ms. Ling Liu and Ms. Taruna Arora for technical assistance and discussions.
Abbreviations
- CDR
complementary determinant region
- CMV
cytomegalovirus
- DMEM
Dulbecco's modification of Eagle's medium Dulbecco
- ELISA
enzyme-linked immunosorbent assay
- Fab
fragment of antigen-binding
- FACS
fluorescence activated cell sorting
- Fc
fragment crystalizable
- FDA
food and drug administration
- FITC
fluorescein isothiocyanate
- FRT
flp recombination target
- FSB
fluorescence strength of binding
- FSE
fluorescence strength of expression
- IgG
immunoglobulin G
- mAbs
monoclonal antibodies
- PBMC
peripheral blood mononuclear cell
- PDGFR
platelet derived growth factor receptor
- PE
phycoerythrin
- RBA
relative binding ability
- RT-PCR
reverse transcription-polymerase chain reaction
- scFv
single-chain Fv antibody fragments
- TM
trans-membrane domain
Footnotes
Previously published online: www.landesbioscience.com/journals/mabs/article/12970
Financial Support
This research was supported by funding from an Amgen research grant.
References
- 1.Aires DSF, Corte-Real S, Goncalves J. Recombinant antibodies as therapeutic agents: pathways for modeling new biodrugs. BioDrugs. 2008;22:301–314. doi: 10.2165/00063030-200822050-00003. [DOI] [PubMed] [Google Scholar]
- 2.Reichert JM, Rosensweig CJ, Faden LB, Dewitz MC. Monoclonal antibody successes in the clinic. Nat Biotechnol. 2005;23:1073–1078. doi: 10.1038/nbt0905-1073. [DOI] [PubMed] [Google Scholar]
- 3.Smith GP. Filamentous fusion phage: novel expression vectors that display cloned antigens on the virion surface. Science. 1985;228:1315–1317. doi: 10.1126/science.4001944. [DOI] [PubMed] [Google Scholar]
- 4.Winter G, Griffiths AD, Hawkins RE, Hoogenboom HR. Making antibodies by phage display. Annu Rev Immunol. 1994;12:433–455. doi: 10.1146/annurev.iy.12.040194.002245. [DOI] [PubMed] [Google Scholar]
- 5.Low NM, Holliger P, Winter G. Mimicking somatic hypermutation: Affinity maturation of antibodies displayed on bacteriophage using a bacterial mutator strain. J Mol Biol. 1996;260:359–368. doi: 10.1006/jmbi.1996.0406. [DOI] [PubMed] [Google Scholar]
- 6.de Haard HJ, van Neer N, Reurs A, Hufton SE, Roovers RC, Henderikx P, et al. A large non-immunized human Fab fragment phage library that permits rapid isolation and kinetic analysis of high affinity antibodies. J Bio Chem. 1999;274:18218–18230. doi: 10.1074/jbc.274.26.18218. [DOI] [PubMed] [Google Scholar]
- 7.de Bruin R, Spelt K, Mol J, Koes R, Quattrocchio F. Selection of high-affinity phage antibodies from phage display libraries. Nat Biotechnol. 1999;17:397–399. doi: 10.1038/7959. [DOI] [PubMed] [Google Scholar]
- 8.Chowdhury PS, Pastan I. Improving antibody affinity by mimicking somatic hypermutation in vitro. Nat Biotechnol. 1999;17:568–572. doi: 10.1038/9872. [DOI] [PubMed] [Google Scholar]
- 9.Francisco JA, Earhart CF, Georgiou G. Transport and anchoring of 6-lactamase to the external surface of Escherichia coli. P Natl Acad Sci USA. 1992;89:2713–2717. doi: 10.1073/pnas.89.7.2713. [DOI] [PMC free article] [PubMed] [Google Scholar]
- 10.Francisco JA, Campbell R, Iverson BL, Georgiou D. Production and fluorescence-activated cell sorting of Escherichia coli expressing a functional antibody fragment on the external surface. P Natl Acad Sci USA. 1993;90:10444–10448. doi: 10.1073/pnas.90.22.10444. [DOI] [PMC free article] [PubMed] [Google Scholar]
- 11.Georgiou G, Stathopoulos C, Daugherty PS, Nayak AR, Iverson BL, Ill RC. Display of heterologous proteins on the surface of microorganisms: From the screening of combinatorial libraries to live recombinant vaccines. Nat Biotechnol. 1997;15:29–34. doi: 10.1038/nbt0197-29. [DOI] [PubMed] [Google Scholar]
- 12.Boder ET, Wittrup KD. Yeast surface display for screening combinatorial polypeptide libraries. Nat Biotechnol. 1997;15:553–557. doi: 10.1038/nbt0697-553. [DOI] [PubMed] [Google Scholar]
- 13.Boder ET, Wittrup KD. Yeast surface display for directed evolution of protein expression, affinity and stability. Methods Enzymol. 2000;328:430–444. doi: 10.1016/s0076-6879(00)28410-3. [DOI] [PubMed] [Google Scholar]
- 14.Boder ET, Midelfort KS, Wittrup KD. Directed evolution of antibody fragments with monovalent femtomolar antigen-binding affinity. P Natl Acad Sci USA. 2000;97:10701–10705. doi: 10.1073/pnas.170297297. [DOI] [PMC free article] [PubMed] [Google Scholar]
- 15.Feldhaus MJ, Siegel RW, Opresko LK, Coleman LR, Feldhaus JMW, Yeung YA, et al. Flow-cytometric isolation of human antibodies from a nonimmune Saccharomyses cerevisiae surface display library. Nat Biotechnol. 2003;21:163–170. doi: 10.1038/nbt785. [DOI] [PubMed] [Google Scholar]
- 16.Feldhaus MJ, Siegel RW. Yeast display of antibody fragments: a discovery and characterization platform. J Immuno Methods. 2004;290:69–80. doi: 10.1016/j.jim.2004.04.009. [DOI] [PubMed] [Google Scholar]
- 17.Chiba Y, Suzuki M, Yoshida S, Yoshida A, Ikenaga H, Takeuchi M, et al. Production of human compatible high mannose-type (Man5GlcNAc2) sugar chains in Saccharomyces cerevisiae. J Biol Chem. 1998;273:26298–26304. doi: 10.1074/jbc.273.41.26298. [DOI] [PubMed] [Google Scholar]
- 18.Hoogenboon HR. Selecting and screening recombinant antibody libraries. Nat Biotechnol. 2005;23:1105–1116. doi: 10.1038/nbt1126. [DOI] [PubMed] [Google Scholar]
- 19.Higuchi K, Araki T, Matsuzaki O, Sato A, Kanno K, Kitaguchi N, et al. Cell display library for gene cloning of variable regions of human antibodies to haptitis B surface antigen. J Immunol Methods. 1997;202:193–204. doi: 10.1016/s0022-1759(97)00010-0. [DOI] [PubMed] [Google Scholar]
- 20.Cumbers SJ, Williams GT, Davies SL, Grenfell RL, Takeda S, Batista FD, et al. Generation and iterative affinity maturation of antibodies in vitro using hypermutating B-cell lines. Nat Biotechnol. 2002;20:1129–1134. doi: 10.1038/nbt752. [DOI] [PubMed] [Google Scholar]
- 21.Ho M, Nagata S, Pastan I. Isolation of anti-CD22 Fv with high affinity by Fv display on human cells. P Natl Acad Sci USA. 2006;102:9637–9642. doi: 10.1073/pnas.0603653103. [DOI] [PMC free article] [PubMed] [Google Scholar]
- 22.Urban JH, Schneider RM, Compe M, Finger C, Cichutek K, Alvarez-Vallina L, et al. Selection of functional human antibodies from retroviral display libraries. Nucleic Acids Res. 2005:33–35. doi: 10.1093/nar/gni033. [DOI] [PMC free article] [PubMed] [Google Scholar]
- 23.Wolkowicz R, Jager GC, Nolan GP. A random peptide library fused to CCR5 for selection of mimetopes expressed on the mammalian cell surface via retroviral vectors. J Biol Chem. 2005;280:15195–15201. doi: 10.1074/jbc.M500254200. [DOI] [PubMed] [Google Scholar]
- 24.Zauderer M, Smith ES. In vitro methods of producing and identifying immunoglobulin molecules in eukaryotic cells. US patent application 2002-0123057A1.
- 25.Akamatsu Y, Pakabunto K, Xu Z, Zhang Y, Tsurushia N. Whole IgG surface display on mammalian cells: Application to isolation of neutralizing chicken monoclonal anti-IL-12 antibodies. J Immuno Methods. 2007;327:40–52. doi: 10.1016/j.jim.2007.07.007. [DOI] [PubMed] [Google Scholar]
- 26.Beerli RR, Bauer M, Buser RB, Gwerder M, Muntwiler S, Maurer P, et al. Isolation of human monoclonal antibodies by mammalian cell display. P Natl Acad Sci USA. 2008;105:14336–14341. doi: 10.1073/pnas.0805942105. [DOI] [PMC free article] [PubMed] [Google Scholar]
- 27.Andersen DC, Reilly DE. Production technologies for monoclonal antibodies and their fragments. Curr Opin Biotechnol. 2004;15:456–462. doi: 10.1016/j.copbio.2004.08.002. [DOI] [PubMed] [Google Scholar]
- 28.Invitrogen, author. Invitrogen Instruction Manual. Carlsbad CA: Invitrogen; 2001. Flp-In system for generating stable mammalian expression cell lines by Flp recombinase-mediated integration. [Google Scholar]
- 29.MacCallum RM, Martin ACR, Thornton JM. Antibody-antigen interactions: contact analysis and binding site topography. J Mol Biol. 1996;262:732–745. doi: 10.1006/jmbi.1996.0548. [DOI] [PubMed] [Google Scholar]
- 30.Lee CV, Sidhu SS, Fuh G. Bivalent antibody phage display mimics natural immunoglobulin. J Immuno Methods. 2004;284:119–132. doi: 10.1016/j.jim.2003.11.001. [DOI] [PubMed] [Google Scholar]