

Abstract
The incidence of cardiovascular diseases is ten-times higher in males than females, although the biological basis for this gender disparity is not known. However, based on the fact that antiplatelet drugs are the mainstay for prevention and therapy, we hypothesized that the signaling proteomes in platelets from normal male donors might be more activated than platelets from normal female donors. We report here that platelets from male donors express significantly higher levels of signaling cascade proteins than platelets from female donors. In silico connectivity analysis shows that the 24 major hubs in platelets from male donors focus on pathways associated with megakaryocytic expansion and platelet activation. By contrast, the 11 major hubs in platelets from female donors were found to be either negative or neutral for platelet-relevant processes. The difference may suggest a biological mechanism for gender discrimination in cardiovascular disease.
1. Introduction
Cardiovascular diseases (CVD) are the leading causes of death for men and women in the United States, and activated platelets have been considered central to the underlying pathophysiology of these disorders [1–7]. For example, high levels of intrinsically activated platelets are generally found to circulate in patients with well-known risk factors for many types of CVD. These include hypercholesterolemia [8, 9] diabetes [10–12], acute ischemic stroke [13, 14], hypertension [15, 16], acute myocardial infarct, preeclampsia and renal artery stenosis [17], and metabolic syndrome [18]. One practical consequence is that antiplatelet drugs, and their individual protein receptors, have assumed center-stage for prevention and therapy of most types of CVD.
One enduring mechanistic mystery, however, has been the fact that the incidence and outcomes of cardiovascular diseases are profoundly dependent upon gender [19]. Epidemiologically, women fare better, by approximately ten years, than men in terms of age of onset, morbidity, and mortality. However, considering the importance of antiplatelet drugs for CVD, we have hypothesized that gender-specific platelet signaling mechanisms might contribute to outcome disparities. We have tested this hypothesis by studying the platelet signaling proteome in platelets from male and female donors. The donors were in the age range of 18–50, so that the anticipated gender disparity could be directly examined.
In this paper, we report that a subset of the low-abundance platelet signaling proteome, as assayed on quantitative, large-scale antibody microarrays [20, 21], is gender-specific. Operationally, platelets from male donors express a significantly higher levels of proteins associated with signal transduction and intracellular signaling cascades than platelets from female donors. By contrast, using conventional 2D gel electrophoresis and mass spectrometry, we find that the high-abundance proteome of structural proteins and enzymes is mostly gender-invariant. To qualify the microarray data, we also performed semiquantitative western blot analysis on some proteins which did (or did not) discriminate on the basis of gender. We suggest that this discovery of the gender-specificity for the platelet signaling proteome may contribute to understanding the biological basis for the well-documented gender discrimination in cardiovascular disease.
2. Methods
2.1. Platelet Preparation
Blood was donated by healthy adult volunteers (ages 18–50) in accordance with a signed consent form, and a human use protocol approved by the Walter Reed Army Medical Center Institutional Review Board. Blood was collected using a 21-gauge butterfly needle into vacutainer tubes containing Acid Citrate-Dextrose as the anticoagulant. Prostacyclin (Sigma-Aldrich, St. Louis, MO) was immediately added to the whole blood to a final concentration of 50 ng/mL. The prostacyclin stock solution was 50 ug/mL in 50 mM Tris, 100 mM NaCl, pH 12, and stored at −80°C until use. Prostacyclin increases cAMP in platelets, thus suppressing activation by inhibiting platelet aggregation and promoting disaggregation [22]. The blood was then centrifuged at 400 × g for 15 minutes at 23°C to pellet the erythrocytes and leukocytes. The platelet-rich plasma (PRP) was then removed and prostacyclin again added to the PRP. The PRP was then centrifuged at 1800 × g for 20 minutes at 23°C to pellet the platelets. The plasma was removed and the platelets were then gently resuspended in 2 mL Tyrodes buffer (10 mM HEPES, 0.4 mM NaH2PO4, 137 mM NaCl, 5.5 mM glucose, 2.8 mM KCl 1 mM MgCl, 12 mM NaHCO3). The platelets were then centrifuged a second time, as before. The buffer was removed and the pellet of purified platelets was then frozen in liquid nitrogen and stored at −80°C until analyzed. Cell sorting analysis of the final platelet products indicated a routine purity of >99%.
2.2. Light and Electron Microscopy
Platelet-rich plasma (PRP) was prepared as described as above, and mixed with one volume of 0.5 M cacodylate buffer containing 0.5% glutaraldehyde fixative [23]. Following incubation for 30 minutes at room temperature, the platelets were centrifuged at 800 RCF for 10 minutes. The supernatant was removed and cacodylate buffer containing 2.5% glutaraldehyde was added to further fix the platelets. After 10 minutes, centrifugation was repeated and a fresh 2.5% glutaraldehyde solution in cacodylate buffer was added. Fixed platelets were then centrifuged as above, and the pellet processed routinely by osmication with 2% osmium tetroxide, dehydration by graded ethanols, and embedding in araldite. Some samples were embedded in L.R. White medium for immuno-electron microscopy. Occasional sections were stained with toluidine blue and imaged by light microscopy (1000×). No evidence of leukocyte contamination was ever observed by either light or electron microscopy. Further details and representative baseline data are given in Supplemental Figure 1 in supplemental material available online at doi:10.4061/2010/164906.
2.3. Identification of Proteins by 2D Gel Electrophoresis and Mass Spectrometry
Following 2D gel electrophoresis as previously described [24, 25], in-gel digestion of isolated protein spots was performed as follows: protein features or “spots” were punched with different sized cannulae from silver stained 2D gels (pI 4–7). The spots were selected on the basis that their relative staining intensity revealed a gender difference in protein abundance. Frequently, 2–4 spots were pooled from different gels, especially for the lower density proteins. A protein-free gel piece and a known protein spot were treated in parallel as negative and positive controls, respectively. Gel pieces were processed with the Gel Digest96 Kit (Millipore, Bedford, MA). Gel pieces were destained with 100 μL of a freshly made solution of 15 mM potassium ferricyanide and 50 mM sodium thiosulphate. Following destaining, the gel pieces were dehydrated in 100 μL 100% acetonitrile. The dried gel pieces were rehydrated in 50 μL of 50 mM ammonium bicarbonate containing 150 ng trypsin (Sequencing grade, Promega, Madison,WI). After digestion for 4 hours at 37°C or overnight at 30°C, the gel pieces were extracted twice with 50 μL of 50% acetonitrile containing 0.1% trifluoroacetic acid. The combined extraction solution was concentrated to 5 μL in a SpeedVac.
For peptide mass fingerprinting by mass spectrometry, the peptide mixture was purified with an in-tip reversed-phase column (C18 Zip-Tip; Millipore Corp., Bedford, MA) to remove salts and impurities. Routinely, peptides were analyzed by MALDI-TOF technology, as follows: the peptide mixture was mixed with 1 μL of matrix solution (8 mg/mL α-cyano-4-hydroxycinnamic acid in 50% ACN/0.1%TFA) and spotted onto a MALDI target plate. Analysis was performed using a MALDI-TOF mass spectrometer (Voyager DE-STR; Applied Biosystems, Framingham, MA) equipped with a 337 nm nitrogen laser. Samples were analyzed in reflectron mode by time-of-flight at an accelerating potential 20 KV. Mass spectra were recorded and then processed using the Applied Biosystems Data Explorer Version 4.0.0.0 software to include: calibration using external standards of bradykinin (monoisotopic (M + H value = 1060.56) and adrenocorticotropic hormone (ACTH), clip 18–39 (monoisotopic (M + H) value = 2465.20), baseline correction, noise filtering (correlation factor 0.7), deisotoping, setting of baseline intensity (peaks intensities >3 times background), and peak gathering. Lists of monoisotopic peptide mass ions were then submitted to ProteinPropector MS-Fit (version 4.27.2 basic; http://prospector.ucsf.edu/) for searching against the current versions of the Swiss Prot (20071010) and NCBInr (20071010) data bases. Allowed mass tolerance was set a 50 ppm, or less. Unmatched peptides, amino acid modifications, or peptides with missed cleavages were not considered.
Additional components contributing to an identification included: (i) visual inspection of all spectra to ensure that peptide ions contributing to a protein identification had an appropriate signal-to-noise ratio (>3 : 1) and at least one 13C isotopic form and (ii) performance of separate confirmatory experiments using independent samples (n = up to 3). While in some cases a MOWSE score for a given protein identification was low, the identifying peptide ions were readily detected and consistently observed in confirmatory experiments.
2.4. Bioinformatics for Analysis of 2DGE Data
2DGE data were analyzed by ProGenesis software (Nonlinear USA, Durham, NC.), as previously described [24, 25]. Briefly, the software identified equivalent spots on gels for platelets from all 16 donors. Each spot on each gel was then normalized to the total spot density on that gel, and the densities of each spot corrected by fitting all spots to a log-normal distribution. All data for each spot on all male and all female platelet gels, respectively, were then averaged and the two datasets were compared for significant difference by t-test. Further analytic details are as described [24, 25].
2.5. Fluorescent Labeling of Platelet Proteins
Platelet proteins were labeled reciprocally with either Cy3 or Cy5 on the basis of “per mg of protein”, as described [20]. Labeled proteins were separated on a PD10 column to remove unreacted dyes. Equal volumes of labeled platelet proteins were mixed for multiplex analysis on the microarrays. In each case, a platelet sample from a male donor was compared with a platelet sample from a female donor. Dye swapping was performed in order to label each platelet sample with both Cy3 and Cy5, and to correct for labeling efficiency of each dye. Following incubation, and washing, the dried slides were imaged on a GenePix 4000 B (Axon Instruments) fluorescence scanner. The data were then exported off line for analysis.
2.6. Antibody Microarrays
The antibody microarrays used in these experiments were obtained from Clontech (Mountain View, CA), and were printed according to our quality control specifications. The list of antibodies used in the microarray is available on the Clontech(R) website: http://bioinfo.clontech.com/abinfo/initialize.do#, using Catalog no. 631790 and Lot no. 5100723. The arrays were otherwise handled exactly as recommended by the manufacturer. Each microarray has exactly 507 features, printed in duplicate. However, over the course of this experiment, two lots were employed in which a few antibodies were replaced with others. The result was that we were able to analyze a total of 573 individual proteins in all 16 platelet preparations. In conclusion, each protein on each array, as provided by platelets from individual donor, was interrogated 8 independent times, with 24 replicate measurements.
2.7. Bioinformatics for Analysis of Antibody Microarrays
Antibody microarrays were analyzed as described [20, 21]. Briefly, each array was exposed to platelets from male and female donors, where one gender was labeled with Cy3 and the other with Cy5. A second array was run in parallel in which the labels switched to either Cy5 or Cy3, respectively. The data were then averaged to yield gender-specific differences. Traditionally, this strategy corrects for the possibility of different proteins being labeled selectively by either dye. Thereafter, (i) after the steps of sample processing, fluorescent labeling of proteins, and binding to antibody microarrays, images were read and the intensity values for each array location were tabulated in silico. (ii) Data for each array were normalized by dividing by the median of the values for the specific array and specific wavelength. (iii) Significance analysis (t-test) was used to determine whether a specific protein was differentially expressed in the male platelets versus female platelets. This analysis resulted in a “top candidate” list for further validation. To compare the absolute levels, we calculated the absolute protein level ratios using the manufacturer's protocol (the “square-root” method). These ratios were tightly scattered around the average ratio R = 1.4, with a coefficient of variation (CoV) of ~13% (SEM/R = 7%). We then used this value of R as an estimate of the ratio of medians of the two samples.
In addition, we calculated for each protein, using the respective averages and SDs, the sample size needed to determine at 80% power if there were a significant difference between the groups. Wilcoxon Rank Order Non-Parametric Methods were subsequently employed for identifying the candidate proteomic signature. (iv) The Significance Analysis of Microarrays algorithm application (SAM, [26] http://www.stat.stanford.edu/~tibs/SAM;) was used for calculating False Discovery Rates (FDR), and to estimate the Local False Discovery Rate for each of the proteins. A Local False Discover Rate of <10% was taken as a cutoff of significance; (v) Cluster analysis with hierarchical cluster analysis software (http://rana.lbl.gov/eisen/software) was used to find groupings of “similar expression” for both proteins and genders [27, 28]. (vi) Network analysis of direct interactions and associated tables of network statistics were created with Metacore Version 4.7 (GeneGo, St. Joseph, MI) from gender-specific lists of proteins. The direct interaction algorithm creates a network only from the objects in the original list using curated links in the database. The tables of network statistics are based upon the objects displayed in the network. A hub is defined as an object with 5 or more links on the network; objects with fewer connections are nodes.
Finally, (vii) classical ROC (Receiver Operating Characteristic) curves, were calculated, and respective AUC's (Area under the curve) were calculated for each protein in the two cohorts. An AUC equal to 1 shows complete separation of the distributions in the two cohorts. Thus, all the values in one cohort are above the cutoff, while all the values in the second cohort are below that cutoff. In order to plot the ROC curves we assumed that the measured replicates for each individual were normally distributed around the respective true level, of the given protein, with a width estimated by the standard deviation of the measured replicas. Thus, for each cutoff level the % false Positives and % False Negatives were calculated by integrating the tail of the normal distribution in the respective direction. This approach actually estimates the chance of measuring a False Positive (or False Negative) given the average and SD of the measurement for that given cutoff. The AUC values were then calculated by integrating the ROC curve. Further information and a summary of results are given in Supplemental Table 10. ROC graphs are shown in Supplemental Figure 4.
2.8. Western Blot Analysis
These assays were performed by standard methods, using chemiluminescence detection. For data in Figure 3, individual platelet samples were assayed, and averages and SEM's calculated in silico.
Figure 3.

Qualification of quantitative Antibody Microarray data with semiquantitative Western blot analysis of selected proteins in platelets from male and female donors. (a) Western blot analysis of selected proteins in platelets from male and female donors. Each sample is the average of 3–5 independent determinations (*P ≤ .05, **P ≤ .02 and ***P ≤ .001). (b) Correlation between Western blot data in 〈a〉 and cognate antibody microarray intensities.
3. Results
3.1. Prostacyclin Treatment of Blood Sample Prevents Platelet Activation
Platelets are known to secrete large numbers of internal proteins when they are activated. Therefore, to ensure that the platelets chosen for proteomic analysis were maintained in an unactivated state, we routinely added prostacyclin (50 nM) to the blood samples within seconds after collection (see Methods). Supplemental Figure 1 shows representative optical and electron microscopy data for male and female platelets. At the light microscopy level, platelets from male donors (Supplemental Figure 1b) and female donors (Supplemental Figure 1d) appear as classically resting “face-on” flat discoids or “edge-on” fusiform structures. At the electron microscopic level, both the platelets from male donors (Supplemental Figure 1a) and female donors (Supplemental Figure 1c) are shown in the “face-on” view as smoothly spherical bodies with uniformly distributed internal subcellular organelles. During the course of this study, platelet preparations were randomly checked by this direct measure of activation. As anticipated, platelets prepared without added prostacyclin were often characterized by acanthocytic membrane protroberances, large-scale aggregation, centralization of organelles, and massively dilated internal canalicular systems.
3.2. A Small Fraction of the High-Abundance Platelet Proteome Is Gender-Dependent
As shown in Supplemental Figure 2, discovery studies with 2D-Gel Electrophoresis (2DGE) and mass spectrometry revealed at least 2800 silver-stained proteins. Of the detectable proteins, only 20 (or ca. 0.7% of the total) had relative expressions that were significantly gender-specific. The fold differences and P-values for significance are summarized in Supplemental Table 1. Of the 20 candidate features, only 12 could be detected by eye. We therefore punched only these 12 for identification by mass spectrometry. However, of these 12, only six yielded significant identifications. Two of these spots (no. 1101 and no. 1583) had two significantly identifiable proteins. Thus, we were able to identify eight proteins in total from the 2D gels. These eight proteins are listed in Supplemental Table 2. Relevantly, one of these proteins, GNA11, is a G-q class G-protein associated with response to thrombopoeitin (TPO). These data indicate that most high abundance proteins in human platelets occur in equivalent amounts in both male and female donors. However, the few high abundance proteins that do discriminate on the basis of gender seem to be at the limit of conventional detection and identification.
3.3. Low-Abundance Signaling Proteins in Platelets Can Be Identified Using an Antibody Microarray Platform
As shown in Figure 1, low-abundance platelet proteins from male or female donors, undetectable on the 2D gel platform and labeled with either Cy3 or Cy5, can be multiplexed for quantitative analysis on the microarray platform. We noted that of 576 informative proteins, 442 (ca. 75%) proteins had standard errors of the mean (SEM) of 20% or less, while the remaining 25% had sharply divergent values. These data are shown in Supplemental Figure 3, in which the analysis of variance was calculated for the first set of eight patients (Supplemental Figure 3a), and then for the aggregate of the first eight and the second eight sets of patients (Supplemental Figure 3b). There is virtually no difference, in spite of a two-month separation in the collection and analysis of the two sets of platelet samples. We also noted a close correlation of SEM's for individual proteins when comparing male and female samples. For the subsequent bioinformatics analyses, we therefore decided to concentrate our attention on the ca. 75% of the proteins in the low SEM class. As for the group of proteins with the highest SEM's, we concluded that this group might just reflect idiosyncratic differences among the donors.
Figure 1.
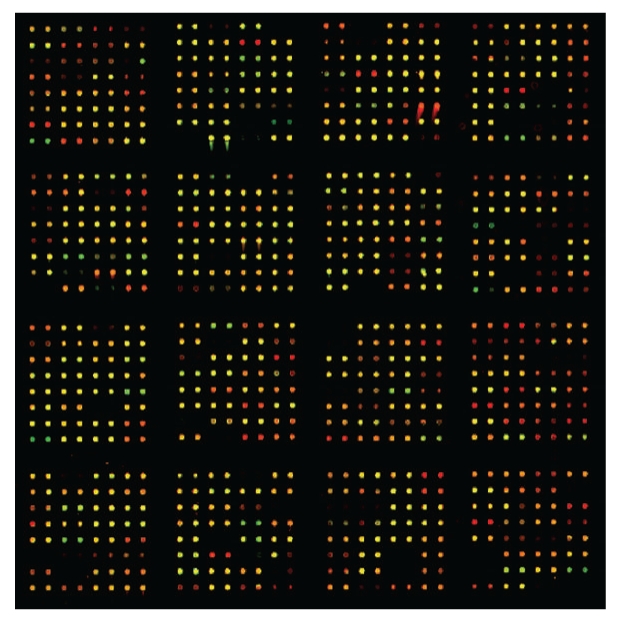
Platelet proteins from male and female donors analyzed on an antibody microarray platform. Equal amounts of platelet proteins were labeled with either Cy3 or Cy5, and incubated with the antibody microarray as described in the Methods section. Net green or net red spots indicate differences according to gender. Yellow spots indicate equivalent amounts of bound antigen.
3.4. Relative Rank Order Analysis of Low-Abundance Proteome Distinguishes and Identifies Proteins That Are Most Differentially Expressed by Gender
Figure 2 shows a series of graphical comparisons between low-abundance platelet proteomes from male and female donors. Figure 2(a) compares the average rank order for all eight males with the average individual rank orders by gender. The data indicate that the proteins expressed by platelets individually from all eight males are very similar to their aggregate male averages. Figure 2(b) performs the same individual comparison for all eight female donors with the average individual rank orders by gender. The data indicate that the proteins expressed by platelets from all eight female donors are very similar to their aggregate female average. However, the rank order for protein expression in platelets from female donors is poorly correlated with male expression levels. Thus the low-abundance platelet proteome, as defined by the antibody microarray, is strongly gender-specific.
Figure 2.

Antibody microarray analysis of platelets from normal adult male and female donors. (a) Average rank by gender versus average of all males. Blue circles are proteins from male donors. Red circles are proteins from female donors. (b) Average rank by gender versus average of all females. Blue circles are proteins from male donors. Red circles are proteins from female donors.
We further increased the statistical stringency of our gender-specific discrimination using the Statistical Analysis of Microarrays (SAM) algorithm (20). The conditions we imposed on the SAM calculations included 2000 permutations, a local False Discovery Rate (FDR) <10%, and a q-statistic <0.05. Of 573 total proteins analyzed, 161 (viz, 28%) were found to satisfy this degree of stringency. Table 1 shows the top 15 proteins in this highly stringent and significant gender difference. These proteins are ranked by t-test, starting with c-MYC. In this instance, the t-test is 3.5 × 10⁻²⁰. The far right-hand columns in Table 1 show that c-MYC ranks ca. 91% in females versus only ca. 25% in males. The entire dataset is shown in Supplemental Table 3, and is arbitrarily truncated when the “Δ Rank” value reaches 20%. Thus even with the most stringent statistical criteria available, the low-abundance signaling proteome in platelets can be distinguished on the basis of gender.
Table 1.
Top 15 low-abundance proteins with highly stringent significant differences on the basis of gender.
| ID | t-test | Gen⋆ code | HUGO | RANK | ||
|---|---|---|---|---|---|---|
| Females | Males | Delta | ||||
| v-myc myelocytomatosis viral oncogene homolog avian | 3E − 20 | −1 | MYC | 91 ± 2% | 25 ± 2% | 66% |
| Ras-related C3 botulinum toxin substrate 1 rho family, small GTP binding protein Rac1 | 8E − 15 | 1 | RAC1 | 37 ± 2% | 83 ± 3% | 46% |
| polymerase DNA directed, epsilon | 1E − 14 | −1 | DPOE1 | 60 ± 1% | 14 ± 1% | 47% |
| proteasome prosome, macropain 26S subunit, ATPase, 5 | 2E − 14 | −1 | PSMC5 | 90 ± 2% | 27 ± 1% | 63% |
| synapsin II | 3E − 14 | −1 | SYN2 | 94 ± 1% | 34 ± 2% | 60% |
| synaptotagmin I | 4E − 14 | −1 | SYT1 | 88 ± 1% | 33 ± 2% | 55% |
| A kinase PRKA anchor protein yotiao 9 | 2E − 13 | 1 | AKAP9 | 41 ± 3% | 86 ± 3% | 45% |
| phosphatidylinositol 4-kinase, catalytic, beta polypeptide | 1E − 12 | −1 | PIK4CB | 86 ± 1% | 38 ± 2% | 48% |
| protein tyrosine phosphatase, non-receptor type 11 Noonan syndrome 1 | 3E − 12 | −1 | PTPN11 | 82 ± 3% | 28 ± 1% | 55% |
| A kinase PRKA anchor protein gravin 12 | 5E − 11 | 1 | AKAP12 | 32 ± 1% | 83 ± 3% | 52% |
| RAB5A, member RAS oncogene family | 1E − 10 | −1 | RAB5A | 86 ± 2% | 59 ± 2% | 27% |
| lymphocyte cytosolic protein 2 SH2 domain containing leukocyte protein of 76 kDa | 1E − 10 | −1 | LCP2 | 79 ± 4% | 38 ± 4% | 41% |
| amphiphysin Stiff-Man syndrome with breast cancer 128 kDa autoantigen | 1E − 09 | −1 | AMPH | 89 ± 4% | 48 ± 4% | 41% |
| TRAF family member-associated NFκB activator | 2E − 09 | −1 | TANK | 55 ± 2% | 36 ± 2% | 18% |
| solute carrier family 9 sodium/hydrogen exchanger, isoform 3 regulatory factor 1 | 4E − 09 | 1 | NHERF-1 | 32 ± 2% | 75 ± 5% | 43% |
| leukocyte-associated Ig-like receptor 1 | 5E − 09 | −1 | LAIR1 | 60 ± 2% | 40 ± 2% | 20% |
⋆ (−1) = female; (+1) = male
3.5. Gender-Specific Rank Order Analysis Can Distinguish Proteomic Signatures in Platelets
Table 2 shows the top 15 proteins present in platelets from male donors which are also in the list of proteins differentially expressed as a function of gender. In this case we have included a few proteins for which the local FDR is slightly more than 10%. For example, the highest ranked protein in males is general transcription factor II,I (GTF2I), ranked at ca. 96.5%. This compares with only ca. 44.8% in platelets from female donors. Second on the list is Mdm2 (MDM2), a p53 binding protein. The third is phospholipase C, beta 1 (PLCB1), which is ranked ca. 94%. By contrast, PLCB1 is only ranked ca. 26% in female platelets. The entire list of 76 proteins is summarized in Supplemental Table 4. Many of the proteins on this male-specific list are closely associated with either megakaryocyte expansion or platelet activation, and will be discussed further in the context of a systems-biology-based analysis (see Table 4).
Table 2.
Top 15 low-abundance proteins that are expressed in platelets from male donors.
| ID | Rank in females | Rank in males | Delta rank | local FDR | Symbol |
|---|---|---|---|---|---|
| general transcription factor II, i | (44.8 ± 3.7)% | (96.5 ± 1.0)% | ↓ 51.7% | 13% | GTF2I |
| Mdm2, transformed 3T3 cell double minute 2, p53 binding protein (mouse) | (78.2 ± 4.0)% | (94.9 ± 1.3)% | ↓ 16.7% | 0% | MDM2 |
| phospholipase C, beta 1 (phosphoinositide-specific) | (26.0 ± 1.9)% | (93.9 ± 1.1)% | ↓ 67.9% | 13% | PLCB1 |
| sortilin-related receptor, L(DLR class) A repeats-containing | (74.4 ± 2.3)% | (93.6 ± 1.5)% | ↓ 19.3% | 0% | SORL1 |
| ras homolog gene family, member A | (75.1 ± 2.6)% | (93.5 ± 1.5)% | ↓ 18.4% | 0% | RHOA |
| colony stimulating factor 1 receptor, formerly McDonough feline sarcoma viral (v-fms) oncogene homolog | (52.1 ± 7.9)% | (92.9 ± 1.0)% | ↓ 40.8% | 0% | CSF1R |
| homer homolog 1 (Drosophila) | (77.9 ± 2.4)% | (92.2 ± 0.9)% | ↓ 14.3% | 0% | HOMER1 |
| FK506 binding protein 10, 65 kDa | (56.2 ± 5.3)% | (90.7 ± 2.0)% | ↓ 34.5% | 0% | FKBP10 |
| phosphoinositide-3-kinase, regulatory subunit, polypeptide 1 (p85 alpha) | (53.9 ± 2.4)% | (90.4 ± 2.0)% | ↓ 36.5% | 12% | PIK3R1 |
| caveolin 1, caveolae protein, 22 kDa | (59.6 ± 4.5)% | (89.0 ± 0.9)% | ↓ 29.5% | 12% | CAV1 |
| proliferating cell nuclear antigen | (69.6 ± 3.4)% | (88.8 ± 2.1)% | ↓ 19.2% | 0% | PCNA |
| contactin 1 | (57.3 ± 3.5)% | (88.6 ± 2.7)% | ↓ 31.4% | 6% | CNTN1 |
| mitogen-activated protein kinase 3 | (71.5 ± 3.9)% | (87.7 ± 2.0)% | ↓ 16.2% | 6% | MAPK3 |
| ubiquitin fusion degradation 1-like | (53.2 ± 4.4)% | (87.6 ± 1.7)% | ↓ 34.4% | 10% | UFD1L |
Table 4.
Connectivity analysis of the gender-dependent platelet signaling proteome. (a) Summary of top 24 hubs in male platelets in terms of edges connecting the hub protein to other proteins. (b) Summary of top 11 hubs in female platelets in terms of edges connecting the hub protein to other proteins.
(a) Hubs with increased expression in male platelets.
| No. | Name | Edges |
|---|---|---|
| 1 | STAT3 | 19 |
| 2 | c-Fos | 15 |
| 3 | CBP | 15 |
| 4 | Rac1 | 12 |
| 5 | Cvclin D1 | 11 |
| 6 | Beta-catenin | 10 |
| 7 | c-Raf-1 | 10 |
| 8 | ERK1 (MAPK3) | 10 |
| 9 | CDK1 (p34) | 9 |
| 10 | Caspase-7 | 8 |
| 11 | HDAC3 | 8 |
| 12 | JNK1(MAPK8) | 8 |
| 13 | PKC-beta | 8 |
| 14 | RACK1 | 8 |
| 15 | PDGF-R-beta | 7 |
| 16 | PU.1 | 7 |
| 17 | CRK | 6 |
| 18 | IL-6 | 6 |
| 19 | PI3K reg class IA (p85-alpha) | 6 |
| 20 | TFII-I | 6 |
| 21 | CRM1 | 5 |
| 22 | NCOA3 (pCIP/SRC3) | 5 |
| 23 | PKC-beta2 | 5 |
| 24 | PLC-qamma 1 | 5 |
(b) Hubs with increased expression in female platelets.
| No. | Name | Edges |
|---|---|---|
| 1 | c-Myc | 41 |
| 2 | p53 | 24 |
| 3 | GCR-alpha | 13 |
| 4 | Lck | 12 |
| 5 | PKC-alpha | 9 |
| 6 | p73 | 8 |
| 7 | SHP-2 | 8 |
| 8 | SHP-1 | 7 |
| 9 | GSK3 beta | 6 |
| 10 | IKK-alpha | 5 |
| 11 | Max | 5 |
Table 3 shows an equivalent relationship for the top 15 proteins in female platelets. The top protein in Table 3 is the tumor suppressor gene p53, closely followed by protein kinase C epsilon (PRKCE), multiple PDZ domain protein (MPDZ), and nuclear factor of activated T-cells 2 (NFATC2). The entire list of 91 proteins is summarized in Supplemental Table 5. These are familiar and interesting proteins in their own right. However, a more comprehensive systems approach, as explored below, will be necessary to understand this proteome in terms of platelet function. Nonetheless, the only point to be made by these tables alone is that the relative expression of proteins involved in disparate signaling processes is profoundly different in platelets from male and female donors.
Table 3.
Top 15 low-abundance proteins that are expressed in platelets from female donors.
| ID | Rank in females | Rank in males | Delta rank | local FDR | Symbol |
|---|---|---|---|---|---|
| tumor protein p53 binding protein, 2 | (96.4 ± 0.5)% | (19.0 ± 0.6)% | ↑ 77.4% | 10% | TP53BP2 |
| protein kinase C, epsilon | (96.3 ± 1.0)% | (53.9 ± 2.9)% | ↑ 42.3% | 15% | PRKCE |
| multiple PDZ domain protein | (94.8 ± 0.7)% | (17.5 ± 1.6)% | ↑ 77.3% | 15% | MPDZ |
| nuclear factor of activated T-cells, cytoplasmic, calcineurin-dependent 2 | (94.7 ± 0.9)% | (58.5 ± 2.7)% | ↑ 36.2% | 15% | NFATC2 |
| synapsin II | (94.0 ± 0.7)% | (33.9 ± 2.0)% | ↑ 60.2% | 0% | SYN2 |
| cell division cycle 27 | (93.8 ± 1.3)% | (61.2 ± 6.7)% | ↑ 32.6% | 0% | CDC27 |
| DEAD (Asp-Glu-Ala-Asp) box polypeptide 1 | (93.4 ± 1.8)% | (58.4 ± 5.4)% | ↑ 34.9% | 0% | DDX1 |
| scavenger receptor class B, member 1 | (93.0 ± 1.6)% | (42.0 ± 7.3)% | ↑ 50.9% | 0% | SCARB1 |
| centrosomal protein 2 | (92.1 ± 2.1)% | (62.6 ± 5.0)% | ↑ 29.5% | 0% | CEP2 |
| neuropilin 2 | (91.9 ± 1.7)% | (59.4 ± 5.6)% | ↑ 32.5% | 0% | NRP2 |
| tumor protein p53 (Li-Fraumeni syndrome) | (91.2 ± 2.5)% | (23.8 ± 1.9)% | ↑ 67.4% | 15% | TP53 |
| SV40 Large T Antigen | (91.0 ± 0.6)% | (68.0 ± 3.0)% | ↑ 23.0% | 12% | — |
| v-myc myelocytomatosis viral oncogene homolog (avian) | (90.6 ± 2.4)% | (24.9 ± 1.9)% | ↑ 65.7% | 0% | MYC |
| proteasome (prosome, macropain) 26S subunit, ATPase, 5 | (89.8 ± 1.9)% | (26.8 ± 1.0)% | ↑ 63.0% | 0% | PSMC5 |
| amphiphysin (Stiff-Man syndrome with breast cancer 128 kDa autoantigen) | (89.3 ± 3.6)% | (48.2 ± 4.1)% | ↑ 41.1% | 0% | AMPH |
3.6. Antibody Microarray Data Can Be Qualified by Comparison with Western Blot Analyses
To qualify the antibody microarray findings, we tested a subset of the proteins with a range of differential expressions using the semiquantitative western blot technology. Figure 3(a) shows average western blot data from three independent experiments with antibodies against 9 different proteins: Caspase 7, IκBα, STAT3, PKCα, PKCβ, MAPK1, PKCδ, ERK (MAPK3), and β-integrin. From the bar graph, it is evident that some proteins differ quite a lot (e.g., STAT3) while others are almost equally expressed (e.g., PKCδ). Figure 3(b) tests for a correlation between the intensities of these proteins on the antibody microarray (Supplementary Tables 4 and 5) and the western blot data. We find that there is a correlation that is evident by inspection. In addition, with the R2 values of this plot ranging in different experiments from 0.85 to 0.94, it appears that the slope of the western versus spot intensity plot is not statistically different from 1. We conclude that the gender-based differences, as defined by the antibody microarray analysis, can be qualified by Western blot for a limited range of identified signaling proteins.
4. Discussion
In this paper, we report that the low-abundance platelet signaling proteome is profoundly gender-specific. These gender-specific differences in protein expression were discovered using novel, large-scale antibody microarrays. Highly stringent statistical analyses, using the SAM algorithm for calculating local False Discovery Rates (FDR), identify 76 of 576 candidate low-abundance proteins that were more highly expressed in male platelets, and 91 proteins among the same candidates that were more highly expressed in female platelets. We also qualified expression levels of nine of the proteins by a standard Western blot method. By contrast, using conventional 2D Gel Electrophoresis and mass spectrometry, we detected and identified only a few gender-specific differences in the set of ca. 2800 high abundance structural and metabolic proteins. Finally, using in silico connectivity analyses of the low-abundance platelet proteomes, we find that platelets from male donors have high connectivity hubs that are more heavily weighted towards megakaryocyte expansion and platelet activation processes than platelets from female donors. Based on these data, we suggest that this discovery of the novel gender-specific platelet signaling proteome may contribute to understanding biological basis for the well-documented female gender advantage in cardiovascular disease.
4.1. Connectivity Analysis Yields Candidate Functional Information on Gender-Based Platelet Proteomics
Connectivity analysis is an important analytic technique that can be used to identify candidate regulatory mechanisms that are implicit in proteomic and genomic data. Data from Supplementary Tables 4 and 5 were therefore used to generate connectivity plots for [male > female] data (Figure 4(a)) and [female > male] data (Figure 4(b)), respectively. Both graphs show that relatively few proteins form hubs that connect by edges to many other identified proteins. However, as summarized in Tables 4(a) and 4(b), gender makes quite a difference in terms of the functional identities of the highest occupancy hubs. The differences extend to differential levels of transcription factors (Supplemental Table 6) and membrane receptors (Supplemental Table 7). Furthermore, as shown in Supplementary Table 8, these differences fall into fundamentally different functional categories when viewed from the perspective of gene ontology (GO) categories. Among the top 5 GO categories for platelets of male origin are signal transduction and intracellular signaling cascade, all with high percentage and P values <10−15. By contrast, the top 5 GO categories for platelets of female origin contain neither of these categories, and the category with highest P value, “positive regulation of cellular processes”, is only 10−13. Finally, as discussed below, the set of male hubs in Table 4(a) is generally more closely associated with platelet activation processes than are the female hubs in Table 4(b).
Figure 4.

Connectivity analysis of gender-specific signaling proteins in platelets from male and female donors. (a) Connectivity analysis of platelet signaling proteins that are ranked higher in male than female donors. (b) Connectivity analysis of platelet signaling proteins that are ranked higher in female than male donors.
4.2. Highly Connected Protein Hubs in Male Platelets Support Megakarycytic Expansion and Platelet Activation Processes
The 24 most highly connected hubs in the male platelet proteome are summarized in Table 4(a). The data are ordered in terms of numbers of edges per hub. The assumption in this analysis is that functional importance may be related to the most highly connected hubs. However, the interactions database is constructed from all biological systems. We therefore needed to query the literature for the relevance of each hub to platelets and precursor megakaryocytes. We find that these male-specific hubs fall mainly into two categories: thrombopoeitin (TPO)-driven megakaryocyte development and platelet activation. Twelve of the 24 male-specific hubs are directly associated in the literature with megakaryocytic development and expansion. For example, (no. 1) STAT3 is activated by TPO [29], leading to expansion of megakaryocytic progenitor cells [30], and a parallel increase in platelet mitochondrial transcription [31]. Other hubs documented for megakaryocytic expansion activities include (no. 2) c-FOS, [32]; (no. 3) CBP (CREB Binding Protein, [33]; (no. 5) Cyclin D1 [34]; (no. 7) c-Raf-1 [35]; (no. 9) CDK1/p34 [36, 37]; (no. 11) HDAC3 [38]; (no. 12) JNK1/MAPK8 [39]; (no. 16) PU.1/PBP [40]; only found in platelets or megakaryocytes) and (no. 19) PI3K Reg Class 1A/p85alpha [41]. Three other male-specific hubs are directly associated with STAT 3 regulation in platelets. These include (no. 15) PDGF-R-beta [42], (no. 18) Interleukin 6IL-6 [43, 44], and (no. 21) CRM1 [45]. CRM1 mediates shuttling of activated STAT3 in and out of the megakaryocyte nucleus. Thus at least 54% (13 of 24) of the male-specific hubs are associated with the megakaryocytic expansion process. We interpret their presence in mature platelet to represent an archeological remnant of events occurring in the precursor megakaryocyte compartment.
Nine of these 24 male-specific hubs have well-characterized relationships to intrinsic platelet activation processes. (no. 4) Rho GTPase RAC1 is activated by α-thrombin to uncap actin filaments and drive the process of cytoskeleton remodeling in stimulated platelets [46, 47]. (no. 6) beta-catenin is present in platelets [48], and interacts with cadherins on endothelial cells [49]. This interaction mediates the process of adherence between platelets and endothelial cells, which must occur during blood coagulation. (no. 8) ERK1 (MAPK3) is obligatorily phosphorylated when thrombin activates platelets [47]. Pharmacologically, davallialactone [50] and the antiseizure drug gabapentin [51] inhibit collagen or ADP-activated platelet activation by blocking p38 MAPK phosphorylation. (no. 13) PKC-beta-1 is a negative regulator of thrombin-receptor-mediated calcium entry [52]. (no. 14) RACK1 regulates platelet-specific outside-in signaling by the following process: [fibrinogen >Integrin alpha2b, beta 3 >RACK1 >PKCbeta-1] [53]. (no. 18) IL-6, in addition to interacting directly with STAT3 (see above), also makes mature platelets more sensitive to activation by thrombin and platelet activating factor [43]. (no. 19) PI3K Reg Class 1A/p85 alpha, in addition to mediating megakaryocytic expansion, enhances thrombin-dependent alpha granule secretion in platelets [54]. (no. 23) PKC-beta 2 and a splice variant, PKC-beta 1, are activated in thrombin-stimulated platelets [55]. (no. 24) PLC-gamma-1 is phosphorylated following platelet activation and contributes both calcium and diacylglycerol to activate protein kinase C isoforms [56]. Thus at least 38% (9 of 24) of the male-specific hubs are associated with processes that drive platelet activation.
The remaining four male-specific hubs do not have specific functional relationships to platelet biology. One of these is (no. 10) Caspase 7, which we also qualified as gender-specific by western blot analysis (see Figure 3). Furthermore, apoptotic processes in megakaryocytes are known to be involved in the genesis of platelets [57–59]. However, why this hub should be enhanced in a gender-specific manner in mature platelets is not yet apparent. (no. 17) CRK, the human homolog of the avian sarcoma virus oncogene, has no association in the literature with the platelet system. (no. 20) TFII-I has both nuclear and cytoplasmic functions, but none yet are documented for the platelet system [60]. Finally, (no. 22) NCOA3 (pCIP/SRC3) is associated by an unknown mechanism with a decrease in circulating platelets in Src3(−/−) knockout mice [61].
4.3. Highly Connected Proteins Hubs in Female Platelets Are Either Negative or Neutral for Platelet-Relevant Processes
The eleven most highly connected hubs in the female platelet proteome are summarized in Table 4(b). The top three hubs in this set are associated with processes that tend to suppress megakaryocytic expansion processes. For example, (no. 1) c-MYC is a transcription factor whose expression is induced in megakaryocytes by thrombopoeitin. Alone, thrombopoeitin is a trophic factor which promotes survival, proliferation, and polyploidization of megakaryocytes [41]. However, concommitant c-MYC elevation actually has the consequence of reducing megakaryocytopoiesis, and decreasing polyploidization [62]. Thus there are minimal effects on circulating platelet levels. cMYC binds to and induces expression of (no. 6) p73, and both together downregulate PDGF beta receptors [63]. (no. 11) MAX binds to c-MYC, but there is no platelet or megakaryocyte-specific literature regarding function. (no. 2) p53 is the tumor suppressor gene p53. Elevation of p53 in a megakaryocyte cell line acts to reduce polyploidization, and to impede the transition to endomitosis. p53 achieves these megakaryocytic endpoints by suppressing cell cycling and by promoting apoptosis [64]. (no. 3) GCRA is the glucocorticoid receptor-alpha. Functional glucocorticoid receptors have been previously identified in a human megakaryocytic cell line, where agonists reduced cell growth and differentiation [65]. The glucocorticoid dexamethasone has also been shown to counteract the effect of chronic idiopathic thrombopenia purpura (ITP) on megakaryocytopoiesis and platelet production [66]. (no. 4) Lck is the lymphocyte-specific tyrosine kinase (Lck), which in spite of its name, is a Src-family kinase that is also found in platelets [67]. However, unlike the close association of other members of the Src family with platelet activation, the function of Lyk in platelets is unknown. Thus unlike the case for the top ranked male-specific hubs, 6 of the 11 the top ranked female hubs are distinctly either negative or neutral with respect to either megakaryocte expansion or platelet activation processes.
However, there are several lower ranked female-specific hubs that are either negative or possibly neutral for platelet activation. (no. 7) SHP-2 is a tyrosine phosphatase which binds to PECAM-1 [68] during the thrombin-induced platelet aggregation process [69]. (no. 8) SHP-1 is a splice variant of SHP-2, which binds with lesser affinity to PECAM-1 during platelet aggregation [70]. Although both SHP-1 and SHP-2 are said to be positive regulators of signal transduction, their specific functions in platelets are not yet known. (no. 9) GSK3beta has inhibitory actions on platelet aggregation processes. For example, platelets from a GSK3beta (+/−) mouse demonstrate enhanced agonist-dependent aggregation, as do human platelets treated with GSK3beta inhibitors [71]. Finally, (no. 10) IKKalpha is a key regulator of proinflammatory NFκB activation, which regulates this process in human platelets [72]. However, the contribution of NFκB, if any, to platelet activation is not known. We conclude from this analysis that the female signaling proteome is characterized by regulatory hubs that are either negative or neutral for megakaryocyte expansion or platelet activation. It is important to keep in mind, however, that all the activation processes represented by the principal hubs in male platelets are also in female platelets. They are just relatively reduced in expression.
4.4. The Platelet Literature Is Consistent with Male Platelets Having Enhanced Hemostatic Function
While the levels of platelet-specific signaling proteins are higher in male than female platelets, it is reasonable to question whether these differences have functional significance. For example, in spite of differences in expression levels, there may yet be sufficient levels of different proteins to drive gender-equivalent coagulation processes. However, from the limited available literature, platelets from male human donors do appear to have enhanced hemostatic activity compared to platelets from female donors. For example, studies of interactions between platelets and the subendothelium have indicated that platelets from males interact more profoundly with the subendothelium than platelets from female donors [73]. In addition, aspirin treatment of the donors significantly reduces the platelet-subendothelium interaction in males but not females. Thus the interaction seems to be controlled by the gender of the platelet donor. In a more recent study with human umbilical artery segments [74], platelet spreading and adherence were shown to be significantly greater with platelets from male than female donors. Coincidentally, both collagen-induced and arachidonic acid-induced platelet aggregation in platelets from male donors are also correlated with enhanced adherence. Finally, the latter authors reported that the mean bleeding time was slightly longer in women than men.
Gender-dependent differences in platelet function have also been reported experimentally in different systems. For example, pathologic platelet hyper-reactivity has been reported in a large study of women with a family history of premature atherosclerosis [75]. Estrogen itself has dramatic positive effects on megakaryocytic expansion and platelet production in humans [76] and mice [77, 78]. In sexually mature pigs, platelet aggregation and dense body ATP secretion are greater in male than female pigs [79]. We therefore suggest that the dominant procoagulant character of the male platelet signaling proteome, which we have demonstrated here for the first time, is consistent with these functional data. However, the fact is that we cannot, a priori, know with certainty whether any of these functional differences can be traced directly to differences in the respective signaling proteomes.
5. Conclusion
We conclude that the different proteomic signaling signatures for male and female platelets may very likely provide a candidate biological mechanism for the female gender gap advantage over males for cardiovascular diseases. Substantial amounts of work have been published on the high-abundance platelet proteome [80–82]. However, none of these studies addressed the issue of gender-specificity. Neither could they have, considering the proteomic technologies employed. Our own investigation of the high abundance platelet proteome indicates that few examples of gender dependence would have been found. By contrast, our data show unambiguously that the gender-difference is accessible only in the low-abundance signaling proteome. Globally, the low-abundance proteome is presently accessible only through the novel, quantitative and highly sensitive protein microarray platform described here. Individually, many of the differences in protein expression can be validated by Western blot. Nonetheless, we need to emphasize that these conclusions are based on platelets from just 16 randomly chosen healthy control humans. Certainly. additional datasets will be needed to test the constancy of the specific protein measurements. We therefore suggest that the discovery of gender-specificity for a subset of the platelet signaling proteome is completely unprecedented, and adds a fundamentally new candidate mechanism for gender discrimination in cardiovascular disease.
Supplementary Material
Supplemental Figure 1: Light and electronmicroscopic images of platelets from male and female donors.
Supplemental Figure 2: 2D Gel Electrophoretic separation of male and female platelets.
Supplemental Figure 3: Distribution of SEM values for different proteins in platelets from male and female donors.
Supplemental Figure 4: ROC Curves for top gender-specific differences.
Supplemental Table 1: Identification of protein features on 2DGE separations that distinguish between platelets from male and female donors.
Supplemental Table 2: Mass spectrometry identification of high abundance proteins that significantly distinguish platelets from male and female donors.
Supplemental Table 3: Most Significant Rank-Order Differences between Female and Male Platelets. Cohort: 8 males and 8 females.
Supplemental Table 4: Male-specific gender differences in platelet protein expression.
Supplemental Table 5: Female-specific gender differences in platelet protein expression.
Supplemental Table 6: Female-specific platelet transcription factors.
Supplemental Table 7: Gender-dependent platelet membrane receptors.
Supplemental Table 8: Gender-dependent platelet proteome gene ontology.
Supplemental Table 9: Demographic description of normal control platelet donors.
Supplemental Table 10: Statistical properties of the differences between protein expression levels in male and female cohorts.
Acknowledgments
The authors are grateful to the National Institutes of Health for support of this work: (NO1-HV-28187 [HBP]; RO1-DK-53051-7 [HBP]; Z01-MH-00388-31 [DMJ]), and to the Cystic Fibrosis Foundation [HBP]. They gratefully acknowledge Ms. Gertrude Goping for technical contributions with electron and optical microscopy and Dr. Merrilee Poth for helpful discussions.
References
- 1.Awtry EH, Loscalzo J. Aspirin. Circulation. 2000;101(10):1206–1218. doi: 10.1161/01.cir.101.10.1206. [DOI] [PubMed] [Google Scholar]
- 2.Quinn MJ, Fitzgerald DJ. Ticlopidine and clopidogrel. Circulation. 1999;100(15):1667–1672. doi: 10.1161/01.cir.100.15.1667. [DOI] [PubMed] [Google Scholar]
- 3.Agnelli G. Rationale for the use of platelet aggregation inhibitors in PAD patients. Vascular Medicine. 2001;6(3):13–15. doi: 10.1177/1358836X0100600i104. [DOI] [PubMed] [Google Scholar]
- 4.Aronow WS. Antiplatelet therapy in peripheral arterial disease. Current Drug Targets: Cardiovascular and Haematological Disorders. 2004;4(3):265–267. doi: 10.2174/1568006043336104. [DOI] [PubMed] [Google Scholar]
- 5.Tendera MB, Wojakowski W. Role of antiplatelet drugs in the prevention of cardiovascular events. Thrombosis Research. 2003;110(5-6):355–359. doi: 10.1016/j.thromres.2003.08.003. [DOI] [PubMed] [Google Scholar]
- 6.Tran H, Anand SS. Oral antiplatelet therapy in cerebrovascular disease, coronary artery disease, and peripheral arterial disease. Journal of the American Medical Association. 2004;292(15):1867–1874. doi: 10.1001/jama.292.15.1867. [DOI] [PubMed] [Google Scholar]
- 7.Grau AJ, Reiners S, Lichy C, Buggle F, Ruf A. Platelet function under aspirin, clopidogrel, and both after ischemic stroke: a case-crossover study. Stroke. 2003;34(4):849–854. doi: 10.1161/01.STR.0000064326.65899.AC. [DOI] [PubMed] [Google Scholar]
- 8.Ferroni P, Basili S, Davi G. Platelet activation, inflammatory mediators and hypercholesterolemia. Current vascular pharmacology. 2003;1(2):157–169. doi: 10.2174/1570161033476772. [DOI] [PubMed] [Google Scholar]
- 9.Pathansali R, Smith N, Bath P. Altered megakaryocyte—platelet haemostatic axis in hypercholesterolaemia. Platelets. 2001;12(5):292–297. doi: 10.1080/09537100120058810. [DOI] [PubMed] [Google Scholar]
- 10.Collier A, Tymkewycz PM, Matthews DM, Jones RL, Clarke BF. Changes in some aspects of platelet function with improvement of glycaemic control over 6 months. Diabetes Research. 1987;5(2):79–82. [PubMed] [Google Scholar]
- 11.Tschope D, Langer E, Schauseil S, Rosen P, Kaufmann L, Gries FA. Increased platelet volume—sign of impaired thrombopoiesis in diabetes mellitus. Klinische Wochenschrift. 1989;67(4):253–259. doi: 10.1007/BF01717328. [DOI] [PubMed] [Google Scholar]
- 12.Papanas N, Symeonidis G, Maltezos E, et al. Mean platelet volume in patients with type 2 diabetes mellitus. Platelets. 2004;15(8):475–478. doi: 10.1080/0953710042000267707. [DOI] [PubMed] [Google Scholar]
- 13.Smith NM, Pathansali R, Bath PMW. Platelets and stroke. Vascular Medicine. 1999;4(3):165–172. doi: 10.1177/1358836X9900400307. [DOI] [PubMed] [Google Scholar]
- 14.Greisenegger S, Endler G, Hsieh K, Tentschert S, Mannhalter C, Lalouschek W. Is elevated mean platelet volume associated with a worse outcome in patients with acute ischemic cerebrovascular events? Stroke. 2004;35(7):1688–1691. doi: 10.1161/01.STR.0000130512.81212.a2. [DOI] [PubMed] [Google Scholar]
- 15.Nadar SK, Blann AD, Kamath S, Beevers DG, Lip GYH. Platelet indexes in relation to target organ damage in high-risk hypertensive patients: a substudy of the Anglo-Scandinavian Cardiac Outcomes Trial (ASCOT) Journal of the American College of Cardiology. 2004;44(2):415–422. doi: 10.1016/j.jacc.2004.03.067. [DOI] [PubMed] [Google Scholar]
- 16.Pathansali R, Smith NM, Bath PMW. Prothrombotic megakaryocyte and platelet changes in hypertension are reversed following treatment: a pilot study. Platelets. 2001;12(3):144–149. doi: 10.1080/09537100120039000. [DOI] [PubMed] [Google Scholar]
- 17.Bath PMW, Butterworth RJ. Platelet size: measurement, physiology and vascular disease. Blood Coagulation and Fibrinolysis. 1996;7(2):157–161. [PubMed] [Google Scholar]
- 18.Desideri G, Simone M, Iughetti L, et al. Early activation of vascular endothelial cells and platelets in obese children. Journal of Clinical Endocrinology and Metabolism. 2005;90(6):3145–3152. doi: 10.1210/jc.2004-1741. [DOI] [PubMed] [Google Scholar]
- 19.Laws A, Hoen HM, Selby JV, Saad MF, Haffner SM, Howard BV. Differences in insulin suppression of free fatty acid levels by gender and glucose tolerance status: relation to plasma triglyceride and apolipoprotein B concentrations. Insulin Resistance Atherosclerosis Study (IRAS) Investigators. Arteriosclerosis, Thrombosis, and Vascular Biology. 1997;17(1):64–71. doi: 10.1161/01.atv.17.1.64. [DOI] [PubMed] [Google Scholar]
- 20.Srivastava M, Eidelman O, Jozwik C, et al. Serum proteomic signature for cystic fibrosis using an antibody microarray platform. Molecular Genetics and Metabolism. 2006;87(4):303–310. doi: 10.1016/j.ymgme.2005.10.021. [DOI] [PubMed] [Google Scholar]
- 21.Pollard HB, Srivastava M, Eidelman O, et al. Protein microarray platforms for clinical proteomics. Proteomics: Clinical Applications. 2007;1(9):934–952. doi: 10.1002/prca.200700154. [DOI] [PubMed] [Google Scholar]
- 22.Radomski MW, Palmer RM, Moncada S. The anti-aggregating properties of vascular endothelium: interactions between prostacyclin and nitric oxide. British Journal of Pharmacology. 1987;92(3):639–646. doi: 10.1111/j.1476-5381.1987.tb11367.x. [DOI] [PMC free article] [PubMed] [Google Scholar]
- 23.White JG. Electron microscopy methods for studying platelet structure and function. Methods in Molecular Biology. 2004;272:47–63. doi: 10.1385/1-59259-782-3:047. [DOI] [PubMed] [Google Scholar]
- 24.Pollard HB, Ji X-D, Jozwik C, Jacobowitz DM. High abundance protein profiling of cystic fibrosis lung epithelial cells. Proteomics. 2005;5(8):2210–2226. doi: 10.1002/pmic.200401120. [DOI] [PubMed] [Google Scholar]
- 25.Pollard HB, Eidelman O, Jozwik C, et al. De Novo biosynthetic profiling of high abundance proteins in cystic fibrosis lung epithelial cells. Molecular and Cellular Proteomics. 2006;5(9):1628–1637. doi: 10.1074/mcp.M600091-MCP200. [DOI] [PubMed] [Google Scholar]
- 26.Tusher VG, Tibshirani R, Chu G. Significance analysis of microarrays applied to the ionizing radiation response. Proceedings of the National Academy of Sciences of the United States of America. 2001;98(9):5116–5121. doi: 10.1073/pnas.091062498. [DOI] [PMC free article] [PubMed] [Google Scholar]
- 27.Eidelman O, Srivastava M, Zhang J, et al. Control of the proinflammatory state in cystic fibrosis lung epithelial cells by genes from the TNF-αR/NFκB pathway. Molecular Medicine. 2001;7(8):523–534. [PMC free article] [PubMed] [Google Scholar]
- 28.Srivastava M, Eidelman O, Zhang J, et al. Digitoxin mimics gene therapy with CFTR and suppresses hypersecretion of IL-8 from fibrosis lung epithelial cells. Proceedings of the National Academy of Sciences of the United States of America. 2004;101(20):7693–7698. doi: 10.1073/pnas.0402030101. [DOI] [PMC free article] [PubMed] [Google Scholar]
- 29.Nagata Y, Nagahisa H, Nagasawa T, Todokoro K. Regulation of megakaryocytopoiesis by thrombopoietin and stromal cells. Leukemia. 1997;11(supplement 3):435–438. [PubMed] [Google Scholar]
- 30.Kirito K, Osawa M, Morita H, et al. A functional role of Stat3 in in vivo megakaryopoiesis. Blood. 2002;99(9):3220–3227. doi: 10.1182/blood.v99.9.3220. [DOI] [PubMed] [Google Scholar]
- 31.Vassilev AO, Lorenz DR, Tibbles HE, Uckun FM. Role of the leukemia-associated transcription factor STAT3 in platelet physiology. Leukemia and Lymphoma. 2002;43(7):1461–1467. doi: 10.1080/1042819022386716. [DOI] [PubMed] [Google Scholar]
- 32.Chui CMY, Li K, Yang M, et al. Platelet-derived growth factor up-regulates the expression of transcription factors NF-E2, GATA-1 and c-Fos in megakaryocytic cell lines. Cytokine. 2003;21(2):51–64. doi: 10.1016/s1043-4666(02)00499-4. [DOI] [PubMed] [Google Scholar]
- 33.Liu X-L, Yuan J-Y, Zhang J-W, Zhang X-H, Wang R-X. Differential gene expression in human hematopoietic stem cells specified toward erythroid, megakaryocytic, and granulocytic lineage. Journal of Leukocyte Biology. 2007;82(4):986–1002. doi: 10.1189/jlb.0107014. [DOI] [PubMed] [Google Scholar]
- 34.Sun S, Zimmet JM, Toselli P, Thompson A, Jackson CW, Ravid K. Overexpression of cyclin D1 moderately increases ploidy in megakaryocytes. Haematologica. 2001;86(1):17–23. [PubMed] [Google Scholar]
- 35.Rubiolo C, Piazzolla D, Meissl K, et al. A balance between Raf-1 and Fas expression sets the pace of erythroid differentiation. Blood. 2006;108(1):152–159. doi: 10.1182/blood-2005-09-3866. [DOI] [PubMed] [Google Scholar]
- 36.Bassini A, Pierpaoli S, Falcieri E, et al. Selective modulation of the cyclin B/CDK1 and cyclin D/CDK4 complexes during in vitro human megakaryocyte development. British Journal of Haematology. 1999;104(4):820–828. doi: 10.1046/j.1365-2141.1999.01264.x. [DOI] [PubMed] [Google Scholar]
- 37.Vitrat N, Cohen-Solal K, Pique C, et al. Endomitosis of human megakaryocytes are due to abortive mitosis. Blood. 1998;91(10):3711–3723. [PubMed] [Google Scholar]
- 38.Ozawa Y, Towatari M, Tsuzuki S, et al. Histone deacetylase 3 associates with and represses the transcription factor GATA-2. Blood. 2001;98(7):2116–2123. doi: 10.1182/blood.v98.7.2116. [DOI] [PubMed] [Google Scholar]
- 39.Nagata Y, Nishida E, Todokoro K. Activation of JNK signaling pathway by erythropoietin, thrombopoietin, and interleukin-3. Blood. 1997;89(8):2664–2669. [PubMed] [Google Scholar]
- 40.Zhang C, Gadue P, Scott E, Atchison M, Poncz M. Activation of the megakaryocyte-specific gene protein (PBP) by the Ets family factor PU.1. Journal of Biological Chemistry. 1997;272(42):26236–26246. doi: 10.1074/jbc.272.42.26236. [DOI] [PubMed] [Google Scholar]
- 41.Chanprasert S, Geddis AE, Barroga C, Fox NE, Kaushansky K. Thrombopoietin (TPO) induces c-myc expression through a PI3K- and MAPK-dependent pathway that is not mediated by Akt, PKCζ or mTOR in TPO-dependent cell lines and primary megakaryocytes. Cellular Signalling. 2006;18(8):1212–1218. doi: 10.1016/j.cellsig.2005.09.010. [DOI] [PubMed] [Google Scholar]
- 42.Vignais M-L, Gilman M. Distinct mechanisms of activation of Stat1 and Stat3 by platelet-derived growth factor receptor in a cell-free system. Molecular and Cellular Biology. 1999;19(5):3727–3735. doi: 10.1128/mcb.19.5.3727. [DOI] [PMC free article] [PubMed] [Google Scholar]
- 43.Burstein SA. Effects of interleukin 6 on megakaryocytes and on canine platelet function. Stem Cells. 1994;12(4):386–393. doi: 10.1002/stem.5530120405. [DOI] [PubMed] [Google Scholar]
- 44.Yeh H-H, Lai W-W, Chen HHW, Liu H-S, Su W-C. Autocrine IL-6-induced Stat3 activation contributes to the pathogenesis of lung adenocarcinoma and malignant pleural effusion. Oncogene. 2006;25(31):4300–4309. doi: 10.1038/sj.onc.1209464. [DOI] [PubMed] [Google Scholar]
- 45.Herrmann A, Vogt M, Mönnigmann M, et al. Nucleocytoplasmic shuttling of persistently activated STAT3. Journal of Cell Science. 2007;120(18):3249–3261. doi: 10.1242/jcs.03482. [DOI] [PubMed] [Google Scholar]
- 46.Azim AC, Barkalow K, Chou J, Hartwig JH. Activation of the small GTPases, rac and cdc42, after ligation of the platelet PAR-1 receptor. Blood. 2000;95(3):959–964. [PubMed] [Google Scholar]
- 47.Bahou WF. Thrombin receptors. In: Michelson AD, editor. Platelets. 2nd edition. Elsevier/Academic Press; 2007. pp. 179–200. [Google Scholar]
- 48.Elrod JW, Park JH, Oshima T, Sharp CD, Minagar A, Alexander JS. Expression of junctional proteins in human platelets. Platelets. 2003;14(4):247–251. doi: 10.1080/0953710031000118894. [DOI] [PubMed] [Google Scholar]
- 49.Halama T, Groger M, Pillinger M, et al. Platelet endothelial cell adhesion molecule-1 and vascular endothelial cadherin cooperatively regulate fibroblast growth factor-induced modulations of adherens junction functions. Journal of Investigative Dermatology. 2001;116(1):110–117. doi: 10.1046/j.1523-1747.2001.00176.x. [DOI] [PubMed] [Google Scholar]
- 50.Kim SD, Lee I-K, Lee WM, et al. The mechanism of anti-platelet activity of davallialactone: involvement of intracellular calcium ions, extracellular signal-regulated kinase 2 and p38 mitogen-activated protein kinase. European Journal of Pharmacology. 2008;584(2-3):361–367. doi: 10.1016/j.ejphar.2008.02.008. [DOI] [PubMed] [Google Scholar]
- 51.Pan C-F, Shen M-Y, Wu C-J, Hsiao G, Chou D-S, Sheu J-R. Inhibitory mechanisms of gabapentin, an antiseizure drug, on platelet aggregation. Journal of Pharmacy and Pharmacology. 2007;59(9):1255–1261. doi: 10.1211/jpp.59.9.0010. [DOI] [PubMed] [Google Scholar]
- 52.Xu Y, Ware JA. Selective inhibition of thrombin receptor-mediated Ca2+ entry by protein kinase C β. Journal of Biological Chemistry. 1995;270(41):23887–23890. doi: 10.1074/jbc.270.41.23887. [DOI] [PubMed] [Google Scholar]
- 53.Buensuceso CS, Obergfell A, Soriani A, et al. Regulation of outside-in signaling in platelets by integrin-associated protein kinase Cβ. Journal of Biological Chemistry. 2005;280(1):644–653. doi: 10.1074/jbc.M410229200. [DOI] [PubMed] [Google Scholar]
- 54.Kojima H, Shinagawa A, Shimizu S, et al. Role of phosphatidylinositol-3 kinase and its association with Gab1 in thrombopoietin-mediated up-regulation of platelet function. Experimental Hematology. 2001;29(5):616–622. doi: 10.1016/s0301-472x(01)00623-3. [DOI] [PubMed] [Google Scholar]
- 55.Baldassare JJ, Henderson PA, Burns D, Loomis C, Fisher GJ. Translocation of protein kinase C isozymes in thrombin-stimulated human platelets: correlation with 1,2-diacylglycerol levels. Journal of Biological Chemistry. 1992;267(22):15585–15590. [PubMed] [Google Scholar]
- 56.Tate BF, Rittenhouse SE. Thrombin activation of human platelets causes tyrosine phosphorylation of PLC-γ2. Biochimica et Biophysica Acta. 1993;1178(3):281–285. doi: 10.1016/0167-4889(93)90205-4. [DOI] [PubMed] [Google Scholar]
- 57.Li J, Kuter DJ. The end is just the beginning: megakaryocyte apoptosis and platelet release. International Journal of Hematology. 2001;74(4):365–374. doi: 10.1007/BF02982078. [DOI] [PubMed] [Google Scholar]
- 58.Kaluzhny Y, Ravid K. Role of apoptotic processes in platelet biogenesis. Acta Haematologica. 2004;111(1-2):67–77. doi: 10.1159/000074487. [DOI] [PubMed] [Google Scholar]
- 59.De Botton S, Sabri S, Daugas E, et al. Platelet formation is the consequence of caspase activation within megakaryocytes. Blood. 2002;100(4):1310–1317. doi: 10.1182/blood-2002-03-0686. [DOI] [PubMed] [Google Scholar]
- 60.Caraveo G, van Rossum DB, Patterson RL, Snyder SH, Desiderio S. Action of TFII-I outside the nucleus as an inhibitor of agonist-induced calcium entry. Science. 2006;314(5796):122–125. doi: 10.1126/science.1127815. [DOI] [PubMed] [Google Scholar]
- 61.Coste A, Antal MC, Chan S, et al. Absence of the steroid receptor coactivator-3 induces B-cell lymphoma. The EMBO Journal. 2006;25(11):2453–2464. doi: 10.1038/sj.emboj.7601106. [DOI] [PMC free article] [PubMed] [Google Scholar]
- 62.Thompson A, Zhang Y, Kamen D, Jackson CW, Cardiff RD, Ravid K. Deregulated expression of c-myc in megakaryocytes of transgenic mice increases megakaryopoiesis and decreases polyploidization. Journal of Biological Chemistry. 1996;271(38):22976–22982. doi: 10.1074/jbc.271.38.22976. [DOI] [PubMed] [Google Scholar]
- 63.Hackzell A, Uramoto H, Izumi H, Kohno K, Funa K. p73 independent of c-Myc represses transcription of platelet-derived growth factor β-receptor through interaction with NF-Y. Journal of Biological Chemistry. 2002;277(42):39769–39776. doi: 10.1074/jbc.M204483200. [DOI] [PubMed] [Google Scholar]
- 64.Fuhrken PG, Apostolidis PA, Lindsey S, Miller WM, Papoutsakis ET. Tumor suppressor protein p53 regulates megakaryocytic polyploidization and apoptosis. Journal of Biological Chemistry. 2008;283(23):15589–15600. doi: 10.1074/jbc.M801923200. [DOI] [PMC free article] [PubMed] [Google Scholar]
- 65.Song L-N, Cheng T. Glucocorticoid-induced growth inhibition and differentiation of a human megakaryoblastic leukemia cell line: involvement of glucocorticoid receptor. Stem Cells. 1993;11(4):312–318. doi: 10.1002/stem.5530110409. [DOI] [PubMed] [Google Scholar]
- 66.Li S, Wang L, Zhao C, Li L, Peng J, Hou M. CD8+ T cells suppress autologous megakaryocyte apoptosis in idiopathic thrombocytopenic purpura. British Journal of Haematology. 2007;139(4):605–611. doi: 10.1111/j.1365-2141.2007.06737.x. [DOI] [PubMed] [Google Scholar]
- 67.Ezumi Y, Shindoh K, Tsuji M, Takayama H. Physical and functional association of the Src family kinases Fyn and Lyn with the collagen receptor glycoprotein VI-Fc receptor γ chain complex on human platelets. Journal of Experimental Medicine. 1998;188(2):267–276. doi: 10.1084/jem.188.2.267. [DOI] [PMC free article] [PubMed] [Google Scholar]
- 68.Jackson DE, Ward CM, Wang R, Newman PJ. The protein-tyrosine phosphatase SHP-2 binds platelet/endothelial cell adhesion molecule-1 (PECAM-1) and forms a distinct signaling complex during platelet aggregation. Evidence for a mechanistic link between PECAM-1- and integrin-mediated cellular signaling. Journal of Biological Chemistry. 1997;272(11):6986–6993. doi: 10.1074/jbc.272.11.6986. [DOI] [PubMed] [Google Scholar]
- 69.Edmead CE, Crosby DA, Southcott M, Poole AW. Thrombin-induced association of SHP-2 with multiple tyrosine-phosphorylated proteins in human platelets. FEBS Letters. 1999;459(1):27–32. doi: 10.1016/s0014-5793(99)01209-0. [DOI] [PubMed] [Google Scholar]
- 70.Hua CT, Gamble JR, Vadas MA, Jackson DE. Recruitment and activation of SHP-1 protein-tyrosine phosphatase by human platelet endothelial cell adhesion molecule-1 (PECAM-1): identification of immunoreceptor tyrosine-based inhibitory motif-like binding motifs and substrates. Journal of Biological Chemistry. 1998;273(43):28332–28340. doi: 10.1074/jbc.273.43.28332. [DOI] [PubMed] [Google Scholar]
- 71.Li D, August S, Woulfe DS. GSK3β is a negative regulator of platelet function and thrombosis. Blood. 2008;111(7):3522–3530. doi: 10.1182/blood-2007-09-111518. [DOI] [PMC free article] [PubMed] [Google Scholar]
- 72.Liu F, Morris SA, Epps JL, Carroll RC. Demonstration of an activation regulated NF-κB/I-κBα complex in human platelets. Thrombosis Research. 2002;106(4-5):199–203. doi: 10.1016/s0049-3848(02)00130-5. [DOI] [PubMed] [Google Scholar]
- 73.Escolar G, Bastida E, Garrido M. Sex-related differences in the effects of aspirin on the interaction of platelets with subendothelium. Thrombosis Research. 1986;44(6):837–847. doi: 10.1016/0049-3848(86)90029-0. [DOI] [PubMed] [Google Scholar]
- 74.Lawrence JB, Leifer DW, Moura GL, et al. Sex differences in platelet adherence to subendothelium: relationship to platelet function tests and hematologic variables. American Journal of the Medical Sciences. 1995;309(4):201–207. doi: 10.1097/00000441-199504000-00003. [DOI] [PubMed] [Google Scholar]
- 75.Kurrelmeyer K, Becker L, Becker D, Yanek L, Goldschmidt-Clermont P, Bray PF. Platelet hyperreactivity in women from families with premature atherosclerosis. Journal of the American Medical Women’s Association. 2003;58(4):272–277. [PubMed] [Google Scholar]
- 76.Bord S, Frith E, Ireland DC, Scott MA, Craig JIO, Compston JE. Estrogen stimulates differentiation of megakaryocytes and modulates their expression of estrogen receptors α and β. Journal of Cellular Biochemistry. 2004;92(2):249–257. doi: 10.1002/jcb.20035. [DOI] [PubMed] [Google Scholar]
- 77.Nagata Y, Yoshikawa J, Hashimoto A, Yamamoto M, Payne AH, Todokoro K. Proplatelet formation of megakaryocytes is triggered by autocrine-synthesized estradiol. Genes and Development. 2003;17(23):2864–2869. doi: 10.1101/gad.1128003. [DOI] [PMC free article] [PubMed] [Google Scholar]
- 78.Fox SW, Chambers TJ. The effect of oestrogen on megakaryocyte differentiation and platelet counts in vivo. International Journal of Cardiology. 2006;109(3):359–366. doi: 10.1016/j.ijcard.2005.06.037. [DOI] [PubMed] [Google Scholar]
- 79.Jayachandran M, Okano H, Chatrath R, Owen WG, McConnell JP, Miller VM. Sex-specific changes in platelet aggregation and secretion with sexual maturity in pigs. Journal of Applied Physiology. 2004;97(4):1445–1452. doi: 10.1152/japplphysiol.01074.2003. [DOI] [PubMed] [Google Scholar]
- 80.O’Neill EE, Brock CJ, von Kriegsheim AF, et al. Towards complete analysis of the platelet proteome. Proteomics. 2002;2(3):288–305. doi: 10.1002/1615-9861(200203)2:3<288::aid-prot288>3.0.co;2-0. [DOI] [PubMed] [Google Scholar]
- 81.Maguire PB, Fitzgerald DJ. Platelet proteomics. Journal of Thrombosis and Haemostasis. 2003;1(7):1593–1601. doi: 10.1046/j.1538-7836.2003.00311.x. [DOI] [PubMed] [Google Scholar]
- 82.Marcus K, Moebius J, Meyer HE. Differential analysis of phosphorylated proteins in resting and thrombin-stimulated human platelets. Analytical and Bioanalytical Chemistry. 2003;376(7):973–993. doi: 10.1007/s00216-003-2021-z. [DOI] [PubMed] [Google Scholar]
Associated Data
This section collects any data citations, data availability statements, or supplementary materials included in this article.
Supplementary Materials
Supplemental Figure 1: Light and electronmicroscopic images of platelets from male and female donors.
Supplemental Figure 2: 2D Gel Electrophoretic separation of male and female platelets.
Supplemental Figure 3: Distribution of SEM values for different proteins in platelets from male and female donors.
Supplemental Figure 4: ROC Curves for top gender-specific differences.
Supplemental Table 1: Identification of protein features on 2DGE separations that distinguish between platelets from male and female donors.
Supplemental Table 2: Mass spectrometry identification of high abundance proteins that significantly distinguish platelets from male and female donors.
Supplemental Table 3: Most Significant Rank-Order Differences between Female and Male Platelets. Cohort: 8 males and 8 females.
Supplemental Table 4: Male-specific gender differences in platelet protein expression.
Supplemental Table 5: Female-specific gender differences in platelet protein expression.
Supplemental Table 6: Female-specific platelet transcription factors.
Supplemental Table 7: Gender-dependent platelet membrane receptors.
Supplemental Table 8: Gender-dependent platelet proteome gene ontology.
Supplemental Table 9: Demographic description of normal control platelet donors.
Supplemental Table 10: Statistical properties of the differences between protein expression levels in male and female cohorts.