

Abstract
Tandem high-throughput proteomics and metabolomics were employed to functionally characterize natural microbial biofilm communities. Distinct molecular signatures exist for each analyzed sample. Deconvolution of the high-resolution molecular data demonstrates that identified proteins and detected metabolites exhibit organism-specific correlation patterns. These patterns are reflective of the functional differentiation of two bacterial species that share the same genus and that co-occur in the sampled microbial communities. Our analyses indicate that the two species have similar niche breadths and are not in strong competition with one another.
IMPORTANCE
Natural microbial assemblages represent dynamic consortia that exhibit extensive complexity at all levels. In the present study, we demonstrate that correlations between protein and metabolite abundances allow the deconvolution of complex molecular data sets into shared and organism-specific contingents. We demonstrate that evolutionary divergence is associated with the restructuring of cellular metabolic networks, which in turn allows bacterial species to occupy distinct ecological niches. The apparent lack of interspecific competition may explain the extensive population-level genetic heterogeneity observed extensively within microbial communities. The reported findings have broad implications for the in-depth investigation of the ecology and evolution of distinct microbial community members and for leveraging the solution of cryptic metabolic processes in the future.
Introduction
In the natural environment, microorganisms form multispecies assemblages that represent ecological communities. The application of genomics and postgenomic functional approaches allows the in-depth molecular characterization of such communities and provides exciting prospects to test, expand, and formulate fundamental ecological and evolutionary principles at the systems level (1).
Restructuring of metabolism is likely a key step in the diversification of organisms into new ecological niches. Niche-dependent metabolic traits cannot be conclusively studied in microbial isolates because the metabolism of an organism in situ likely depends on its natural biological, as well as physical and chemical, environment. Global profiling of proteins and small molecules (metabolites) in coexisting organisms in their full community context is needed to resolve the extent to which metabolism is altered in niche differentiation. Here, for the first time, we combine cultivation-independent high-resolution community proteomics and metabolomics to investigate the functional differentiation of two bacterial species that share the same genus and that coinhabit microbial biofilms colonizing acid mine drainage (AMD) solutions within the Richmond mine at Iron Mountain, CA. Due to limited species richness, AMD biofilms represent ideal model communities for in-depth molecular characterization and placement of the resulting molecular patterns into their respective ecological and evolutionary contexts (2). Although microbial biofilms exhibit marked cell densities within spatially defined confines, ecological and evolutionary principles uncovered in such systems through high-resolution molecular characterization may be applicable to other, more diffuse, microbial communities, e.g., freshwater or marine planktonic microbial communities, as well as other ecological communities.
Fourteen distinct biofilm samples were collected from the air-AMD solution interface of underground streams and pools within the Richmond mine (see Fig. S1 in the supplemental material; for details of the materials and methods used, see Text S1 in the supplemental material). The samples reflect different environmental conditions, as well as different phases in ecological succession (3). Leptospirillum group II (“Leptospirillum rubarum”) dominates the earliest developmental stage in the presence of a small proportion of Leptospirillum group III (“L. ferrodiazotrophum”) and members of the domain Archaea (3). As biofilms mature, the proportion of members of Leptospirillum group III and Archaea increases in conjunction with the appearance of eukaryotes (3). Leptospirillum groups II and III are present throughout individual biofilm maturation stages but differ in spatial arrangement, with Leptospirillum group II forming tight agglomerations of cells and Leptospirillum group III being present as microcolonies or single cells (Fig. 1A). Based on their differing arrangements (3), as well as their differing gene and expressed protein complements (4), the two organisms appear to play distinct ecological roles within AMD biofilm communities.
FIG 1 .
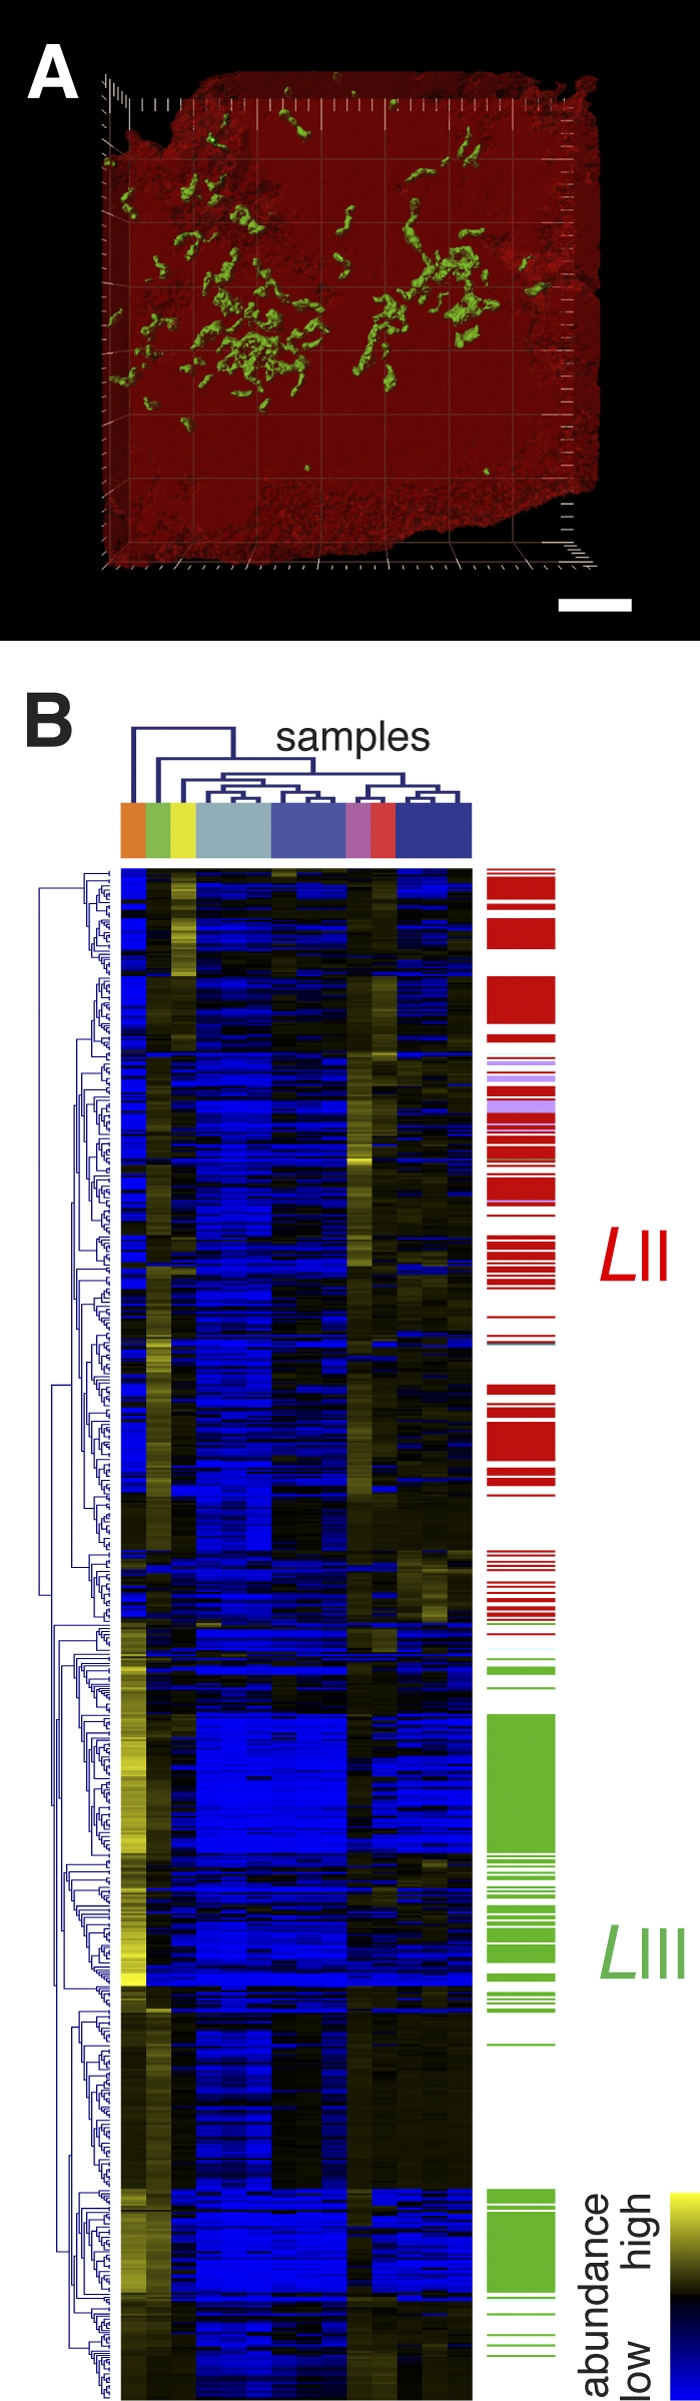
(A) Three-dimensional confocal laser scanning micrograph of biofilm collected from the ABM2 location following fluorescence in situ hybridization using Leptospirillum group II (red)- and III (green)-specific oligonucleotide probes. The scale bar is equivalent to 2 µm. (B) Hierarchical clustering (Pearson uncentered) of correlated proteins and metabolite features (r value, ≥0.9285; statistical P value, ≤0.0001). Distinct organismal clusters exist for Leptospirillum group II (identified proteins are indicated by red bars on the right) and Leptospirillum group III (identified proteins are indicated by green bars on the right). Sample color coding is defined in Fig. S1 in the supplemental material.
Following protein and metabolite extraction (see Text S1 in the supplemental material), samples were subjected to high-throughput proteomic and metabolomic characterization using liquid chromatography (LC) coupled to mass spectrometry (MS). Conventional metabolomic work flows typically limit analyses to previously characterized metabolites. Due to the large number of proteins of unknown function previously identified in AMD biofilms (5), several previously uncharacterized metabolic processes may be expected in the sampled microbial communities. To avoid bias, we employed an alternative metabolomic approach which extracts all of the possible metabolite features from acquired LC-MS data (see Text S1 in the supplemental material). Because we were primarily interested in the conserved proteomic and metabolomic signatures of Leptospirillum groups II and III to elucidate differences between the two organismal groups and to avoid potential biases in the data arising from zero values, we focused our analyses on protein and metabolite features that were conserved across all of the sampled communities. A total of 765 proteins were identified, and 3,740 metabolite features were detected across all of the samples (see Tables S1 and S2 in the supplemental material). These restricted proteomic and metabolomic data sets were filtered, normalized, integrated, and subjected to multivariate statistical analysis (principal-component analysis; see Text S1 in the supplemental material). Distinct molecular abundance patterns exist for each analyzed sample, and these primarily reflect the sampling date and location (i.e., geochemical and physical conditions [for a detailed description of these, see reference 6] represent the first principal component; see Fig. S2 in the supplemental material) and community composition (second principal component; see Fig. S2 in the supplemental material).
Within the microbial communities analyzed, the organismal origins of most of the identified proteins are known (5, 7). To determine discrete relationships between the protein and metabolite pools conserved across the analyzed samples, positive correlations were determined for protein-metabolite pairs. To achieve a balanced analysis, a specific Pearson product-moment coefficient was chosen to obtain an equivalent nonredundant sampling of proteins and metabolite features. For this, the numbers of correlated proteins and metabolite features (nonredundant counts; i.e., each protein or metabolite feature that was present in the correlation matrices at a given minimum r value was only counted once) were plotted for minimum correlation coefficients ranging from 0.90 to 0.99 (see Fig. S3 in the supplemental material). The intercept of the two lines defines the minimum correlation coefficient, i.e., an r value of ≥0.9285 (statistical P value of ≤0.0001), that relates an equal number of proteins and metabolite features (n = 370; see Table S3 in the supplemental material). The extracted protein complement is dominated by proteins encoded by Leptospirillum groups II (48.1% of proteins) and III (46.8%), respectively. Extracted proteins and metabolite features were hierarchically clustered based on their normalized abundances across all of the samples (Fig. 1B). The analysis results in two distinct clusters comprising proteins and metabolites, of which one includes primarily proteins from Leptospirillum group II and the other includes Leptospirillum group III proteins (Fig. 1B).
We constructed a correlation network based solely on the metabolites whose abundance patterns correlate with organism-specific proteins (Fig. 2A). The analysis relies upon the assignment of each metabolite feature to a specific organism based on its correlation with proteins of a known taxonomic affiliation (Fig. 1B). Importantly, the association of a given metabolite feature with a protein(s) of a specific organism implies not that the metabolite is produced by this organism but rather that its abundance pattern is not strongly correlated with a protein(s) encoded by the other organism. Results show strong metabolomic segregation based on organism type (Fig. 2A). Network topology reveals two major metabolite feature clusters which, based on the previous hierarchical clustering (Fig. 1B), are associated with Leptospirillum groups II and III, respectively (Fig. 2A). These clusters are linked by a limited percentage (2.5%) of metabolite features that cannot be conclusively associated with either of the two organisms (Fig. 2A). This shared contingent is enriched in small-to-medium-sized polar metabolites (209 to 389 Da). Conversely, the metabolites that exhibit strong organism-specific associations are primarily larger nonpolar metabolites (229 to 885 Da).
FIG 2 .

(A) Correlation network (r value, ≥ 0.9285; statistical P value, ≤0.0001) for all of the organism-specific metabolite features as defined by the clusters in Fig. 1B. (B) Correlation network of proteins and metabolite features (r ≥ 0.9285; statistical P value ≤0.0001). The two main clusters (i and j) of correlated proteins and metabolite features identified using the graph clustering algorithm FAG-EC (10) are highlighted in yellow. (C) Correlation network (r value, ≥ 0.9285; statistical P value, ≤ 0.0001) based on protein expression data. The two main clusters of correlated proteins are highlighted in yellow. Key to the color coding of nodes in networks: dark red circles, C18 reverse-phase metabolite features (primarily nonpolar metabolites) that fall within the Leptospirillum group II-specific cluster (Fig. 1B); pink circles, diamond hydride (DH) normal-phase metabolite features (primarily polar metabolites) that fall within the Leptospirillum group II-specific cluster; dark green circles, C18 metabolite features that fall within the Leptospirillum group III-specific cluster; light green circles, DH metabolite features that fall within the Leptospirillum group III-specific cluster; red triangles, proteins encoded by Leptospirillum group II; green triangles, proteins encoded by Leptospirillum group III; turquoise triangles, proteins encoded by a bacterium belonging to the phylum Firmicutes; olive triangles, proteins encoded by a bacterium belonging to the phylum Actinobacteria; light blue triangles, proteins encoded by A-plasma; purple triangles, proteins encoded by G-plasma. In all of the networks, the edges are shaded according to the significance of the correlations as highlighted in panel A (black, low; white, high).
A separate correlation network constructed using correlated pairs of protein-metabolite features (Fig. 2B) affirms organism-specific proteome-metabolome signatures. Posterior testing of this network reveals two prominent groups, the first comprising primarily Leptospirillum group III (Fig. 2B, i cluster) and the second consisting primarily of Leptospirillum group II (j cluster) proteins and associated metabolite features. To test for an organism-specific signature associated with the proteins whose abundances show a strong correlation with metabolite features, we constructed a separate correlation network using only the protein abundance data (Fig. 2C). Again, two distinct clusters consisting of Leptospirillum group III (Fig. 2C, i cluster) and II (j cluster) proteins (representing ~90% of proteins in each cluster) emerge. The vast majority of proteins (~97%) in the organism-specific clusters have orthologous proteins encoded by the other organism. However, only 37.0 and 50.3% of these exhibit protein expression profiles that correlate closely with metabolite profiles at the given r value, suggesting underlying differences in the metabolic network structure and regulation of the two organisms. Interestingly, proteins encoded by the archaeon G-plasma correlate strongly with Leptospirillum group II proteins, whereas A-plasma proteins correlate with Leptospirillum group III, suggesting that these Archaea cooccur with and/or occupy niches similar to those occupied by the two respective Leptospirillum species.
The observed organism-specific molecular abundance patterns emerge over a wide range of environmental conditions and community compositions and reflect the organisms’ realized niches. We estimated the niche breadth of both species by determining the degree of similarity between the frequency distribution of metabolite features associated with each of the represented microbial community members extracted at an r value of ≥0.9285 (statistical P value of ≤0.0001; see Text S1 in the supplemental material). We found that the two Leptospirillum species exhibit medial niche breadths (proportional similarity indexes of 0.48 and 0.51 for Leptospirillum groups II and III, respectively), which indicates similar degrees of specialization for the two species. Limited niche overlap suggests partitioned resource usage for both organism groups. Using the same data, we calculated competition coefficients for both Leptospirillum groups II and III (seeText S1 in the supplemental material) and found these to be very low (α values of 0.009 and 0.01, respectively). This indicates very little interspecific competition between the two organism groups. Because Leptospirillum groups II and III are present throughout individual biofilm developmental stages, as well as different geochemical conditions, they may be regarded as generalist species. Lack of interspecific competition among generalists is linked to increased individual-level variation and specialization (8). Interestingly, the observed extensive fine-scale genetic heterogeneity that is apparent within Leptospirillum sp. populations (9) may be a reflection of such adaptive radiation.
Leptospirillum groups II and III exhibit specific phenotypic traits, and the observed biomolecular patterns provide a high-resolution denotation of both microbial species. The findings indicate that evolutionary divergence is associated with the restructuring of cellular metabolic and/or regulatory networks which, in turn, lessens competition between coexisting organisms and allows them to occupy distinct niches. Deconvolution of the coupled high-resolution molecular abundance level data will allow future biochemical characterization of the evolutionary metabolic network rewiring necessary for the two organisms to play their distinct ecological roles. In particular, it has not escaped our attention that potentially chemically related metabolite features exhibit strong correlations. Excitingly, this offers a means to prioritize downstream chemical characterization of such metabolites, which may include the elucidation of cryptic biochemical pathways that most likely exist within such natural microbial communities.
ACKNOWLEDGMENTS
T. W. Arman (President, Iron Mountain Mines) and R. Sugarek (Environmental Protection Agency) are thanked for providing site access. D. Dodds and R. Carver are thanked for on-site assistance.
This work is funded by the US Department of Energy, Office of Biological and Environmental Research through the Genomic Sciences: ENIGMA Science Focus Area Program (contract number DE-AC02-05CH11231), GTL program (contract number DE-FG02-05ER64134) and programs in Carbon-Cycling (contract number DE-SC0004665) and Systems Biology Knowledgebase (contract number DE-SC0004918). P.W. was partially supported by a Luxembourg National Research Fund ATTRACT grant (FNR/A09/03).
Footnotes
Citation Wilmes, P., B. P. Bowen, B. C. Thomas, R. S. Mueller, V. J. Denef, et al. 2010. Metabolome-proteome differentiation coupled to microbial divergence. mBio 1(5):e00246-10. doi:10.1128/mBio.00246-10.
SUPPLEMENTAL MATERIAL
REFERENCES
- 1. Raes J., Bork P. 2008. Molecular eco-systems biology: towards an understanding of community function. Nat. Rev. Microbiol. 6:693–699 [DOI] [PubMed] [Google Scholar]
- 2. Denef V. J., Mueller R. S., Banfield J. F. 2010. AMD biofilms: using model communities to study microbial evolution and ecological complexity in nature. ISME J. 4:599–610 [DOI] [PubMed] [Google Scholar]
- 3. Wilmes P., Remis J. P., Hwang M., Auer M., Thelen M. P., Banfield J. F. 2009. Natural acidophilic biofilm communities reflect distinct organismal and functional organization. ISME J. 3:266–270 [DOI] [PubMed] [Google Scholar]
- 4. Goltsman D. S. A., Denef V. J., Singer S. W., VerBerkmoes N. C., Lefsrud M., Mueller R. S., Dick G. J., Sun C. L., Wheeler K. E., Zemla A., Baker B. J., Hauser L., Land M., Shah M. B., Thelen M. P., Hettich R. L., Banfield J. F. 2009. Community genomic and proteomic analyses of chemoautotrophic iron-oxidizing “Leptospirillum rubarum” (group II) and “Leptospirillum ferrodiazotrophum” (group III) bacteria in acid mine drainage biofilms. Appl. Environ. Microbiol. 75:4599–4615 [DOI] [PMC free article] [PubMed] [Google Scholar]
- 5. Ram R. J., VerBerkmoes N. C., Thelen M. P., Tyson G. W., Baker B. J., Blake R. C., II, Shah M., Hettich R. L. , Banfield J. F. 2005. Community proteomics of a natural microbial biofilm. Science 308:1915–1920 [PubMed] [Google Scholar]
- 6. Druschel G., Baker B., Gihring T., Banfield J. 2004. Acid mine drainage biogeochemistry at Iron Mountain, California. Geochem. Trans. 5:13–32 [DOI] [PMC free article] [PubMed] [Google Scholar]
- 7. Lo I., Denef V. J., VerBerkmoes N. C., Shah M. B., Goltsman D., DiBartolo G., Tyson G. W., Allen E. E., Ram R. J., Detter J. C., Richardson P., Thelen M. P., Hettich R. L., Banfield J. F. 2007. Strain-resolved community proteomics reveals recombining genomes of acidophilic bacteria. Nature 446:537–541 [DOI] [PubMed] [Google Scholar]
- 8. Bolnick D. I., Svanbäck R., Araújo M. S., Persson L. 2007. Comparative support for the niche variation hypothesis that more generalized populations also are more heterogeneous. Proc. Natl. Acad. Sci. U. S. A. 104:10075–10079 [DOI] [PMC free article] [PubMed] [Google Scholar]
- 9. Simmons S. L., Dibartolo G., Denef V. J., Goltsman D. S., Thelen M. P., Banfield J. F. 2008. Population genomic analysis of strain variation in Leptospirillum group II bacteria involved in acid mine drainage formation. PLoS Biol. 6:e177. [DOI] [PMC free article] [PubMed] [Google Scholar]
- 10. Li M., Wang J., Chen J. 2008. A fast agglomerate algorithm for mining functional modules in protein interaction networks, p. 3-7 In2008 International Conference on Biomedical Engineering and Informatics, Sanya, Hainan, China, 27 to 30 May 2008 doi: 10.1109/BMEI.2008.121 [DOI] [Google Scholar]
Associated Data
This section collects any data citations, data availability statements, or supplementary materials included in this article.