Abstract
Here we present the successful application of the microarray technology platform to the analysis of DNA polymorphisms. Using the rice genome as a model, we demonstrate the potential of a high-throughput genome analysis method called Diversity Array Technology, DArT‘. In the format presented here the technology is assaying for the presence (or amount) of a specific DNA fragment in a representation derived from the total genomic DNA of an organism or a population of organisms. Two different approaches are presented: the first involves contrasting two representations on a single array while the second involves contrasting a representation with a reference DNA fragment common to all elements of the array. The Diversity Panels created using this method allow genetic fingerprinting of any organism or group of organisms belonging to the gene pool from which the panel was developed. Diversity Arrays enable rapid and economical application of a highly parallel, solid-state genotyping technology to any genome or complex genomic mixtures.
INTRODUCTION
Numerous DNA-based genetic marker analysis methods have been developed over the last two decades. These include restriction fragment length polymorphism (RFLP) (1), simple-sequence repeats (SSR) (2), random amplified polymorphic DNA (RAPD) (3), amplified fragment length polymorphism (AFLP) (4), nucleic acid indexing (5,6) and restriction enzyme amplification display system (READS) (7). While these genotyping methods have contributed greatly to our current understanding of genome organisation and genetic variation, they are constrained by their dependence on gel electrophoresis, resulting in low throughput. Some of these methods (SSR for example) require pre-identification of a polymorphism (or a potential site for it) before analysis of other individuals is possible. Furthermore, all methods based on size separation of multiple DNA fragments suffer from difficulties in precisely correlating bands on gels with allelic variants.
To overcome many of these restrictions, hybridisation-based methods using nucleic acids immobilised on solid-state surfaces have been developed. For example, DNA chips have been developed to analyse genotypes for single nucleotide polymorphisms (SNPs) (8). These minor, but abundant, differences in DNA sequence among genotypes are identified through an expensive and laborious DNA sequencing process. SNPs promise to revolutionise biomedicine, but the technology depends on intensive genomic sequencing and a high cost of analysis that cannot be matched in agriculture or basic research. A technology of similar power but with a much greater breadth and much lower cost is needed. Here we report the development of a solid-state, open-platform method for DNA polymorphism analysis called Diversity Array Technology, DArT‘. Genetic marker analysis through Diversity Arrays offers a low-cost high-throughput, robust system with minimal DNA sample requirement capable of providing comprehensive genome coverage even in organisms without any DNA sequence information.
MATERIALS AND METHODS
Generating Diversity Panels for rice
Diversity Panels were generated using DNA from nine rice cultivars: Azucena, IR20, IR64, Italica, Bala, Labelle, L203, Millin and Nipponbare. Three restriction endonucleases (Table 1) were used to generate representations (below) with complexities reduced by 100–1000-fold compared with total genomic samples. Fragments from representations were cloned and inserts individually amplified from bacterial colonies before arraying on glass slides.
Table 1. The adapter and primer oligonucleotide sequences.
| Restriction enzyme | Adapter sequence | Primer sequence + selective bases at 3′ end of primer | |
| |
5′
3′ |
5′3′ |
|
| EcoRI | CTCGTAGACTGCGTACC | GACTGCGTACCAATTC-XXX | XXX = AAG, AGT, ACG, ATG |
| AATTGGTACGCAGTCTAC | |||
| PstI | CACGATGGATCCAGTGCA | GATGGATCCAGTGCAG-X | X = T |
| CTGGATCCATCGTGCAG | |||
| MspI | CGCATCGCAGTCTACA | GTAGACTGCGATGCGG-XX | |
| GACTGTAGACTGCGATG | XX= TG | ||
Generating representations. Genomic DNA was extracted from young seedlings (9). About 5 ng of DNA from each cultivar was bulked and digested at 37°C for 1 h with 2 U of restriction enzyme in a volume of 8 µl. After digestion, 2 µl of ligase mixture was added and incubated at 37°C for 3 h. Ligase mixture consisted of 0.2 µl T4 ligase (New England Biolabs), 0.2 µl 10× ligase buffer, 0.1 µl 100× BSA (New England Biolabs), 0.2 µl 50 mM ATP, 1.2 µl MilliQ (MQ) H2O and 0.1 µl of enzyme-specific adapter (shown in Table 1) at 50 pmol/µl for MspI and 5 pmol/µl for EcoRI and PstI.
After ligation, the mixture was diluted to 500 µl with MQ H2O and 2 µl used as template in a 50 µl PCR reaction with 2 U of RedTaq polymerase (Sigma) and primers listed in Table 1. After incubation at 95°C for 3 min the reactions were cycled 30 times: at 94°C for 30 s, 60°C for 45 s and 72°C for 1 min. Final extension was performed at 72°C for 8 min.
Cloning and amplification of the fragments from representations. The amplicons from representations were ligated into the PCR2.1-TOPO vector using the TOPO cloning kit and transformed into heat-shock competent Escherichia coli strain TOP10F′ (Invitrogen) according to the manufacturer’s instructions. Transformants were selected on medium containing ampicillin, and X-gal. Individual white colonies (containing recombinant plasmids) were transferred by toothpicks into 20 µl of 10% glycerol. From each glycerol sample, a 5 µl aliquot was transferred to 45 µl of RedTaq PCR master mix containing 15 pmol each of Forward and Reverse M13 primers and 1.5 U of RedTaq polymerase. The reactions were incubated in microtitre plates for 5 min at 95°C followed by 35 cycles of: 94°C for 30 s, 52°C for 30 s and 72°C for 1 min.
After amplification, the PCR products were precipitated with 1 vol of isopropanol at room temperature and washed once with 100 µl of 70% ethanol. The ethanol was removed and the products were air dried.
Printing and processing of Diversity Panels. DNA was resuspended in MQ H2O, 3× SSC or 1× SSC + 0.01% Sarcosyl (Sigma) at ~20 ng/µl. The purified DNA fragments were transferred into a 384-well plate (Genetix) and arrayed with six replicates per fragment (250 µm centre to centre spot spacing) onto Polysine™ microscope slides (MenzelGlazer) using the 417 Affymetrix™ microarrayer.
At least 1 day after arraying, slides were processed according to the procedure published at http://www.microarrays.org/protocols.html (as of January 15, 2001), except that the succinic anhydride and 1 methyl-2-pyrrolidinone steps were replaced with sodium borohydride (Sigma) in phosphate-buffered saline (PBS) as the blocking solution. Slides were then dipped in boiling water for 30 s to denature the DNA followed by dipping for 10 s in cold 100% EtOH. Slides were dried by centrifugation at 1000 r.p.m. in a slide rack on microtitre plate carriers for 1 min.
Genotyping using Diversity Panels
Fluorescent labelling of representations. After PCR amplification, representations were column-purified (Qiagen) or precipitated by addition of isopropanol to remove excess dNTPs. Fluorescent dye, Cy3 or Cy5 (Pharmacia), was incorporated using a Deca-random-prime DNA labelling kit from Fermentas. Probes were labelled following manufacturer’s instructions except that the reaction volume was reduced to 5 µl, the time increased to 1 h and 0.4 µl of 1 mM Cy3-dUTP or Cy5-dUTP was used instead of 32p. Probes were not purified for hybridisation.
Hybridisation and washing. The Cy3- and Cy5-labelled representations (5 µl each) were mixed with 2 µl of 20 µg/µl herring sperm DNA (Sigma) dissolved in ExpressHyb hybridisation solution (Clontech) and denatured at 96°C for 3 min. The denatured probes were mixed with 10–15 µl of hybridisation solution, pipetted directly onto the microarray surface and covered with a glass coverslip (24 × 24 mm, Mediglass). Slides were quickly placed into a home-made humidification chamber in a 65°C water bath for overnight hybridisation.
After hybridisation, the coverslips were removed, and slides were rinsed in 1× SSC with 0.1% SDS for 5 min, 1× SSC for 2 min, 0.2× SSC for 2 min and 0.02× SSC for 20 s, all at room temperature. Slides were quickly dried by centrifugation at 1000 r.p.m. in a slide rack on microtitre plate carriers for 1 min.
Scanning, image analysis and data manipulations. Slides were scanned using the Affymetrix 418 Scanner adjusting the PMT voltage as required. Spot signal intensities were analysed by Scanalyse v.2.44 (Stanford University) as well as GenePix Pro v.3 (Axon instruments) and GMS Pathways (Affymetrix v. Beta). The outputs of image analysis programs listed above were further analysed using a program developed for Mathcad v.8 (the algorithms are available upon request).
RESULTS AND DISCUSSION
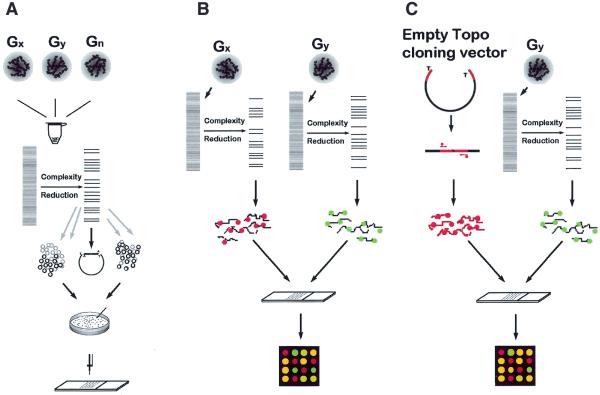
In the format presented here, DArT™ is assaying for the presence (or amount) of a specific DNA fragment in a representation that is derived from the total genomic DNA of an organism or a population of organisms (Fig. 1). A Diversity panel is created by cloning and individually arraying a large number of DNA fragments prepared from representations derived from a selected group of genotypes (Fig. 1A). Representations are prepared by restriction enzyme digestion of genomic DNA followed by ligation of restriction fragments to adapters and subsequent amplification (Materials and Methods). Individual DNA fragments are isolated by cloning. The inserts are then amplified and arrayed on a solid support. Diversity Panels created using this method allow genetic fingerprinting of any organism or a group of organisms belonging to the gene pool from which the panel was developed. A fingerprint is determined by hybridising a representation prepared from the organism(s) to be assayed to the arrayed nucleic acid fragments.
Figure 1.
Schematic representation of DArT. (A) Generation of Diversity Panels. Genomic DNAs of specimens to be studied are pooled together. The DNA is cut with a chosen restriction enzyme and ligated to adapters. The genome complexity is reduced in this case by PCR using primers with selective overhangs. The fragments from representations are cloned. Cloned inserts are amplified using vector-specific primers, purified and arrayed onto a solid support. (B) Contrasting two samples using DArT. Two genomic samples are converted to representations using the same methods as in (A). Each representation is labelled with a green or red fluorescent dye, mixed and hybridised to the Diversity Panel. The ratio of green:red signal intensity is measured at each array feature. Significant differences in the signal ratio indicate array elements (and the relevant fragment of the genome) for which the two samples differ. (C) Genetic fingerprinting using DArT. The DNA sample for analysis is converted to a representation using the methods as in (A) and labelled with green fluorescent dye. Fragments of the cloning vector, which are common to all elements of the array (polylinker of PCR2.1-TOPO vector, marked red), are labelled with red fluorescent dye and hybridised to a Diversity Panel together with green fluorescence-labelled representation. First the ratio of signal intensity is measured at each array feature for each input genotype used to generate Diversity Panels. Polymorphic spots are identified by binary distribution of signal ratios among input samples. Any new specimen can be assayed on arrays of polymorphic features to generate a genetic fingerprint.
In this report, we demonstrate two basic analysis formats: in the first approach (Fig. 1B) two representations are compared on a single array. In the second approach (Fig. 1C) a representation is compared with a DNA fragment common to all elements of the array allowing fingerprinting of a sample without using any reference genotype’s representation as a denominator.
To validate the DArT™ we used rice, an important model for crop plants. The Diversity Panels were generated using nine cultivars (three indica- and six japonica-type). Several panels were constructed using the combination of restriction enzymes and primers described in Table 1. The PCR amplicons described in Table 2 ranged from 0.3 to 2.4 kb with an average insert size of ~1 kb. For fragments arrayed, an arbitrarily assigned threshold value of three times the level of local background for the vector control (TOPO) was used to identify scorable features on the array. At least 90% of scorable spots were achieved for the panels analysed with minimal quality control of PCR amplification and product purification. Panels developed using EcoRI digestion and adapters were used for optimisation of the system including probe labelling, hybridisation conditions, slide washing and array design. EcoRI-generated panels were used also for the analysis of variance in order to partition the noise of the system into respective components (data not presented).
Table 2. Diversity Panel characterisation.
| Enzyme |
Clones |
Average insert size (kb) |
Range of amplicon sizes (kb) |
Scorable spots (%)a |
| EcoRI | 384 | 1.2 | 0.3–2.0 | 94 |
| PstI | 384 | 1.0 | 0.3–2.3 | 94 |
| MspI | 768 | 0.9 | 0.5–2.4 | 90 |
aArray features above the threshold value of three times the level of local background for the vector control (TOPO).
EcoRI panels were used for preliminary tests of the system’s ability to detect DNA sequence variation using pairwise comparisons of four rice cultivars (Bala, Millin, IR64 and IR20). A comparison between Millin (representation labelled with Cy5 dye) and IR64 (representation labelled with Cy3 dye) showed a high level of variation in signal intensity (brightness of array features) and Cy3:Cy5 signal ratios among array elements (Fig. 2A). The histogram of green to red channel normalised signal intensity ratios (Fig. 2B) shows trimodal distribution. The majority of array features group around 1, indicating equal signal intensity for Millin and IR64 samples (monomorphic features). Red and green ‘tails’ represent the groups of ‘polymorphic’ spots.
Figure 2.
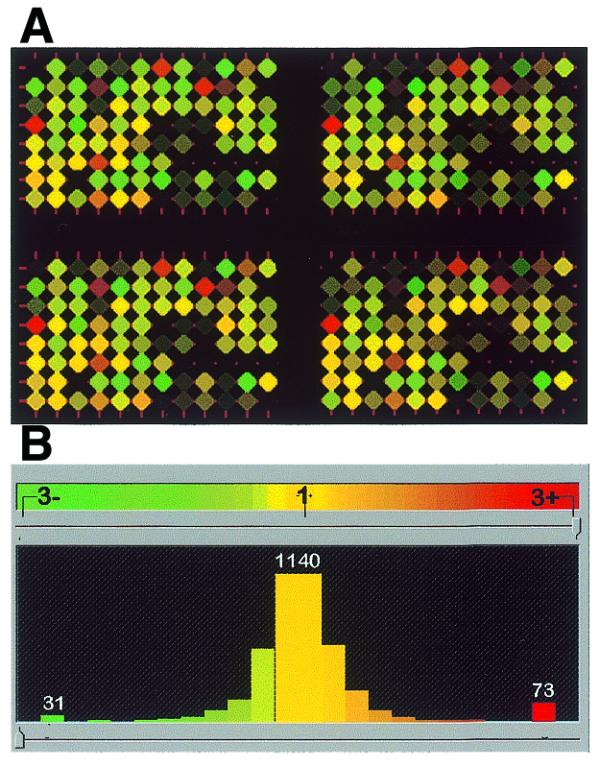
Differences between two rice cultivars, IR64 and Millin, detected using EcoRI Diversity Panels and Pathways image analysis program. (A) Synthetic array image of 96 spots printed four times from the EcoRI Diversity Panel. The rice cultivars IR64 and Millin were labelled with Cy3-green and Cy5-red, respectively. Files of scanned images of the whole array are available at http://farm.cambia.org.au/Nucleic_Acids/. (B) Histogram of green:red normalised signal intensity ratios shows trimodal distribution. The majority of the array features show signal intensity ratios ~1, indicating equal hybridisation intensity for Millin and IR64. The green and red ‘tails’ seen at signal intensity ratios >2.9 indicate features of the Diversity Panel that differentiate IR64 and Millin DNA.
Several DNA fragments identified in this analysis as potentially polymorphic between Millin and IR64 (with the red:green ratio >2.5) were used as probes on Southern blot genomic and representations samples (Fig. 3). In genomic Southern blots (Fig. 3A) EcoRI-digested rice DNA was resolved in agarose gel and transferred onto nylon membrane, PCR amplification products were transferred in case of the representations Southern blots (Fig. 3B).
Figure 3.
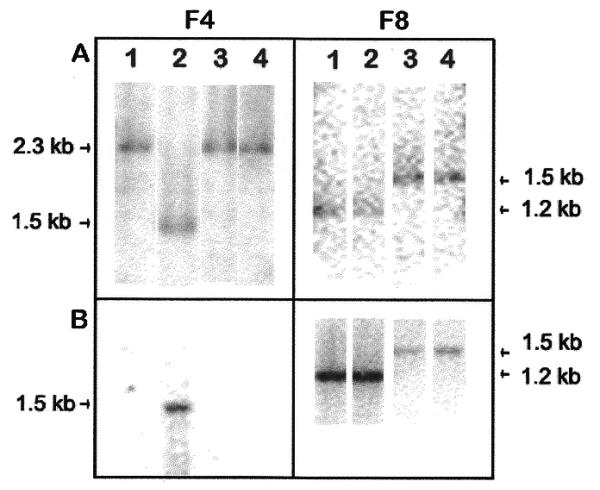
Validation of DArT-identified polymorphisms using genomic and subgenomic Southern blot technique. Two clones (F4 and F8), representing the two polymorphic features on the EcoRI Diversity panel were used as molecular probes. Four varieties of rice were analysed simultaneously: lane 1, Bala; lane 2, Millin; lane 3, IR64; lane 4, IR20. (A) Probe F4 and F8 hybridisation to the EcoRI genomic Southern blots. (B) Probe F4 and F8 hybridisation to the Southern blot of representations generated from genomic samples analysed in (A).
When probe F4 was hybridised to a blot of the representations Southern (Fig. 3B), a single 1.5 kb band was detected for Millin and no signal was detected for the other genotypes. The genomic Southern showed a fragment of 1.5 kb in the Millin while the other genotypes had a fragment size of 2.3 kb. In this example an RFLP in genomic DNA was converted to the presence/absence polymorphism in representations that can be identified in a highly parallel fashion using the DNA microarray platform. The F8 probe hybridised to a 1.3 kb band in Millin and Bala and a 1.5 kb band in IR64 and IR20 in both Southern blots. However, whereas the genomic Southern band intensities were similar, in the representations Southern, the bands in IR64 and IR20 were much weaker compared with the Millin and Bala bands. In this case an RFLP was converted to a quantitative polymorphism detected by signal intensity differences between Millin and IR64 representations on the array.
The EcoRI panel was also used to determine the minimal amount of DNA required for generation of reproducible representations. Four different amounts of adapter ligation products, from 0.2 to 12.5 ng, were used for PCR amplification using four genotypes (Bala, Millin, IR64 and IR20) and hybridisation results were analysed for polymorphism as described below. All genotypes were scored reproducibly as either present (1) or absent (0) for all 14 elements identified as polymorphic at the four DNA amount levels (data not shown).
In order to identify the elements of the array that represent polymorphic DNA fragments, all nine rice cultivars used for Diversity Panel generation were analysed on duplicate slides as described in Materials and Methods. The spot intensities normalisation, data transformation (to obtain near log-normal distribution) and polymorphic spot detection were achieved using Mathcad 8.0 program. Typical distributions of normalised ratios of signal intensities (the signal for MspI representation labelled with Cy3 divided by the signal for TOPO control labelled with Cy5) for four examples of non-polymorphic (Fig. 4A) and polymorphic (Fig. 4B) spots are presented. Each datum point is the normalised ratio determined from a single slide. The data points are arranged in the graph from the lowest to the highest value. For all non-polymorphic spots the ratio of signal intensities shows unimodal distribution across 18 slides (9 cultivars × 2 slides per cultivar). The polymorphic spots (Fig. 4B) show a clear bimodal distribution for the log transformed signal ratios. The program calculates the value (marked as ‘×’ on each curve) best separating the two clusters of low and high signal ratios, respectively, and classifies each sample analysed at the particular polymorphic feature as either 0 (low value cluster) or 1 (high value cluster). A table of binary scores is created automatically for all the samples and the polymorphic array features. An example of such a table for a rice MspI panel is presented below.
Figure 4.
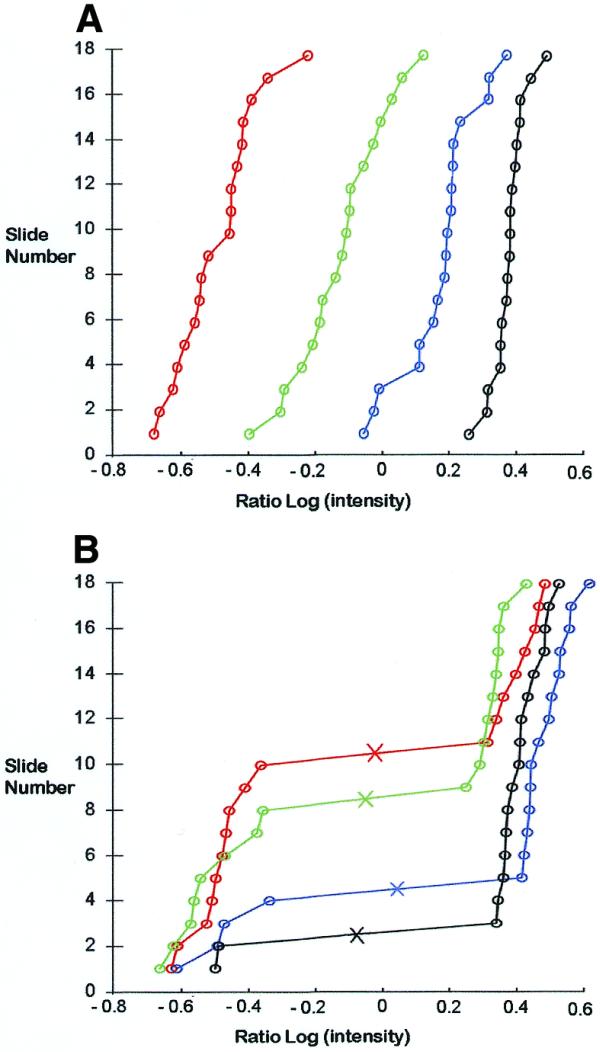
Examples of green:red signal ratio distributions for spots from the MspI Diversity panel among nine rice cultivars (two replica slides per cultivar). (A) Cumulative distribution function of log-transformed normalised signal ratios for four different non-polymorphic spots across 18 different slides. Classification of the spots as non-polymorphic is based on the monomodal distribution of the ratios across all slides. (B) Cumulative distribution function of log-transformed normalised signal ratios for four different polymorphic spots across 18 different slides. Classification of the spots as polymorphic spots is based on a clear bimodal distribution across all slides. The algorithm calculates the best value for separation of the high (value of 1) and low (value of 0) clusters shown as an ‘×’ on the curves.
The number of array features found as polymorphic among nine rice cultivars was 50 (14.5% of scorable spots) for the MspI Diversity Panel. Apart from providing an estimate of polymorphism level detected by our method, identification of polymorphic features allowed assessment of the level of redundancy among them. DNA fragments representing array elements displaying the same pattern of polymorphism (same binary scoring) among the nine rice cultivars were resolved on an agarose gel. DNA fragments with the same apparent mobility were scored as repeats. The analysis revealed that 50 polymorphic spots represented 28 unique clones, of which 20 had just one copy in the MspI panel of almost 400 clones. The MspI panel redundancy analysis data are available at http://farm.cambia.org.au/Nucleic_Acids/. Based on the average MspI fragment size (<1 kb), rice genome size of 430 Mb (10) and 256-fold complexity reduction due to using PCR primers with two selective bases (1/16 × 1/16), one would expect over 1000 unique fragments in our MspI panel, even if <50% of the fragments amplified efficiently. The presence of mostly unique clones among polymorphic spots provides evidence that our system is capable of analysing fairly complex representations.
Preliminary analysis of representations approximately 16 times more complex (using primer with a single selective base) indicates that through minor modification of the assay sensitivity (e.g. spotted DNA concentration, representation labelling/scanning efficiency, etc.) a comprehensive genome scan can be carried out using DArT™ (unpublished results). However, even the level of multiplexing reported here (c1000) is higher than the that reported for the SNP analysis of the plant (11) or human genomes (8). This is most likely due to the use of a single primer in our assay, while a pair of primers is used in the amplification of each genomic locus for the SNP analysis.
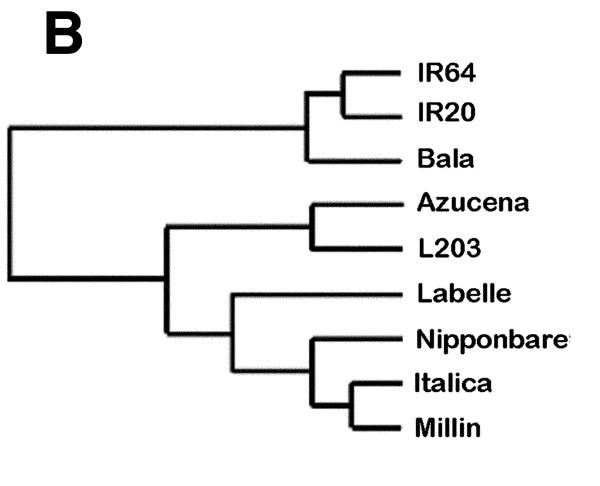
The binary scoring table for the 28 unique polymorphic MspI features (Fig. 5A) was used to calculate the distances between the cultivars and the distance table was used to produce a dendrogram showing the cultivar relatedness. Figure 5B shows the separation between indica and japonica rice cultivar classes using the MspI Diversity Panel. Similar results generated using the PstI Diversity Panel can be found at http://farm.cambia.org.au/Nucleic_Acids/.
Figure 5.
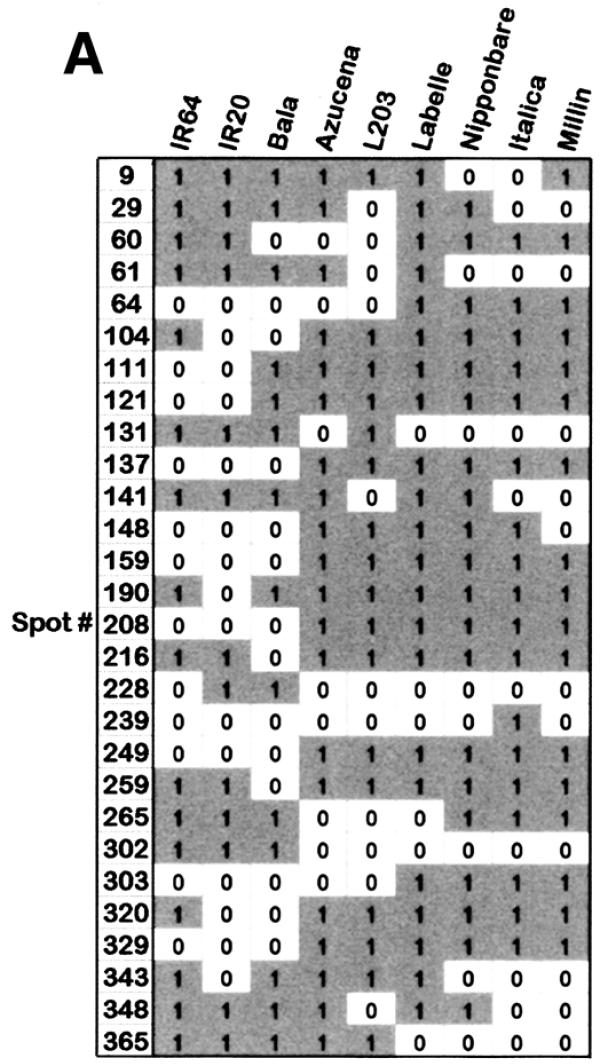
Genetic variation detected on the MspI Diversity Panel among nine rice cultivars. (A) A table of binary scores for cultivars analysed at polymorphic spots. Each cultivar was analysed with two slides, but since all replicates were classified as being the same, only one score per spot is presented for each cultivar. (B) Dendrogram generated from the MspI Diversity Panel. The binary scoring table of 28 unique features from the MspI panel was analysed by Cluster program (Stanford) using similarity metric setting of correlation uncentered and presented by treeview (Stanford). Differentiation among the cultivars analysed and separation between japonica- and indica-types is apparent in the dendrogram.
In order to test whether the polymorphisms detected by our system behaved as Mendelian markers doubled haploid (DH) lines developed from the cross between IR64 and Azucena (12) were used for genetic mapping. All 40 polymorphisms segregating in the DH line population were successfully mapped on the microsatellite-based framework map, which will be published elsewhere (S.Temnykh, K.Peng, D.Jaccoud, S.McCouch and A.Kilian, unpublished data).
To test whether analysis of complex DNA samples is feasible using our format we arrayed DNA fragments from Diversity panels developed from eight species on the same slide. The mix included rice and seven species of microorganisms. This composite panel was used as a target for hybridisation with representations from rice with or without DNA admixture from microorganisms. In one example, representation from rice cultivar Millin labelled with Cy5 dye was hybridised to the composite panel jointly with the mixed (at 10:1 DNA ratio) Millin and Enterobacter sp. (closest Buttiauxella agrestis) (13) representations labelled with Cy3 dye (Fig. 6). The left part of the panel (Fig. 6A) containing rice-derived features, shows mostly yellow spots, indicating a similar level of hybridisation signal for ‘pure’ Millin representation and Millin with the Entorobacter ‘spike’. This observation is confirmed by the histogram of signal ratio distribution (Fig. 6B) indicating lack of rice-derived features with a ratio >2.5. At the same time, there is a clear pattern of strongly ‘green’ features (ratios >2.5) located exclusively to the addresses of the Enterobacter-derived features. There was no significant signal detected at the other microorganism-derived spots on the composite panel, even with species identified as closely related by 16S sequence homology analysis (P.Wenzl, personal communication) used for panel generation.
Figure 6.
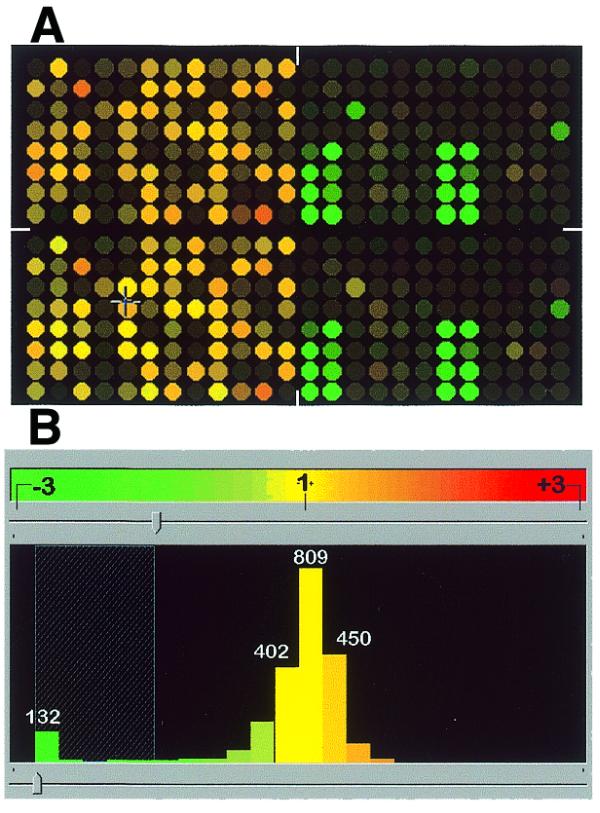
A reconstruction experiment using mixed (rice and several microorganisms) Diversity panels. ‘Clean’ Millin representation was labelled with red fluorescent dye and Enterobacter ’contaminated’ Millin representation was labelled with green fluorescent dye. The synthetic image and histogram were created using Pathways. (A) The left half of the array (mostly yellow features) represents the rice MspI panel. The right half of the array contains features from MspI panels from seven bacterial species and one from yeast. Green spots in the right part of the array correspond to the elements of the panel developed from the same Enterobacter DNA source as the one ‘spiked’ into Millin DNA. (B) Histogram of the signal ratios for the array presented in (A). The Enterobacter spike is detected as the ‘green’ left tail of the distribution.
DArT represents a solid-state format of genotype analysis, which compliments SNP analysis, typically carried out on relatively expensive lithographically-synthesised arrays of oligonucleotides (8,11). While several other formats of SNP analysis have been recently developed that may compete with oligonucleotide ‘gene chips’ including mass spectrometry (14) and electronics (15), the reliance on sequence information and high cost of analysis remain major limitations for the general adoption of SNP analysis.
The method of genome complexity reduction used in this paper resembles that used in AFLP (4), but polymorphism detection is based on hybridisation, not gel resolution. However, methods of representation generation other than those presented here can be used, including arbitrarily-primed polymerase chain reaction (16), RAPD (3), transposon display (17), etc. The choice of method will determine the spectrum of genomic locations sampled.
Diversity Arrays will detect single base pair changes within the restriction sites or at one of the selective bases of the PCR primer (if used). However, this technology is also capable of detecting insertion/deletion/rearrangement type DNA polymorphisms, apparently a more abundant type of DNA change in human and plant genomes compared with base substitutions (18).
Due to genome complexity reduction being a step in Diversity Panel generation and one of the outcomes (identification of polymorphic fragments among the genotypes compared) DArT is reminiscent of Representational Difference Analysis (RDA) (19). However, while RDA uses multiple rounds of subtraction and amplification steps to isolate restriction fragments uniquely present in one of the two samples analysed, DArT initially assays unselected populations of fragments for quantitative differences in hybridisation signal among input genotypes samples. A simple and effective method of enriching Diversity Panels for polymorphic fragments prior to cloning would be beneficial. We therefore tested several enrichment techniques including RDA, RFLP subtraction (20) and differential subtraction chain (21). However, our experience with these methods indicates that selection of polymorphic fragments through DArT is highly competitive, especially for development of Diversity Panels for global genome analysis of diverse range of samples (A.Kilian and K.Peng, unpublished results).
CONCLUSIONS
We have adapted the DNA microarray platform to DNA polymorphism analysis, DArT, which is not reliant on DNA sequence information. Potential applications of DArT include germplasm characterisation, genetic mapping and gene tagging, molecular marker-assisted breeding and tracking genome methylation changes. Composite Diversity Panels allow the resolving of complex genomic samples into respective components, offering genotyping in parallel with pathogen or endosymbiont detection and characterisation.
Acknowledgments
ACKNOWLEDGEMENTS
We would like to acknowledge Carol Nottenburg, Richard Jefferson, Andris Kleinhofs and Paul Keese for discussions during the course of this work and manuscript preparation. Susan McCouch, Svetlana Temnykh and colleagues from Cornell University for the rice DH lines DNA and mapping information. Stan Rose and colleagues at GMS (now Affymetrix) for collaboration during α-testing of the microarrayer and reader and β-testing of Pathways software. Adrian and Mark Gibbs for helping with clustering analysis. Peter Wenzl, Leon Smith, Subbu Putcha and Jorge Mayer for microbiological DNA samples and 16S sequence information. A fellowship from the Rockefeller Foundation to K.P. is gratefully acknowledged.
References
- 1.Botstein D., White,R., Skolnick,M. amd Davis,R. (1980) Construction of a genetic linkage map in man using restriction fragment length polymorphisms. Am. J. Hum. Genet., 32, 314–331. [PMC free article] [PubMed] [Google Scholar]
- 2.Weber J. and May,P. (1989) Abundant class of human DNA polymorphisms which can be typed using the polymerase chain reaction. Am. J. Hum. Genet., 44, 388–396. [PMC free article] [PubMed] [Google Scholar]
- 3.Williams J., Kubelik,A., Livak,K., Rafalski,J. and Tingey,S. (1990) DNA polymorphisms amplified by arbitrary primers are useful as genetic markers. Nucleic Acids Res., 18, 6531–6535. [DOI] [PMC free article] [PubMed] [Google Scholar]
- 4.Vos P., Hogers,R., Bleeker,M., Reijans,M., van de Lee,T., Hornes,M., Frijters,A., Pot,J., Peleman,J., Kuiper,M. et al. (1995) AFLP: a new technique for DNA fingerprinting. Nucleic Acids Res., 23, 4407–4414. [DOI] [PMC free article] [PubMed] [Google Scholar]
- 5.Guilfoyle R., Leeck,C., Kroening,K., Smith,L. and Guo,Z. (1997) Ligation-mediated PCR amplification of specific fragments from a class-II restriction endonuclease total digest. Nucleic Acids Res., 25, 1854–1858. [DOI] [PMC free article] [PubMed] [Google Scholar]
- 6.Unrau P. and Deugau,K. (1994) Non-cloning amplification of specific DNA fragments from whole genomic DNA digests using DNA ‘indexers’. Gene, 145, 163–169. [DOI] [PubMed] [Google Scholar]
- 7.Prashar Y. and Weissman,S. (1996) Nucleotide analysis of differential gene expression by display of 3′ end restriction fragments of cDNAs. Proc. Natl Acad. Sci. USA, 93, 659–663. [DOI] [PMC free article] [PubMed] [Google Scholar]
- 8.Wang D., Fan,J., Siao,C., Berno,A., Young,P., Sapolsky,R., Ghandour,G., Perkins,N., Winchester,E., Spencer,J. et al. (1998) Large-scale identification, mapping and genotyping of single-nucleotide polymorphisms in the human genome. Science, 280, 1077–1082. [DOI] [PubMed] [Google Scholar]
- 9.Murray H. and Thompson,W. (1980) Rapid isolation of high molecular weight plant DNA. Nucleic Acids Res., 8, 4321–4326. [DOI] [PMC free article] [PubMed] [Google Scholar]
- 10.Arumuganathan, K. and Earle,E. (1991) Nuclear DNA content of some important plant species. Plant Mol. Biol. Rep., 9, 208–218. [Google Scholar]
- 11.Cho R., Mindrinos,M., Richards,D., Sapolsky,R. Anderson,M., Drenkard,E., Dewdney,J., Reuber,T., Stammers,M., Federspiel,N. et al. (1999) Genome-wide mapping with biallelic markers in Arabidopsis thaliana. Nature Genet., 23, 203–207. [DOI] [PubMed] [Google Scholar]
- 12.Temnykh S., Park,W., Ayers,N., Cartinhour,S., Hauck,N., Lipovich,L., Cho,Y.G., Ishii,T. and McCouch,S. (2000) Mapping and genome organisation of microsatellite sequences in rice (Oryza sativa L.) Theor. Appl. Genet., 100, 697–712. [Google Scholar]
- 13.Sproer C., Mendrock,U., Swiderski,J., Lang,E. and Stackebrandt,E. (1999) The Phylogenetic position of Serratia, Buttiauxella and some other genera of the family Enterobacteriaceae. Int. J. Syst. Bacteriol., 49, 1433–1438. [DOI] [PubMed] [Google Scholar]
- 14.Haff L. and Smirnov,I. (1997) Single-nucleotide polymorphism identification assays using a thermostable DNA polymerase and delayed extraction MALDI-TOF mass spectrometry. Genome Res., 7, 378–388. [DOI] [PMC free article] [PubMed] [Google Scholar]
- 15.Gilles P., Wu,D., Foster,C., Dillon,P. and Chanock,S. (1999) Single nucleotide polymorphic discrimination by an electronic dot blot assay on semiconductor microchips. Nature Biotechnol., 17, 365–370. [DOI] [PubMed] [Google Scholar]
- 16.Welsh J. and McClelland,M. (1990) Fingerprinting genomes using PCR with arbitrary primers. Nucleic Acids Res., 18, 7213–7218. [DOI] [PMC free article] [PubMed] [Google Scholar]
- 17.Casa A., Brouwer,C., Nagel,A., Wang,L., Zhang,Q., Kresovich,S. and Wessler,S. (2000) The MITE family heartbreaker (Hbr): molecular markers in maize. Proc. Natl Acad. Sci. USA, 97, 10083–10089. [DOI] [PMC free article] [PubMed] [Google Scholar]
- 18.Mohrenweiser H., Larsen,R. and Neel,J. (1989) Development of molecular approaches to estimating germinal mutation rates. I. Detection of insertion/deletion/rearrangement variants in the human genome. Mutat. Res., 212, 241–252. [DOI] [PubMed] [Google Scholar]
- 19.Lisitsyn N., Lisitsyn,N. and Wigler,M. (1993) Cloning the differences between two complex genomes. Science, 259, 946–951. [DOI] [PubMed] [Google Scholar]
- 20.Rosenberg M., Przybylska,M. and Straus,D. (1994) ‘RFLP subtraction’: a method for making libraries of polymorphic markers. Proc. Natl Acad. Sci. USA, 91, 6113–6117. [DOI] [PMC free article] [PubMed] [Google Scholar]
- 21.Luo J.H., Puc,J.A., Slosberg,E.D., Yao,Y., Bruce,J.N., Wright,T.C.,Jr, Becich,M.J. and Parsons,R. (1999) Differential subtraction chain, a method for identifying differences in genomic DNA and mRNA. Nucleic Acids Res., 27, e24. [DOI] [PMC free article] [PubMed] [Google Scholar]


