

Abstract
We describe the haplotypic structure of the Interferon Regulatory Factor-1 (IRF-1) locus in two West African ethnic groups, Fulani and Mossi, that differ in their susceptibility and immune response to Plasmodium falciparum malaria. Both populations showed significant associations between IRF-1 polymorphisms and carriage of P. falciparum infection, with different patterns of association that may reflect their different haplotypic architecture. Genetic variation at this locus does not therefore account for the Fulani-specific resistance to malaria while it could contribute to parasite clearance's ability in populations living in endemic areas. We then conducted a case-control study of three haplotype-tagging Single Nucleotide Polymorphisms (htSNPs) in 370 hospitalized malaria patients (160 severe and 210 uncomplicated) and 410 healthy population controls, all from the Mossi ethnic group. All 3 htSNPs showed correlation with blood infection levels in malaria patients, and the rs10065633 polymorphism was associated with severe disease (p=0.02). These findings provide the first evidence of the involvement in malaria susceptibility of a specific locus within the 5q31 region, previously shown to be linked with P. falciparum infection levels.
Keywords: Malaria susceptibility, Fulani, Mossi, IRF-1, 5q31, association study
INTRODUCTION
Interferon Regulatory Factor 1 (IRF-1) is a transcription factor that regulates the expression of a number of genes whose products play crucial roles in innate as well as adaptive immunity (reviewed in ref. 1).
IFN-gamma is the strongest IRF-1 inducer known and IRF-1 promotes transcription of a number of genes, acting as an important mediator of IFN-gamma activity. The expression of IRF-1 can also be induced by TNF-alpha 2 and antagonized by IL-4 1. IRF-1 activity is essential for recognition of micro-organisms and antigen presentation, as it regulates the expression of genes such as Toll-like Receptor 9 3, MHC class I and class II genes 1, LMP2 1 and MECL1 4. IRF-1 is required for maturation of natural killer cells by regulating the transcription of IL-15 1, and it has a pivotal role in monocyte/macrophage differentiation 5. In macrophages it triggers the expression of iNOS 1, a principal mediator of cytotoxicity against pathogens, and Bf 6, part of the alternative complement cascade. Moreover, IRF-1 levels seem to be critical for T cell development in the thymus 1 as well as for B cell growth 7. IRF-1 triggers IL-2p40 expression 1 and represses IL-4 transcription 8, and it is therefore central in modulating the balance between Th1 and Th2-type T cell responses 1. IRF-1 is involved at many points of the immune response and as a consequence is likely to affect susceptibility to infectious diseases.
A role for this transcriptional regulator in both malaria mortality and parasite density has been suggested by studies of Plasmodium berghei infection conducted in IRF-1 knockout mice 9, 10 . Interestingly, the IRF-1 locus lies in the 5q31 human genome region, which contains a cluster of immunological genes encoding cytokines and growth factors , and has been therefore thought to play a role in the response to parasitic diseases. This has been investigated by linkage analysis studies that demonstrated the involvement of this gene region in the control of Plasmodium falciparum blood parasite densities 11 as well as of intensity of Schistosoma mansoni infection 12, but the P. falciparum infection level locus (Pfil) has not yet been narrowed down to a specific gene.
To determine whether genetic variation at the IRF-1 locus affects resistance to malaria infection in humans, and might therefore underlie the Pfil locus, we studied IRF-1 genetic diversity in two West African ethnic groups that show striking differences in their susceptibility and immune response to malaria, and conducted a candidate gene association study with carriage of P. falciparum infection. Despite equivalent exposure to infection and comparable use of protective measures, the Fulani are known to have lower malaria-parasite and fever-attack rates, and higher immune reactivity than sympatric Mossi and Rimaibé from Burkina Faso 13, 14, 15 and Dogon from Mali 16. The Fulani are genetically distinct from their neighbours 17 but carry known malaria-resistance alleles at a similar or even lower frequency than either sympatric groups 18. As a consequence these factors cannot be responsible for the increased malaria resistance observed in the Fulani. These ethnic groups therefore provide a unique model for the investigation of novel genetic determinants of the human response to malaria.
In parallel to this inter-ethnic study we also conducted a classical intra-ethnic case-control study where we compared the allele frequency of three haplotype-tagging SNPs (htSNPs) between healthy population controls, mild malaria cases and severe malaria cases of Mossi ethnicity, in order to evaluate the effect of IRF-1 polymorphisms on disease severity. We further assessed the involvement of IRF-1 genetic variation in the control of P. falciparum infection by looking at association with blood parasite densities in malaria patients.
RESULTS
Ethnic groups study
We have genotyped 14 Single Nucleotide Polymorphisms (SNPs) in a region extending from 5 kb upstream to 5 kb downstream of the IRF-1 gene in subjects from the Fulani and Mossi groups (parasite prevalence 31.0 ± 5.0% vs 60.4 ± 4.9% respectively, Yate's-corrected X2 = 14.8 p=0.0001). All SNPs were polymorphic in both populations, with high minor allele frequencies (MAF) (Table 1) with the average heterozygosity consequently also very high (HM = 0.49 and HF = 0.48). Two SNPs showed different frequencies among Fulani and Mossi (rs10213701: MAFM = 0.42; MAFF = 0.27, P = 0.004; rs2549005: MAFM = 0.49 MAFF = 0.34, P = 0.006). It is worth noting that the Fulani and Mossi have different geographical origins and migration history, and are likely to have been exposed to different environmental pressures, so demographic factors and selective pressure are both potential contributors to differences in allele frequency between the two populations.
Table 1.
IRF-1 Single Nucleotide Polymorphisms (SNPs) genotyped for the ethnic groups study and their frequency in Mossi and Fulani populations of Burkina Faso.
| SNP | Chr coord | Location | Alleles | FR % | HWE M | HWE F | MAF M | MAF F | P |
|---|---|---|---|---|---|---|---|---|---|
| rs3846731 | 131842163 | 3down | T/C | 4.2 | 0.85 | 0.66 | 0.51 | 0.42 | 0.105 |
| rs10065633 | 131844615 | 3down | T/C | 9.5 | 0.92 | 0.69 | 0.49 | 0.42 | 0.276 |
| rs839 | 131847025 | 3utr | C/T | 8.4 | 0.92 | 0.32 | 0.51 | 0.41 | 0.094 |
| rs2070729 | 131847820 | intronic | A/C | 5.2 | 0.70 | 0.71 | 0.31 | 0.39 | 0.174 |
| rs2070728 | 131847876 | intronic | C/T | 5.2 | 0.43 | 0.71 | 0.48 | 0.41 | 0.196 |
| rs2070727 | 131848174 | intronic | C/A | 7.4 | 0.84 | 0.80 | 0.50 | 0.42 | 0.204 |
| rs2070725 | 131849687 | intronic | C/T | 9.5 | 0.84 | 0.83 | 0.50 | 0.42 | 0.151 |
| rs2070724 | 131849971 | intronic | A/G | 5.3 | 0.84 | 0.71 | 0.51 | 0.41 | 0.078 |
| rs10213701 | 131851963 | intronic | A/T | 5.3 | 0.53 | 0.81 | 0.42 | 0.27 | 0.004 |
| rs2070722 | 131852385 | intronic | T/G | 9.5 | 0.70 | 0.81 | 0.52 | 0.42 | 0.074 |
| rs2706384 | 131854779 | 5up | C/A | 5.3 | 0.42 | 0.06 | 0.41 | 0.51 | 0.069 |
| rs2549005 | 131855090 | 5up | G/A | 4.2 | 0.76 | 0.70 | 0.49 | 0.34 | 0.006 |
| rs2549004 | 131855724 | 5up | G/C | 3.2 | 0.59 | 0.19 | 0.44 | 0.53 | 0.142 |
| rs2549002 | 131857477 | 5up | G/T | 5.3 | 0.96 | 0.38 | 0.41 | 0.47 | 0.293 |
Abbreviations: Chr coord, chromosome coordinate (as from dbSNP build 126); Location, location with respect to the IRF-1 gene; FR %, genotyping failure rate; HWE, Hardy-Weinberg Equilibrium test p value; MAF, Minor Allele Frequency; P, p value for the difference in allele frequency between the two populations; F, Fulani; M, Mossi.
Using the 14 typed SNPs (Table 1), we generated haplotypes across IRF-1 . In both the Fulani and Mossi two haplotype blocks (i.e. regions of high linkage disequilibrium (LD)) are identified within the gene (Figure 1): the first corresponding to the coding and the downstream regions, and the second to the upstream region. LD between the two blocks is slightly higher in the Mossi than in the Fulani (average r2M = 0.58 vs. r2F = 0.54) and that this is mainly due to marker rs2549005 (average r2M = 0.50 vs. r2F = 0.32). The haplotypic diversity (Table 2) across the region is described by a smaller number of haplotypes in the Fulani with respect to the Mossi (KF = 12 vs. KM = 19) and is captured by different sets of haplotype-tagging SNPs (htSNPs). Furthermore, the most common haplotypes (frequency > 0.5) have different frequencies in the two populations, and haplotypes exclusive to just one ethnic group also exist.
Figure 1. Linkage disequilibrium patterns and haplotype block structure of the IRF1 locus in Mossi and Fulani of Burkina Faso.

(a,b) LD patterns in the Mossi and Fulani samples respectively. Typed SNPs are represented on the horizontal axis and ordered by chromosome position as in Table 1. The linkage disequilibrium (r2) between each pair of markers is represented by differently coloured diamonds.
(c,d) Haplotype blocks in the Mossi and Fulani samples respectively.
Table 2. Haplotypes and haplotype-tagging SNPs of the IRF-1 locus in Mossi and Fulani of Burkina Faso.
a) Haplotype frequencies in Mossi and Fulani. The number of chromosomes carrying a given haplotype is shown in brackets. b) Entropy algorithm values for IRF-1 SNPs in Mossi and Fulani. HtSNPs are defined by en Entropy algorithm value > 0.
| a | |||
|---|---|---|---|
| Hap name | Hap | Freq % M | Freq % F |
| A | 22212222221211 | 37.6 (79) | 25.3 (41) |
| B | 11121111112122 | 22.9 (48) | 32.1 (52) |
| C | 11111111112122 | 11.9 (25) | 14.8 (24) |
| D | 22212222121111 | 7.6 (16) | 14.2 (23) |
| E | 11121111111211 | 5.2 (11) | 6.2 (10) |
| F | 11111111112121 | 4.3 (9) | 3.7 (6) |
| G | 11121111111122 | 2.4 (5) | 0.6 (1) |
| H | 22211222221211 | 1.0 (2) | 0.6 (1) |
| I | 11111111111121 | 0.5 (1) | 0.6 (1) |
| J | 22212222121211 | 1.9 (4) | 0.0 (0) |
| K | 22212222221212 | 1.0 (2) | 0.0 (0) |
| L | 11111111111122 | 0.5 (1) | 0.0 (0) |
| M | 11111111112222 | 0.5 (1) | 0.0 (0) |
| N | 11111112112122 | 0.5 (1) | 0.0 (0) |
| O | 11121222221211 | 0.5 (1) | 0.0 (0) |
| P | 21121111122122 | 0.5 (1) | 0.0 (0) |
| Q | 22211122221211 | 0.5 (1) | 0.0 (0) |
| R | 22212222122111 | 0.5 (1) | 0.0 (0) |
| S | 22212222221222 | 0.5 (1) | 0.0 (0) |
| T | 11111111112221 | 0.0 (0) | 0.6 (1) |
| U | 22111222221211 | 0.0 (0) | 0.6 (1) |
| V | 22212222112122 | 0.0 (0) | 0.6 (1) |
| b | ||
|---|---|---|
| SNP | Entropy M | Entropy F |
| rs3846731 | 0.03 | 0.00 |
| rs10065633 | 1.00 | 0.00 |
| rs839 | 0.00 | 0.01 |
| rs2070729 | 0.45 | 0.78 |
| rs2070728 | 0.09 | 0.15 |
| rs2070727 | 0.01 | 0.00 |
| rs2070725 | 0.00 | 0.00 |
| rs2070724 | 0.03 | 0.00 |
| rs10213701 | 0.13 | 0.00 |
| rs2070722 | 0.00 | 0.00 |
| rs2706384 | 0.19 | 1.00 |
| rs2549005 | 0.59 | 0.46 |
| rs2549004 | 0.01 | 0.00 |
| rs2549002 | 0.24 | 0.13 |
Abbreviations: Hap, haplotype; Freq, frequency; M, Mossi; F, Fulani.
We analysed association between these polymorphisms and carriage of P. falciparum infection, based on a cross-sectional epidemiological survey of 190 unrelated individuals over 10 years old, of which 85 were Fulani and 105 Mossi. As shown in Table 3, significant associations with carriage of P. falciparum infection were found in both populations but each showed a different pattern of association. This might possibly reflect the different haplotype architecture in the two groups. Interestingly, the two SNPs with greatest difference in frequency between Fulani and Mossi were not associated with carriage of P. falciparum infection.
Table 3.
Association of IRF-1 SNP genotypes with carriage of Plasmodium falciparum infection in Mossi and Fulani subjects from Burkina Faso (3×2 tables Yate's-corrected χ2 test p values).
| SNP | Mossi | Fulani |
|---|---|---|
| rs3846731 | 0.064 | 0.300 |
| rs10065633 | 0.043 | 0.190 |
| rs839 | 0.136 | 0.294 |
| rs2070729 | 0.354 | 0.096 |
| rs2070728 | 0.042 | 0.234 |
| rs2070727 | 0.071 | 0.240 |
| rs2070725 | 0.033 | 0.394 |
| rs2070724 | 0.038 | 0.234 |
| rs10213701 | 0.163 | 0.697 |
| rs2070722 | 0.140 | 0.135 |
| rs2706384 | 0.017* | 0.012* |
| rs2549005 | 0.080 | 0.523 |
| rs2549004 | 0.054 | 0.062 |
| rs2549002 | 0.444 | 0.001* |
Asterisk indicates a significant association after correction for multiple testing (p<0.020 and p<0.022 in the Mossi and Fulani respectively).
One IRF-1 promoter polymorphism, rs2706384, was associated with protection against P. falciparum infection in both populations (Table 4). Although the rs2706384 polymorphism appears to be a marker for protection against P. falciparum infection, it is evidently not responsible for the increased malaria resistance of the Fulani compared to the Mossi, as it has a similar allele frequency in both groups (0.41 and 0.51 respectively, Table 1) and when stratified for rs2706384 genotype the parasite rate remains lower in the Fulani than in the Mossi. Furthermore the pattern of association differs between the two populations: while in the Mossi the C allele is associated with a higher risk of carrying a P. falciparum infection (OR=1.92, 95% CI 1.02-3.63, p=0.04), this is not the case in the Fulani (OR=1.08, 95% CI 0.53-2.22, p=0.95). In fact in the latter group both CC and AA homozygous individuals are more frequently parasitized than heterozygous CA subjects. This observation further suggests that this polymorphism is not itself the cause of association but could be a marker for a non-genotyped functional SNP.
Table 4.
Plasmodium falciparum parasite rate (PR) according to IRF-1 rs2706384 genotype in Mossi and Fulani subjects from Burkina Faso.
| Genotype | PR Mossi | PR Fulani |
|---|---|---|
| CC | 78.4% (29/37) | 47.8% (11/23) |
| CA | 47.7% (21/44) | 13.3% (4/30) |
| AA | 56.2% (9/16) | 44.0% (11/25) |
| P | 0.017* | 0.012* |
Number of P. falciparum positive subjects and group sizes are shown in brackets. P values calculated by Yate's-corrected χ2 test.
Asterisk indicates a significant association after correction for multiple testing (p<0.020 and p<0.022 in the Mossi and Fulani respectively).
Genetic variation at this locus does not therefore account for the Fulani-specific resistance to malaria while it could contribute to parasite clearance's ability in populations living in endemic areas.
Case-control study
We genotyped three IRF-1 haplotype-tagging SNPs (htSNPs) in unrelated children of Mossi ethnicity comprising severe malaria cases (SMC), mild malaria cases (MMC), and healthy population controls (HPC). Among the 14 SNPs included in the Ethnic groups study we selected 3 markers that are htSNPs in the Mossi population: rs10065633, rs10213701 and rs2706384 (Table 2). They have been chosen on the basis of their gene location (5′ upstream, intronic, 3′ downstream respectively; Table 1) as well as on the basis of previous association results: association with carriage of parasite infection observed in the Mossi population in the Ethnic groups study (rs10065633 and rs2706384; Table 3) and association with severe malaria observed in Gambian trios (rs10213701; Mangano VD, manuscript in preparation). The three markers were in Hardy Weinberg equilibrium within each group of children (Table 5).
Table 5.
IRF-1 Single Nucleotide Polymorphisms (SNPs) genotyped for the case-control study and their frequency in Healthy Population Controls, Mild Malaria Cases and Severe Malaria Cases from Burkina Faso.
| Healthy Population Controls | Mild Malaria Cases | Severe Malaria Cases | ||||||
|---|---|---|---|---|---|---|---|---|
| SNP | Alleles | FR % | MAF | HWE | MAF | HWE | MAF | HWE |
| rs10065633 | T/C | 5.9 | 49.4±1.8 | 0.48 | 47.7±2.5 | 0.91 | 56.5±2.9 | 0.38 |
| rs10213701 | A/T | 4.7 | 33.6±1.7 | 0.78 | 35.1±2.4 | 0.52 | 40.2±2.8 | 0.71 |
| rs2706384 | C/A | 8.5 | 42.7±1.8 | 0.64 | 45.6±2.5 | 0.60 | 42.3±2.9 | 0.12 |
The 3 markers were selected among the initial 14 for being haplotype-tagging SNPs and/or showing an association signal in the Mossi population, as well as on the basis of their gene location (one 5′ upstream, one intronic, one 3′ downstream, see Table 1).
Abbreviations: FR %, genotyping failure rate; MAF, Minor Allele Frequency; HWE, Hardy-Weinberg Equilibrium test p value.
We compared the minor allele frequency of each polymorphism between the 3 groups to look for marker association with disease status (Figure 2). We observed that the C allele of rs10065633 has a higher frequency in the severe cases group than within the uncomplicated cases (p=0.03) or the healthy children (p=0.04) while the frequency does not vary between uncomplicated cases and healthy children (p=0.64). We could therefore compare the group of children with severe malaria with the group of children with no severe malaria (uncomplicated plus healthy). The C allele at this SNP is associated with severe disease, OR=1.36 (95% CI 1.04-1.78, p=0.02). A similar pattern is shown by the SNP rs10213701, where the T allele shows a trend of association with severe disease, OR=1.3 (95% CI 0.99-1.7, p=0.06). No association with disease status was observed for the SNP rs2706384.
Figure 2. Association of IRF-1 SNPs with disease severity in Burkina Faso subjects.
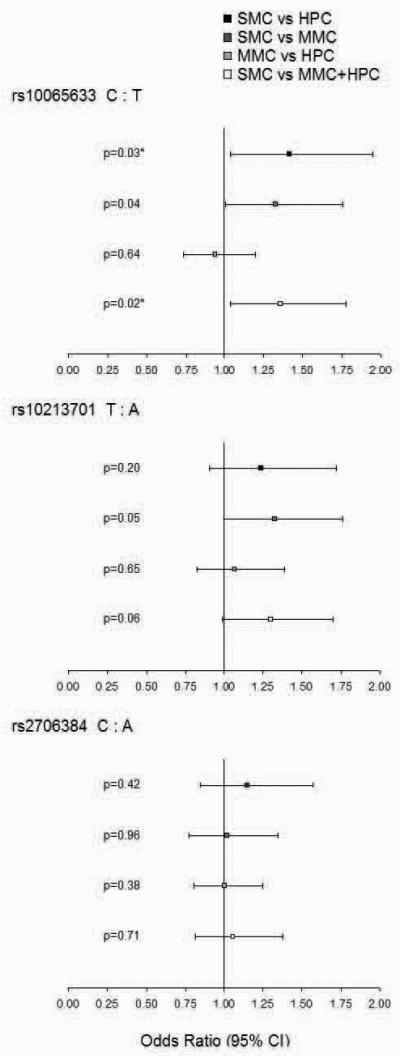
Comparison of Odds Ratios and p values for Yate's-corrected Chi-Squared test at three IRF-1 loci in: Severe Malaria Cases and Healthy Population Controls (black square); Severe Malaria Cases and Mild Malaria Cases (dark gray square); Mild Malaria Cases and Healthy Population Controls (light gray square); Severe Malaria Cases and children with no severe malaria (Mild Malaria Cases plus Healthy Population Controls; white square).
Asterisk (*) indicates a significant association after correction for multiple testing (p<0.033).
In the Ethnic groups study, in association analysis with carriage of malaria infection within the Mossi population, we observed that the C allele at SNP rs10065633 has higher frequency in infected individuals, OR=2.12 (95% CI 1.12-4.02, p=0.02); a similar trend was observed for the T allele at SNP 10213701 (although this marker shows no significant association, OR=1.52, 95% CI 0.81-2.86, p=0.2) and for the C allele at SNP rs2706384, OR=1.92 (95% CI 1.02-3.63, p=0.04).
In order to verify the contribution of IRF-1 genetic variation to the individual ability to control P. falciparum infection, we compared the blood infection levels of malaria patients (both severe and mild) between carriers and non-carriers of the susceptible alleles, adjusting for the effect of disease status and age. We defined as susceptible the alleles associated with severe disease in the Case-control study and/or with carriage of infection within the Mossi population in the Ethnic group study. These are allele C at SNP rs10065633, allele T at SNP rs10213701 and allele C at SNP rs2706384.
For each of the polymorphisms under study we observed that subjects carrying one or two copies of the susceptible alleles have higher mean parasite density, around two fold that of subjects who are homozygous for the resistant alleles (Figure 3). These differences were statistically significant for rs10065633 and rs10213701 SNPs only.
Figure 3. Association of IRF-1 SNPs with Plasmodium falciparum blood infection levels in malaria patients from Burkina Faso.
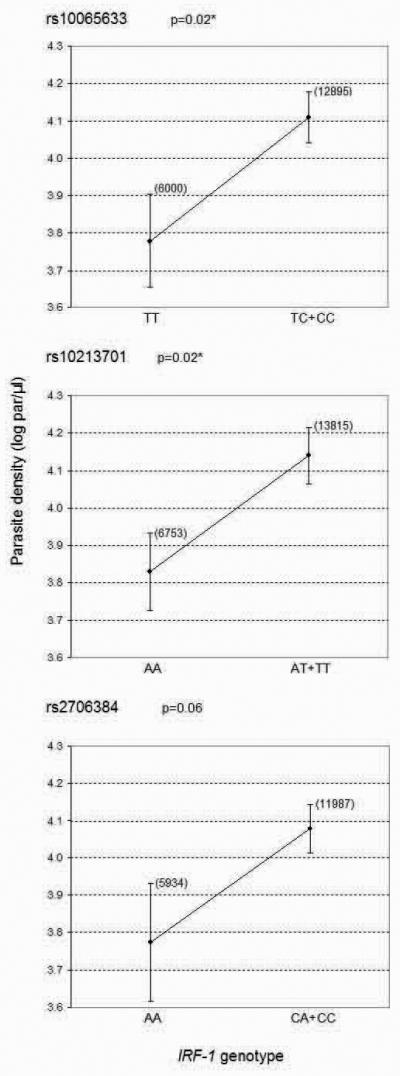
Means of parasite density (log transformed values) ± SE for three SNPs in the IRF-1 gene in carriers and non carriers of the susceptible allele. The geometric means of the parasite counts are shown in brackets. P value calculated by linear regression analysis adjusting for disease status and age. Asterisk (*) indicates a significant association after correction for multiple testing (p<0.033).
The same variants associated with higher risk of carrying a malaria infection in the Ethnic group study are associated with higher P. falciparum density in the Case-control study. We are aware that the phenotypes analysed in the two studies are different: in the first we looked at parasite prevalence as the study subjects are adults and therefore no much variability can be observed with regard to parasite density in this population group, while in the latter we looked at parasite density as all the malaria cases are by definition parasite positive. Nonetheless, as the results of the two studies are consistent with each other, the overall data suggest that IRF-1 genetic variation affects the individual ability to control P. falciparum infection.
Since the three polymorphisms show a very similar pattern of correlation with parasite density, and on the basis of the data from the Ethnic groups study we expect LD to be quite high between those markers, we applied linear regression analysis to evaluate the independence of the association signals. None of the markers was identified as an independent factor in the control of parasite density (data not shown).
We therefore built multi-marker haplotypes to look for haplotype association with blood infection levels (Table 6). We noted that carriage of Haplotype B (CTC), which we expected to be a risk haplotype as it is a combination of all susceptible alleles, results in an increased parasite load (mean parasite density [log par/μl] ± SE; non carriers: 3.9 ± 0.1; carriers: 4.2 ± 0.1; p=0.008).
Table 6.
Association of IRF-1 haplotypes with Plasmodium falciparum blood infection levels in malaria patients from Burkina Faso.
| Hap name | Hap | Freq | β | P |
|---|---|---|---|---|
| A | TAA | 43.6 | −0.144 | 0.231 |
| B | CTC | 30.4 | 0.288 | 0.008 |
| C | CAC | 10.6 | 0.109 | 0.429 |
| D | TAC | 8.2 | −0.104 | 0.493 |
| E | TTA | 3.1 | −0.043 | 0.851 |
| F | CAA | 1.8 | −0.370 | 0.248 |
| G | TTC | 1.9 | −0.115 | 0.680 |
| H | CTA | 0.4 | 0.000 | 1.000 |
Haplotypes identified in the case-control study (rs10065533, rs10213701, rs2706384) and their frequency within the group of malaria patients. Beta coefficients and p values obtained by linear regression analysis adjusting for disease status and age.
Abbreviations: Hap, haplotype; Freq, frequency.
DISCUSSION
Human populations exposed to malaria show high variability as regards to both clinical outcome and development of immune protection. We know that this heterogeneity depends on many factors such as age, transmission intensity, different parasite strains virulence, co-infections with other pathogens and socio-economic status as well as on the genetic background of the human host 19. A recent study to determine the relative contribution of genetic and other factors to the variability in malaria incidence in a cohort of Kenyan children, estimated that 25% of the total variation is explained by additively acting host genes and that haemoglobin S, the strongest known resistance genetic factor, explained only 2% of the total variation, suggesting the existence of many unknown protective genes, each individually having small population effects 20.
In the present investigation, in order to dissect the role of IRF-1 gene in susceptibility to malaria, we retrospectively analysed epidemiological data of two complementary studies conducted in Burkina Faso and based on cross-sectional parasitological surveys and case-control clinical studies. Both in Mossi and Fulani, the parasitological survey showed that IRF-1 genetic variation entails different abilities to control P. falciparum infection. The clinical study, while confirming the role of the IRF-1 gene in the control of malaria infection, did not provide coherent and convincing evidence of the involvement of this locus in the evolution of malaria as a disease. Indeed, only a trend of association with small differential risk of severe disease was suggested. Moreover, the possible effect on the clinical outcome did not involve the polymorphism that showed the strongest association signal in the parasitological study.
To our knowledge, this work provides the first evidence of a specific locus within the 5q31 region that is associated with the control of malaria infection, and raises the possibility that IRF-1 could be the Pfil locus. Linkage disequilibrium mapping of the Th2 cluster in the same ethnic groups sample-set also pinpoints to IRF-1 as the most relevant gene (Sadighi Akha E, manuscript in preparation). Nevertheless a recent genome-wide linkage analysis of malaria infection intensity yielded a signal on Chromosome 13q and did not obtain evidence for linkage of parasite density to 5q31 21, suggesting that a different locus, PFPD-2, could be the major genetic determinant of parasite density.
Although the effect of polymorphism at this locus is not large on its own, it may contribute to the complexity of each individual's susceptibility to malaria. Further dissecting this complexity will help to elucidate the mechanisms of immune protection against malaria and/or immunopathology.
Recent genetic association studies suggested a role for Interferon Regulatory Factor 1 in resistance to viral infections. An IRF-1 haplotype has been shown to protect from Hepatitis C in a Japanese population, and to modify promoter activity as measured by luciferase reporter assay 22. The authors suggested that this haplotype could affect the secondary structure of the promoter region, and therefore its affinity for transcription factors. IRF-1 transcriptional regulation is potentially critical given the short half-life of the IRF-1 protein 1. Actually it has been reported that this variant correlates with IFN-gamma and IL-10 levels produced by Peripheral Blood Mononuclear Cells (PBMCs), as well as with the percentage of Th1 CD4+ cells in patients with chronic Hepatitis C 23. IRF-1 polymorphisms have also been found to be associated with resistance to HIV-infection in a sample of Kenyan sex-workers 24; PBMCs isolated from subjects with protective genotypes showed a reduced expression of the gene, both before and after IFN-gamma stimulation, as measured by Western Blot analysis.
These observations provide possible functional explanations for our association findings, nevertheless none of these studies could identify the true causative polymorphism/s. Long-range haplotype analysis of Allele-Specific Transcript-Quantification data 25 is being used to uncover regulatory polymorphisms, and targeted functional experiments will be performed to determine how genetic variation affects the molecular mechanisms of immune responses to malaria.
The role of IRF-1 as a genetic determinant of human susceptibility to malaria is worthy of investigation in larger multi-centre studies of resistance/susceptibility to severe malaria 19.
PATIENTS AND METHODS
Study subjects
Ethnic groups study
The sample comprised 190 unrelated individuals aged > 10 years, 85 belonging to the Fulani (mean age ± SE; 29.8 ± 2.0 years) and 105 to the Mossi (39.2 ± 1.7 years) ethnic groups, who were recruited during a cross-sectional epidemiological survey conducted in August 1994 in the villages of Barkoumbilen and Barkoundouba, Northeast of Ougadougou, Burkina Faso 13. Rimaibè individuals were not included in the present study, because of their phenotypic and genetic similarity to the Mossi 13, 17. In spite of the lower mean age of the present Fulani sub-sample, higher P. falciparum infection rates were recorded amongst the Mossi.
Case-control study
The sample of severe (N=160, 4.4 ± 0.2 years) and uncomplicated malaria cases (N=210, 4.6 ± 0.2 years) from the Mossi ethnic group was recruited at the 158-bed Paediatric ward of the Ouagadougou University Hospital 25. In line with WHO guidelines, severe malaria was defined by the presence of Plasmodium falciparum in the thick blood film associated with at least one of the following conditions: prostration (incapacity of the child to sit without help in the absence of coma), unrousable coma (score between 0 and 2 on the Glasgow modified coma scale), repeated generalized convulsions (more than two episodes in the preceding 24 hours), severe anaemia (hemoglobin <5 g /dL), hypoglycemia (<40 mg/dL), pulmonary oedema/respiratory distress, spontaneous bleeding and renal failure (plasma creatinine > 3 mg/dL). Uncomplicated malaria was defined as a clinical illness characterised by an axillary temperature >37.5 °C associated with a P. falciparum positive blood film in the absence of clinical signs and symptoms of severe malaria. The sample of healthy control children also belonging to the Mossi ethnic group (N=410, 2.8 ± .06 years) was collected during malaria cross-sectional surveys performed in the Ouagadougou area 25. Both for malaria patients and healthy controls only unrelated children whose both parents were of Mossi ethnicity have been included in the study.
Plasmodium falciparum detection and density determination
Thick and thin blood smears were prepared following the standard procedures. According to WHO guidelines for the microscopic diagnosis of malaria (Bench Aids for the Diagnosis of Human Malaria; Plate 8, Methods of counting malaria parasites in Giemsa-stained thick blood films), 100 microscopic fields (ca. 20 leukocytes/field at 1000x = ca. 0.25 μl of blood) of the thick blood smear were examined for the determination of parasite density. The Plasmodium species was identified on the thin blood smear.
Genotyping and allele frequencies
SNPs in the region 5 kb upstream to 5 kb downstream of the IRF-1 gene were identified from public databases (dbSNP build 126, Ensemble release 40) and the literature.
For the ethnic groups study 14 polymorphisms were selected on the basis of the following criteria: validated status, overall coverage of the locus with regular spread (density of 1 SNP every 2 Kb on average), encompassing exonic, intronic, regulatory regions of the gene, possible functional effect of the allelic variant 20, 21. The genotypes for the selected polymorphisms were determined through the SEQUENOM© MassARRAY™ System 26, a high through-put procedure based on an allele-specific primer-extension reaction and mass spectrometry. Primers and multiplexes were designed using the dedicated software SpectroDESIGNER™ (SEQUENOM©).
For the case-control study 3 markers were selected among the initial 14 for being haplotype-tagging SNPs and/or showing an association signal in the Mossi population, as well as on the basis of their gene location (one 5′ upstream, one intronic, one 3′ downstream). Genotyping was performed by Amplification Refractory Mutation System (ARMS). Primers were designed using a dedicated on-line software (http://cedar.genetics.soton.ac.uk/public_html/primer1.html) 27. DNA samples whose genotype was determined by Sequenom MassArray System were used as positive controls for method validation. Primers and PCR conditions are available on request.
SNPs whose assays had a failure rate higher than 10% or were monomorphic (MAF < 0.01) have been excluded from further analysis. Hardy-Weinberg equilibrium has been tested using a threshold p value of 0.001, which aims to represent a compromise between the safe exclusion of most genotyping errors and the retention of potentially interesting (i.e. under selection) SNPs.
Haplotype structure and Linkage Disequilibrium architecture
Haplotypes have been constructed using the Stephens-Donnelly method 28 (PHASE v.2). Haplotype tagging SNPs (htSNPs) have been determined by an unstructured approach using the ENTROPY algorithm 29, which selects those SNPs that best describe the whole haplotypic diversity of the region. The algorithm starts by picking the most informative marker, which will be that with allele frequency closest to 0.5. It then repeatedly adds new markers from the set, each time choosing the one marker which most increases the logical entropy of the system. HtSNPs are defined by an Entropy value > 0.
Graphs showing Linkage Disequilibrium (LD) patterns have been generated using MARKER (http://www.gmap.net/perl/marker/marker_entry). Typed SNPs are represented on the horizontal axis and dots darkness represents the level of LD (r2) between each pair of markers.
Haplotypes blocks across the gene have been defined as regions in which pair-wise D′ values between all SNP pairs exceed the threshold of 0.8, using the program HaploBlockFinder 30.
Statistical Analysis
Statistical analysis has been performed using SPSS v14.00 and EpiInfo 2000. A p value of 0.05 has been considered as threshold for significance. Allele, genotype and haplotype distributions between groups have been compared by Yates-corrected χ2 test. If contingency tables had less than 5 expected events per cell, Fisher's exact test was used. To test marker and haplotype association with blood infection levels in malaria patients we used linear regression adjusted for disease status and age, after log-transformation of parasite densities. Linear regression analysis was also applied to evaluate the independence of association signals.
We applied a method to correct for multiple testing of SNPs in LD with each other 32, using an interface available online (http://genepi.qimr.edu.au/general/daleN/SNPSpD/). Based on spectral decomposition of matrices of pairwise LD between SNPs, the method determines the effective number of independent markers in the set tested (Meff). The corrected significance threshold required to keep Type I error rate at 5% is equal to 0.05/ Meff.
ACKNOWLEDGEMENTS
We dedicate this work to the memory of our dear friend and colleague Dr Gaia Luoni, whom we really miss and we would love to keep discussing the data with.
We are grateful to the villagers of Barkoumbilen and Barkoundouba, as well as to the hospitalised children and their families, for their very kind collaboration and participation to this study.
We are deeply indebted to the personnel of the Immuno-parasitology Unit of the Centre National del Rechèrche et Formation sur le Paludisme of Ouagadougou, Burkina Faso.
The authors would like to thank Dr Andrew Morris for statistical support, Dr Federica Verra for critical review of the manuscript and Prof Marita Troye-Blomberg for useful discussions and supervision of VD Mangano's PhD work.
The study was supported by the EU, Sixth Framework Programme, BIOMALPAR Network of Excellence, Contract Number N° LSHP-CT-2004-503578, by the Italian Ministry for University and Research (MIUR COFIN, 2003, 2006), by the Istituto Pasteur - Fondazione Cenci Bolognetti of the University of Rome “La Sapienza” and by the UK Medical Research Council.
REFERENCES
- 1.Kroger A, Koster M, Schroeder K, Hauser H, Mueller PP. Activities of IRF-1. J Interferon Cytokine Res. 2002;22:5–14. doi: 10.1089/107999002753452610. [DOI] [PubMed] [Google Scholar]
- 2.Imanishi D, Yamamoto K, Tsushima H, Miyazaki Y, Kuriyama K, Tomonaga M, et al. Identification of a novel cytokine response element in the human IFN regulatory factor-1 gene promoter. J Immunol. 2000;165:3907–3916. doi: 10.4049/jimmunol.165.7.3907. [DOI] [PubMed] [Google Scholar]
- 3.Guo Z, Garg S, Hill KM, Jayashankar L, Mooney MR, Hoelscher M, et al. A distal regulatory region is required for constitutive and IFN-beta-induced expression of murine TLR9 gene. J Immunol. 2005;175:7407–18. doi: 10.4049/jimmunol.175.11.7407. [DOI] [PubMed] [Google Scholar]
- 4.Foss GS, Prydz H. Interferon regulatory factor 1 mediates the interferon-gamma induction of the human immunoproteasome subunit multicatalytic endopeptidase complex-like 1. J Biol Chem. 1999;274:35196–35202. doi: 10.1074/jbc.274.49.35196. [DOI] [PubMed] [Google Scholar]
- 5.Manzella L, Conte E, Cocchiaro G, Guarniera E, Sciacca B, Bonaiuto C, et al. Role of interferon regulatory factor 1 in monocyte/macrophage differentiation. Eur J Immunol. 1999;29:3009–3016. doi: 10.1002/(SICI)1521-4141(199909)29:09<3009::AID-IMMU3009>3.0.CO;2-H. [DOI] [PubMed] [Google Scholar]
- 6.Huang Y, Krein PM, Winston BW. Characterization of IFN-gamma regulation of the complement factor B gene in macrophages. Eur J Immunol. 2001;31:3676–3686. doi: 10.1002/1521-4141(200112)31:12<3676::aid-immu3676>3.0.co;2-k. [DOI] [PubMed] [Google Scholar]
- 7.Yamada G, Ogawa M, Akagi K, Miyamoto H, Nakano N, Itoh S, et al. Specific depletion of the B-cell population induced by aberrant expression of human interferon regulatory factor 1 gene in transgenic mice. Proc Natl Acad Sci U S A. 1991;88:532–536. doi: 10.1073/pnas.88.2.532. [DOI] [PMC free article] [PubMed] [Google Scholar]
- 8.Elser B, Lohoff M, Kock S, Giaisi M, Kirchhoff S, Krammer PH, et al. IFN-gamma represses IL-4 expression via IRF-1 and IRF-2. Immunity. 2002;17:703–712. doi: 10.1016/s1074-7613(02)00471-5. [DOI] [PubMed] [Google Scholar]
- 9.Senaldi G, Shaklee CL, Guo J, Martin L, Boone T, Mak TW, et al. Protection against the mortality associated with disease models mediated by TNF and IFN-gamma in mice lacking IFN regulatory factor-1. J Immunol. 1999;163:6820–6826. [PubMed] [Google Scholar]
- 10.Tan RS, Feng C, Asano Y, Kara AU. Altered immune response of interferon regulatory factor 1-deficient mice against Plasmodium berghei blood-stage malaria infection. Infect Immun. 1999;67:2277–2283. doi: 10.1128/iai.67.5.2277-2283.1999. [DOI] [PMC free article] [PubMed] [Google Scholar]
- 11.Rihet P, Traore Y, Abel L, Aucan C, Traore-Leroux T, Fumoux F. Malaria in humans: Plasmodium falciparum blood infection levels are linked to chromosome 5q31-q33. Am J Hum Genet. 1998;63:498–505. doi: 10.1086/301967. [DOI] [PMC free article] [PubMed] [Google Scholar]
- 12.Marquet S, Abel L, Hillaire D, Dessein H, Kalil J, Feingold J, et al. Genetic localization of a locus controlling the intensity of infection by Schistosoma mansoni on chromosome 5q31-q33. Nat Genet. 1996;14:181–184. doi: 10.1038/ng1096-181. [DOI] [PubMed] [Google Scholar]
- 13.Modiano D, Petrarca V, Sirima BS, Nebie I, Diallo D, Esposito F, et al. Different response to Plasmodium falciparum malaria in west African sympatric ethnic groups. Proc Natl Acad Sci U S A. 1996;93:13206–13211. doi: 10.1073/pnas.93.23.13206. [DOI] [PMC free article] [PubMed] [Google Scholar]
- 14.Modiano D, Chiucchiuini A, Petrarca V, Sirima BS, Luoni G, Perlmann H, et al. Humoral response to Plasmodium falciparum Pf155/ring-infected erythrocyte surface antigen and Pf332 in three sympatric ethnic groups of Burkina Faso. Am J Trop Med Hyg. 1998;58:220–224. doi: 10.4269/ajtmh.1998.58.220. [DOI] [PubMed] [Google Scholar]
- 15.Modiano D, Chiucchiuini A, Petrarca V, Sirima BS, Luoni G, Roggero MA, et al. Interethnic differences in the humoral response to non-repetitive regions of the Plasmodium falciparum circumsporozoite protein. Am J Trop Med Hyg. 1999;61:663–667. doi: 10.4269/ajtmh.1999.61.663. MA. [DOI] [PubMed] [Google Scholar]
- 16.Dolo A, Modiano D, Maiga B, Daou M, Dolo G, Guindo H, et al. Difference in susceptibility to malaria between two sympatric ethnic groups in Mali. Am J Trop Med Hyg. 2005;72:243–8. [PubMed] [Google Scholar]
- 17.Modiano D, Luoni G, Petrarca V, Sodiomon Sirima B, De Luca M, Simpore J, et al. HLA class I in three West African ethnic groups: genetic distances from sub-Saharan and Caucasoid populations. Tissue Antigens. 2001;57:128–137. doi: 10.1034/j.1399-0039.2001.057002128.x. [DOI] [PubMed] [Google Scholar]
- 18.Modiano D, Luoni G, Sirima BS, Lanfrancotti A, Petrarca V, Cruciani F, et al. The lower susceptibility to Plasmodium falciparum malaria of Fulani of Burkina Faso (west Africa) is associated with low frequencies of classic malaria-resistance genes. Trans R Soc Trop Med Hyg. 2001;95:149–152. doi: 10.1016/s0035-9203(01)90141-5. [DOI] [PubMed] [Google Scholar]
- 19.Kwiatkowski DP. How malaria has affected the human genome and what human genetics can teach us about malaria. American Journal of Human Genetics. 2005;77:171–192. doi: 10.1086/432519. [DOI] [PMC free article] [PubMed] [Google Scholar]
- 20.Mackinnon MJ, Mwangi TW, Snow RW, Marsh K, Williams TN. Heritability of malaria in Africa. PLoS Medicine. 2005;2(12):e340. doi: 10.1371/journal.pmed.0020340. [DOI] [PMC free article] [PubMed] [Google Scholar]
- 21.Timmann C, Evans JA, König IR, Kleensang A, Rüschendorf F, Lenzen J, et al. Genome-wide linkage analysis of malaria infection intensity and mild disease. PLoS Genet. 2007;3(3):e48. doi: 10.1371/journal.pgen.0030048. [DOI] [PMC free article] [PubMed] [Google Scholar]
- 22.Saito H, Tada S, Ebinuma H, Wakabayashi K, Takagi T, Saito Y, et al. Interferon regulatory factor 1 promoter polymorphism and response to type 1 interferon. J Cell Biochem. 2001;81:191–200. doi: 10.1002/jcb.1084. [DOI] [PubMed] [Google Scholar]
- 23.Saito H, Tada S, Wakabayashi K, Nakamoto N, Takahashi M, Nakamura M, et al. The detection of IRF-1 promoter polymorphisms and their possible contribution to T helper 1 response in chronic hepatitis C. J Interferon Cytokine Res. 2002;22:693–700. doi: 10.1089/10799900260100196. [DOI] [PubMed] [Google Scholar]
- 24.Ball TB, Ji H, Kimani J, McLaren P, Marlin C, Hill AV, et al. Polymorphisms in IRF-1 associated with resistance to HIV-1 infection in highly exposed uninfected Kenyan sex workers. AIDS. 2007;21(9):1091–1101. doi: 10.1097/QAD.0b013e3280ef6ae1. [DOI] [PubMed] [Google Scholar]
- 25.Forton JT, Udalova IA, Campino S, Rockett KA, Hull J, Kwiatkowski DP. Localization of a long-range cis-regulatory element of IL13 by allelic transcript ratio mapping. Genome Res. 2007;17(1):82–7. doi: 10.1101/gr.5663007. [DOI] [PMC free article] [PubMed] [Google Scholar]
- 26.Modiano D, Luoni G, Sirima BS, Simpore J, Verra F, Konate A, et al. Haemoglobin C protects against clinical Plasmodium falciparum malaria. Nature. 2001;414:305–308. doi: 10.1038/35104556. [DOI] [PubMed] [Google Scholar]
- 27.Jurinke C, van den Boom D, Cantor CR, Koster H. Automated genotyping using the DNA MassArray technology. Methods Mol Biol. 2001;170:103–116. doi: 10.1385/1-59259-234-1:103. [DOI] [PubMed] [Google Scholar]
- 28.Ye S, Dhillon S, Ke X, Collins AR, Day INM. An efficient procedure for genotyping single nucleotide polymorphisms. Nucleic Acids Research. 2001;29:17e88. doi: 10.1093/nar/29.17.e88. [DOI] [PMC free article] [PubMed] [Google Scholar]
- 29.Stephens M, Smith NJ, Donnelly P. A new statistical method for haplotype reconstruction from population data. Am J Hum Genet. 2001;68:978–989. doi: 10.1086/319501. [DOI] [PMC free article] [PubMed] [Google Scholar]
- 30.Ackerman H, Usen S, Mott R, Richardson A, Sisay-Joof F, Katundu P, et al. Haplotypic analysis of the TNF locus by association efficiency and entropy. Genome Biol. 2003;4:R24. doi: 10.1186/gb-2003-4-4-r24. [DOI] [PMC free article] [PubMed] [Google Scholar]
- 31.Zhang K, Jin L. HaploBlockFinder: haplotype block analyses. Bioinformatics. 2003;19:1300–1301. doi: 10.1093/bioinformatics/btg142. [DOI] [PubMed] [Google Scholar]
- 32.Nyholt DR. A simple correction for multiple testing for single-nucleotide polymorphisms in linkage disequilibrium with each other. Am J Hum Genet. 2004;74:765–769. doi: 10.1086/383251. [DOI] [PMC free article] [PubMed] [Google Scholar]