Abstract
Rationale and Objectives
A reporter or marker gene that is detectable by in vivo imaging permits longitudinal monitoring of certain fundamental biological processes (eg, differentiation) within the context of physiologically authentic environments. Tissue-specific expression of a reporter gene can be achieved when it is under the transcriptional control of a tissue-specific promoter. The objective of this study was to construct a plasmid vector containing firefly luciferase (Fluc) marker gene downstream of the promoter sequence of rat ventricular myosin light chain 2 (MLC2v); to detect the in vivo expression of this cardiac-specific reporter (MLC2v-Fluc) in the mouse heart by bioluminescent imaging; and to correlate the bioluminescent signal with postmortem luminometer assay.
Materials and Methods
MLC2v-Fluc plasmid was generated by molecular cloning of 3 kb promoter sequence into a pGL3-Basic vector containing the Fluc reporter. Twenty μg of MLC2v-Fluc plasmid DNA in phosphate-buffered saline was directly injected into mouse myocardium through a midline sternotomy.
Results
At 1 week after injection, MLC2v-Fluc expression was detected by in vivo bioluminescent imaging in 60% of injected animals; the average in vivo signal intensity was (1.5 ± 0.6) × 104 radiance (p/sec/cm2/sr); in vivo signal was well above the detection threshold over 3 weeks after injection. In vivo bioluminescent signal is correlated (r2 = 0.8) with the luminometer assay results from homogenized heart samples.
Conclusion
The capability of noninvasive imaging of the MLC2v-Fluc in the heart will encourage applications that aim at monitoring and tracking the marker gene expression over time in cells undergoing cardiac differentiation.
Keywords: Cardiac ventricular myosin light chain 2 (MLC2v), bioluminescence, luciferase, cardiac, reporter gene
Reporter (or marker) genes whose expression can be detected in vivo by noninvasive imaging modalities hold great promise for longitudinal monitoring of certain fundamental biological processes in a live animal. Reporter genes for various in vivo imaging modalities have been developed, for example, green fluorescent protein (1,2) and firefly luciferase (Fluc) (3) for optical imaging, herpes simplex virus type 1 thymidine kinase (4,5) for positron emission tomography (PET) and single photon emission computerized tomography (SPECT), transferrin (6) for proton (1H) magnetic resonance and creatine kinase (7) for phosphorus-31 (31P) magnetic resonance detection. Fluc has been frequently used as a reporter gene in animal models for cardiac research. The Fluc expression level can be sensitively quantified by luminometer assay (down to 10−20 mol or 0.001 pg) (8). Fluc expression was usually quantified in postmortem heart samples from dogs (9), rabbits (10), and rats and mice (11,12). With the advent of optical imaging system using a coupled charge device camera, in vivo detection of Fluc reporter in the rat heart has been reported (13).
The most commonly used promoters for transcriptional control of the Fluc expression are of viral origin (such as promoter of cytomegalovirus, CMV) because they are thought to be constitutively active and minimally regulated by physiological processes in cells. Therefore, the viral promoter drives a nontissue-specific expression of the reporter. One caveat associated with this type of promoter is the generation of interfering signals from other tissues even when the marker gene was delivered to the target tissue. For example, when the adenoviral vector containing CMV-Fluc was injected in the heart, Fluc expression was also detected in the liver, which took up the adenovirus that escaped from the heart through circulation (13). If the reporter gene is controlled by a cellular promoter specific to cardiomyocytes, this promoter will confer cardiac specificity to the reporter gene, therefore, interfering signals from other tissues can be eliminated or reduced substantially. More importantly, a cardiac-specific marker gene will be able to report the cardiac-differentiation of non-cardiomyocytes (eg, stem cells). Therefore, if in vivo detection of its expression can be achieved, the cardiac-specific marker gene will have great utility for in vivo monitoring of cardiac differentiation during development or cellular cardiomyoplasty.
Cardiac ventricular isoform of the myosin light chain 2 (MLC2v) gene has been used for identification of signaling pathways that regulate the embryonic heart development. MLC2v gene expression can be detected as early as 8 days postcoitum (14); in the adult rodent heart, MLC2v mRNA is expressed exclusively in the ventricular chamber and is not detectable in the atrium (15). Here we have fused the 3-kbp promoter sequence of MLC2v with Fluc reporter and showed the in vivo detection of this cardiac-specific reporter in the heart of live mice.
MATERIALS AND METHODS
Plasmid Construction
A 3.0 kb EcoRI fragment of rat MLC-2v 5′ flanking region with promoter and transcriptional start site (16) was a generous gift from Dr Robert Ross at the University of California-Los Angeles. To generate pMLC2v-Fluc vector, the above EcoRI fragment was filled with Klenow enzyme and then ligated into the Smal site of pGL3-Basic vector (Promega, Madison WI) through a blunted ligation.
The resultant vector was digested by HindIII and XbaI restriction enzymes and three fragments of approximately 3.2 kb, 3.0 kb, and 1.6 kb were identified corresponding to the vector backbone, 3.0 kb promoter and Fluc sequence, respectively. Thus, the generation of pMLC3v-Fluc vector was confirmed.
Myocardial Injection of Plasmid DNA
CD-1 or C57/B6 (both purchased from Jackson Laboratory, Bar Harbor, ME) mice were anesthetized by inhalation of 1% isoflurane mixed with oxygen from a gas anesthetics chamber (VetEquip Inc, Pleasanton, CA) and subsequently intubated with an 18-gauge angiocath and mechanically ventilated (model-697 ventilator; Harvard Apparatus, Holliston, MA). Body temperature was maintained at 37°C with a heating pad plus a heating lamp. A midline sternotomy was performed under sterile technique. Twenty μg plasmid DNA in 10–20 μL phosphate-buffered saline (depending on the concentration of plasmid) or the same volume of phosphate-buffered saline alone was injected into the anteriolateral wall of the left ventricle using a 30-gauge needle. Plasmid DNA containing MLC2v-Fluc, or pSV40-Fluc (Promega, Madison, WI) as positive control, or a promoterless Fluc (pGL3-Basic vector) as a negative control was injected. To test its tissue specificity, MLC2v-Fluc (20 μg) was also injected into the liver parenchyma or the leg quadriceps femoris muscle of different mice. Surgery and postsurgical care were performed in accordance with the guidelines of the American Association for Accreditation of Laboratory Animal Care (AAALAC) and approved in advance by the Institutional Animal Care and Use Committee (IACUC) of the University of Pennsylvania.
In Vivo Bioluminescence Imaging
Imaging was performed at day 7, 14, and 21 after injection of the plasmid. At the time of imaging, mice were anesthetized with 66/6.6 mg/kg ketamine/acepromazine. D-luciferin (Biotium, Hayward, CA) was dissolved in saline in 25 mg/mL and was injected intraperitoneally at a dose of 125 mg/kg body weight before imaging. The mice were then placed in the imaging chamber, in which the temperature was maintained around 33°C. Bioluminescent images were acquired from Xenogen in vivo Imaging System (IVIS; Xenogen Corp, Alameda, CA). Imaging parameters include field of view 8 or 10 cm, exposure time of 4 minutes, number of binning 16, and f1/stop of 1. For display, the luminescent image (pseudocolor) was overlaid on a photographic image, which shows the anatomic landmarks.
Signal to Noise Ratio Measurement
The in vivo luminescent image was displayed in “photon” mode, therefore, the signal intensity is represented by radiance (p/sec/cm2/sr), which refers to the number of photons per second that are leaving a square centimeter of tissue and radiating into a solid angle of one steradian (sr). The signal-to-noise ratio (SNR) was determined as the ratio between the average signal from the region of interest placed on the left thoracic region and that placed on the right lower abdomen. Average signal in photon mode is referred as “average radiance” and is the sum of the radiance from each pixel inside the region of interest divided by the number of pixels.
Luminometry Assay
After the mice were sacrificed, the heart, liver, and leg muscle were exercised and frozen in liquid nitrogen. The frozen tissue was pulverized into powder with a piston, and then ground with a mortar and pestle that are cooled in liquid nitrogen. The powder was weighed and stored at −80°C. Upon analysis, the powder was thawed and 500 μL of lysis buffer (Promega) was added. The sample was vortexed for 15 minutes, frozen and thawed three times using alternating liquid nitrogen and 37°C water bath, and centrifuged for 3 minutes at 10,000 × g. The supernatant was transferred to another tube (1.5 mL) and the extraction process was repeated after adding another 500 μL lysis buffer; the supernatant was then combined (approximately 1 mL total) for protein assay and luminometer reading. The amount of proteins in the sample was quantified using a Micro BCA protein assay kit (Pierce, Rockford, IL) on a Power Wave 340 microplate spectrophotometer (Bio-Tek Instruments, Winooski, Vermont) following the manufacturer's instructions. A Lumat LB 9501 tube luminometer (Berthold Technologies, Bad Wildbad, Germany) was used for the luciferase quantification. One hundred μL of luciferase substrate was added by the injector to 20 μL extract supernatant, and relative light unit was recorded for 10 seconds after the substrate addition. The amount of luciferase was expressed as relative light unit normalized to the amount of tissue proteins.
RESULTS
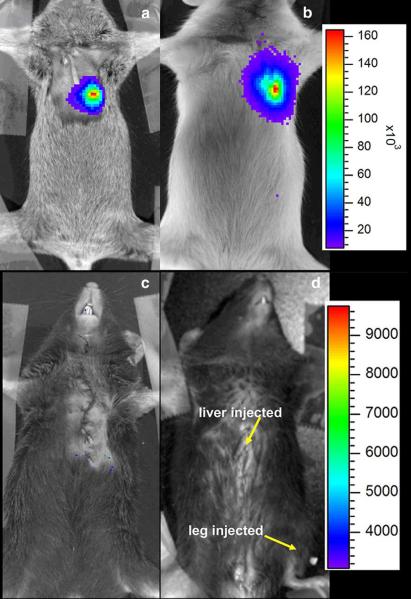
Figure 1 shows in vivo detection of Fluc expression in mice. MLC2v-Fluc (a) and SV40-Fluc (b) expression was detected in the left thoracic region. In contrast, no expression was detected in mice receiving plasmids containing promoter-less Fluc, ie, a pGL3-Basic vector (c). The images were acquired approximately 10 days after injection. Detection of SV40-Fluc expression serves as a positive control because, as a promoter of viral origin, SV40 is thought to drive a strong and ubiquitous expression. MLC2v-Fluc expression was not detected in the liver or skeletal muscle in the leg, where both received an equal amount of plasmid as the heart.
Figure 1.
In vivo detection of the Fluc marker gene in the mouse heart. The mouse heart was injected with DNA plasmid containing MLC2v-Fluc (a), SV40-Fluc (b), or promoter less Fluc (c). The mouse in (d) was injected with 20 μg of MLC2v-Fluc plasmid in both the liver and leg muscle. The luminescent image (pseudocolor) was overlaid on the photographic image. The color bars represent bioluminescent signal in radiance (p/sec/cm2/sr); the upper color bar is for panels a and b, while the one on the bottom is for panels c and d. The images were taken approximately 10 days after injection.
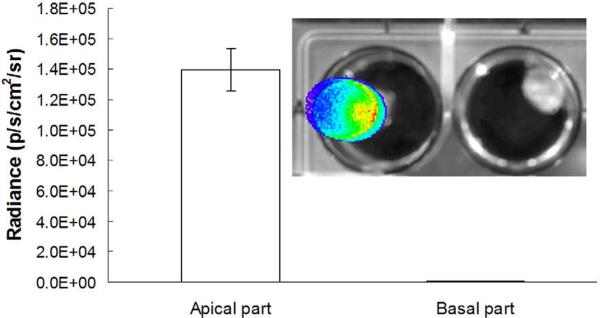
The Fluc expression in the heart was confirmed by ex vivo imaging. Upon removal from the host, the heart was cut in half along the cardiac short axis. Figure 2 shows an intense signal detected from the apical half (left well), whereas no signal was detected from the basal half of the heart (inset image). This is consistent with the fact that the plasmid was injected in the apex region of the heart. The average ex vivo signal is about 2–10-fold stronger than the in vivo signal, suggesting the absorption by overlaying tissues (eg, chest wall, skin) and blood in the ventricles. This is consistent with the observation that signal intensity from the heart was weaker than that from the superficial tissue, such as a subcutaneous tumor (17).
Figure 2.
Ex vivo imaging of an excised heart (apical half on the left, basal half on the right) for localization of the signal. The heart was removed after in vivo imaging, rinsed with saline, and cut along the cardiac short axis into half. The two halves were briefly immersed in D-luciferin solution (4 mg/mL) before imaging. The data in the bar graph represent mean ± SD bioluminescence in the apical and basal heart from three mice.
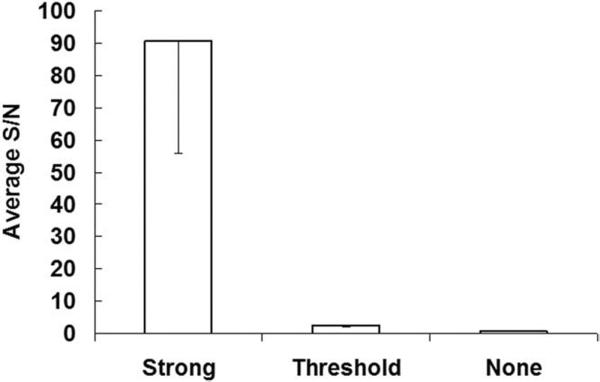
The expression level of MLC2v-Fluc in hearts was found to vary substantially but could be categorized as “strong,” “threshold,” and “none” according to the SNR (Fig 3). In the “none” group, the SNR is close to unity. In the “threshold” group, however, the signal from the heart was above the background with an average SNR of 3 (± 0.6). In the “strong” group, the signal was well above the background with an average SNR of 91 (± 35).
Figure 3.
MLC2v-Fluc expression detected by bioluminescence according to the SNR.
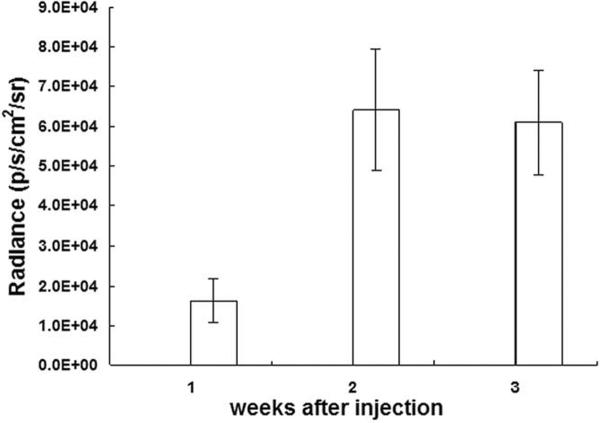
Figure 4 shows the time course of in vivo bioluminescence signal from the “strong” group. The MLC2v-Fluc expression was detected by in vivo bioluminescence imaging 1 week after injection; in vivo signal was increased slightly and remained relative stable for at least 2 weeks. At 1 week after injection, the average in vivo signal intensity was (1.5 ± 0.6) × 104 radiance (p/sec/cm2/sr) from the “strong” group; (4.5 ± 2.0) × 103 for the “threshold” group, and (1.3 ± 0.7) × 103 for the “none” group (Table).
Figure 4.
The magnitude and time course of the in vivo bioluminescent signal. MLC2v-Fluc expression can be monitored noninvasively and repetitively over 3 weeks after injection of plasmid.
Table.
Cardiac MLC2v-Fluc Expression Detected by In Vivo Bioluminescence and by Luminometer 1 Week After Injection
| Bioluminescence Radiance (p/s/cm2/sr) | Luminometer Assay (RLU/mg Tissue Protein) | |
|---|---|---|
| Strong | 1.48 (± 0.63) × 104 | 5.98 (± 2.39) × 106 |
| Threshold | 4.47 (± 0.20) × 103 | 1.29 (± 0.24) × 105 |
| None | 1.28 (± 0.73) × 103 | 5.21 (± 5.50) × 103 |
NOTE.—Data are expressed as mean (±SD) averaged from 3–5 animals in each group.
The expression level of MLC2v-Fluc reporter was further quantified by luminometer assay performed on homogenized hearts in the above three groups 1 week after injection (Table). The luminometer assay results suggest that the expression level from the “strong” group is about 50-fold higher than that of the “threshold” group, which can only be marginally detected in vivo; however, luminometer assay indicates its expression level is over 20-fold higher than the “none” group.
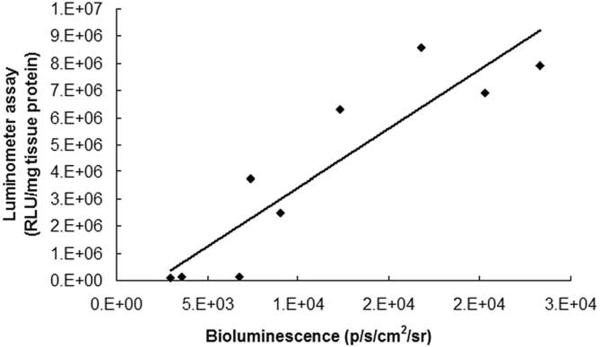
It was found that for the “strong” and “threshold” groups, the linear correlation between the in vivo signal and in vitro quantification was strong with a coefficient of determination (r2) of 0.8 (Fig 5). Therefore, when in vivo signal intensity is above the “threshold,” it is proportional to the level of Fluc expression. In contrast, for the “none” group, there is no correlation between the in vivo signal and luminometer assay results, suggesting that the in vivo signal is too weak (immersed in the noise) to be a meaningful indicator of the gene expression.
Figure 5.
Correlation between in vivo bioluminescence signal (x axis, radiance p/s/cm2/sr) and luminometer assay (y axis, relative light unit/mg tissue protein). Coefficient of determination (r2) of 0.8 was obtained (n = 9 samples).
DISCUSSION
We have shown for the first time the in vivo detection of a cardiac specific reporter gene (MLC2v-Fluc) in mice. The in vivo luminescent signal intensity was correlated with the level of Fluc expression determined by the luminometry. The level of expression was stable and was well above the detection threshold for over 3 weeks after injection. Although in vivo observation in our study was limited to 3 weeks, expression of MLC2v-fluc for 8 weeks assessed by postmortem luminometer assay has been previously reported (11). Compared with fluorescent signal, which is often overwhelmed by auto-fluorescence from the same tissue, luminescence has little background signal, which contributes to the relatively high sensitivity of bioluminescence. The high sensitivity and long expression window of MLC2v-Fluc suggest that this noninvasive method can be used to monitor the differentiation during the heart development or report the cardiac differentiation of stem cells.
Both viral vector and nonviral methods have been reported for transfection of myocardium. Adenovirus can transfect the cardiomyocytes with a relatively high efficiency, however, it is preferentially taken up by the liver (18). If administered systemically, most viruses will be absorbed in the liver, resulting in transfection of over 90% hepatocytes (7); direct cardiac injection may enhance the heart uptake, although leakage to the liver through circulation seemed unavoidable (13). Adenoviral vector containing a cardiac-specific marker gene may help eliminate the interfering signal from the liver. Among the nonviral methods, direct injection of plasmid DNA has been proven as a rather efficient way for transfection of myocardium (11,12). The mechanism underlying the efficient absorption of injected DNA by myocardium is unclear, but this ability seems to be restricted to striated muscles. To test the feasibility of in vivo detection of MLC2v-Fluc, we injected the plasmid DNA directly into the mouse heart. The mortality caused by the surgical procedure of intramyocardial injection is consistently low (13%; n = 30). Approximately 60% of the injected mice have shown “strong” in vivo signaling; injection was missed in 20% of the injected mice (the “none” group), and the remaining 20% of injected mice have shown the in vivo signal on the “threshold” level. It was reported by Li et al (11) that the expression of the reporter gene was observed in 100% of the injected mice. However, postmortem luminometer assay was used to detect the gene expression in the above study. Because of the absorption of luminescent signal by the overlaying tissues in chest wall and blood in the ventricles, the threshold for in vivo detection is expected to be much higher than for the luminometer assay. The bioluminescent signal from the “threshold” group is just above the detection limit, whereas the luminometer assay from this group is 20-fold higher than the “none” group. This suggests that bioluminescent signal from the heart was attenuated at least 20-fold because of absorptions. The relative low Fluc expression in the “threshold” group is likely due to a partially missed injection or other reasons (eg, the shear force generated during cardiac contraction may reduce the uptake of the plasmid). However, the purpose of this study is not to examine the method of direct plasmid injection. Rather, direct injection provides a simple way to show the feasibility of in vivo detection of the cardiac-specific reporter gene expression. The transfection efficiency can be increased significantly when a viral vector is used.
The full length of the promoter sequence of the MLC2v gene is 3 kb (15,16). Previous studies have identified fragments of the promoter with 250 bp (15) or various other lengths (15,19,20). Those fragments seemed also to confer cardiac specific expression of reporter genes including Fluc and EGPF, which have been used to study gene regulations during cardiac development and differentiation (15,19,21). However, no in vivo detection of a cardiac specific marker has been reported before. The capability of noninvasive imaging of the MLC2v-Fluc in the heart will encourage applications that aim at monitoring and tracking the marker gene expression over time in cells undergoing cardiac differentiation.
ACKNOWLEDGMENT
The authors thank Yanping Li for technical assistance.
Supported by grant EB-002473 from the National Institutes of Health
REFERENCES
- 1.Ponomarev V, Doubrovin M, Serganova I, et al. Cytoplasmically retargeted HSV1-tk/GFP reporter gene mutants for optimization of noninvasive molecular-genetic imaging. Neoplasia. 2003;5:245–254. doi: 10.1016/S1476-5586(03)80056-8. [DOI] [PMC free article] [PubMed] [Google Scholar]
- 2.Ray P, De A, Min JJ, Tsien RY, Gambhir SS. Imaging tri-fusion multi-modality reporter gene expression in living subjects. Cancer Res. 2004;64:1323–1330. doi: 10.1158/0008-5472.can-03-1816. [DOI] [PMC free article] [PubMed] [Google Scholar]
- 3.Contag PR, Olomu IN, Stevenson DK, Contag CH. Bioluminescent indicators in living mammals. Nat Med. 1998;4:245–247. doi: 10.1038/nm0298-245. [DOI] [PubMed] [Google Scholar]
- 4.Gambhir SS, Bauer E, Black ME, et al. A mutant herpes simplex virus type 1 thymidine kinase reporter gene shows improved sensitivity for imaging reporter gene expression with positron emission tomography. Proc Natl Acad Sci U S A. 2000;97:2785–2790. doi: 10.1073/pnas.97.6.2785. [DOI] [PMC free article] [PubMed] [Google Scholar]
- 5.Tjuvajev JG, Joshi A, Callegari J, et al. A general approach to the noninvasive imaging of transgenes using cis-linked herpes simplex virus thymidine kinase. Neoplasia. 1999;1:315–320. doi: 10.1038/sj.neo.7900053. [DOI] [PMC free article] [PubMed] [Google Scholar]
- 6.Weissleder R, Moore A, Mahmood U, Bhorade R, Benveniste H, Chiocca EA, Basilion JP. In vivo magnetic resonance imaging of trans-gene expression. Nat Med. 2000;6:351–355. doi: 10.1038/73219. [DOI] [PubMed] [Google Scholar]
- 7.Auricchio A, Zhou R, Wilson JM, Glickson JD. In vivo detection of gene expression in liver by 31P nuclear magnetic resonance spectroscopy employing creatine kinase as a marker gene. Proc Natl Acad Sci U S A. 2001;98:5205–5210. doi: 10.1073/pnas.081508598. [DOI] [PMC free article] [PubMed] [Google Scholar]
- 8.Stanely P, Kricka L, editors. Bioluminescence and Chemiluninescence: Current Status. John Wiley and Sons; Chichester, NY: 1991. [Google Scholar]
- 9.von Harsdorf R, Schott RJ, Shen YT, Vatner SF, Mahdavi V, Nadal-Ginard B. Gene injection into canine myocardium as a useful model for studying gene expression in the heart of large mammals. Circ Res. 1993;72:688–695. doi: 10.1161/01.res.72.3.688. [DOI] [PubMed] [Google Scholar]
- 10.Gal D, Weir L, Leclerc G, Pickering JG, Hogan J, Isner JM. Direct myocardial transfection in two animal models. Evaluation of parameters affecting gene expression and percutaneous gene delivery Lab Invest. 1993;68:18–25. [PubMed] [Google Scholar]
- 11.Li K, Welikson RE, Vikstrom KL, Leinwand LA. Direct gene transfer into the mouse heart. J Mol Cell Cardiol. 1997;29:1499–1504. doi: 10.1006/jmcc.1997.0389. [DOI] [PubMed] [Google Scholar]
- 12.Buttrick PM, Kass A, Kitsis RN, Kaplan ML, Leinwand LA. Behavior of genes directly injected into the rat heart in vivo. Circ Res. 1992;70:193–198. doi: 10.1161/01.res.70.1.193. [DOI] [PubMed] [Google Scholar]
- 13.Wu JC, Inubushi M, Sundaresan G, Schelbert HR, Gambhir SS. Optical imaging of cardiac reporter gene expression in living rats. Circulation. 2002;105:1631–1634. doi: 10.1161/01.cir.0000014984.95520.ad. [DOI] [PubMed] [Google Scholar]
- 14.O'Brien TX, Lee KJ, Chien KR. Positional specification of ventricular myosin light chain 2 expression in the primitive murine heart tube. Proc Natl Acad Sci U S A. 1993;90:5157–5161. doi: 10.1073/pnas.90.11.5157. [DOI] [PMC free article] [PubMed] [Google Scholar]
- 15.Lee KJ, Ross RS, Rockman HA, et al. Myosin light chain-2 luciferase transgenic mice reveal distinct regulatory programs for cardiac and skeletal muscle-specific expression of a single contractile protein gene. J Biol Chem. 1992;267:15875–15885. [PubMed] [Google Scholar]
- 16.Henderson SA, Spencer M, Sen A, Kumar C, Siddiqui MA, Chien KR. Structure, organization, and expression of the rat cardiac myosin light chain-2 gene. Identification of a 250-base pair fragment which confers cardiac-specific expression. J Biol Chem. 1989;264:18142–18148. [PubMed] [Google Scholar]
- 17.Wu JC, Sundaresan G, Iyer M, Gambhir SS. Noninvasive optical imaging of firefly luciferase reporter gene expression in skeletal muscles of living mice. Mol Ther. 2001;4:297–306. doi: 10.1006/mthe.2001.0460. [DOI] [PubMed] [Google Scholar]
- 18.Franz WM, Rothmann T, Frey N, Katus HA. Analysis of tissue-specific gene delivery by recombinant adenoviruses containing cardiac-specific promoters. Cardiovasc Res. 1997;35:560–566. doi: 10.1016/s0008-6363(97)00154-5. [DOI] [PubMed] [Google Scholar]
- 19.Franz WM, Breves D, Klingel K, Brem G, Hofschneider PH, Kandolf R. Heart-specific targeting of firefly luciferase by the myosin light chain-2 promoter and developmental regulation in transgenic mice. Circ Res. 1993;73:629–638. doi: 10.1161/01.res.73.4.629. [DOI] [PubMed] [Google Scholar]
- 20.Phillips MI, Tang Y, Schmidt-Ott K, Qian K, Kagiyama S. Vigilant vector: Heart-specific promoter in an adeno-associated virus vector for cardioprotection. Hypertension. 2002;39:651–655. doi: 10.1161/hy0202.103472. [DOI] [PubMed] [Google Scholar]
- 21.Meyer N, Jaconi M, Landopoulou A, Fort P, Puceat M. A fluorescent reporter gene as a marker for ventricular specification in ES-derived cardiac cells. FEBS Lett. 2000;478:151–158. doi: 10.1016/s0014-5793(00)01839-1. [DOI] [PubMed] [Google Scholar]


