

Abstract
The computational study of human metabolism has been advanced with the advent of the first generic (non-tissue specific) stoichiometric model of human metabolism. In this study, we present a new algorithm for rapid reconstruction of tissue-specific genome-scale models of human metabolism. The algorithm generates a tissue-specific model from the generic human model by integrating a variety of tissue-specific molecular data sources, including literature-based knowledge, transcriptomic, proteomic, metabolomic and phenotypic data. Applying the algorithm, we constructed the first genome-scale stoichiometric model of hepatic metabolism. The model is verified using standard cross-validation procedures, and through its ability to carry out hepatic metabolic functions. The model's flux predictions correlate with flux measurements across a variety of hormonal and dietary conditions, and improve upon the predictive performance obtained using the original, generic human model (prediction accuracy of 0.67 versus 0.46). Finally, the model better predicts biomarker changes in genetic metabolic disorders than the generic human model (accuracy of 0.67 versus 0.59). The approach presented can be used to construct other human tissue-specific models, and be applied to other organisms.
Keywords: constraint based, hepatic, liver, metabolism
Introduction
The understanding of human metabolism is crucial for the study and treatment of a diverse and wide range of clinical conditions, ranging from common metabolic disorders, such as obesity and diabetes, to rare inborn errors of metabolism (IEMs). Carcinogenesis is also known to involve abnormal metabolic phenotypes, and metabolic targets have long been used in cancer chemotherapy (Serkova et al, 2007; Galmarini et al, 2008). Recently, malfunctions in energy metabolism were shown to be involved in various brain disorders, from schizophrenia to neurodegenerative disorders (Holmes et al, 2006; Huang et al, 2007). The computational study of human metabolism could complement experimental investigations of these central medical problems providing insights into their pathophysiology and advancing their treatment.
Mathematical modeling of cellular metabolism has traditionally been performed through kinetic modeling techniques that require detailed information on kinetic constants and on enzyme and metabolite levels (Garfinkel and Hess, 1964). However, the lack of accurate cellular information of enzymes' kinetics and levels currently limits the applicability of such methods to small-scale systems. An alternative computational approach, constraint-based modeling (CBM), bypasses these hurdles as it does not depend on such detailed information. Constraint-based modeling assumes a metabolic steady state under which feasible flux distributions satisfy a stoichiometric mass-balance requirement, thermodynamic constraints and constraints on enzymes' capacities that are based on experimental observations of flux rates. This modeling paradigm has been extensively applied with considerable success to study microbial physiology (Edwards et al, 2001; Segre et al, 2002; Shlomi et al, 2005; Feist and Palsson, 2008; AbuOun et al, 2009; Durot et al, 2009; Kumar and Maranas, 2009; Oberhardt et al, 2009). Though still less developed, large-scale modeling of human metabolism is constantly progressing (Goodacre et al, 2004); earlier study has focused on characterizing distinct human metabolic pathways (Kanehisa and Goto, 2000; Romero et al, 2004), and modeling specific cell types and organelles (Wiback and Palsson, 2002; Chatziioannou et al, 2003; Vo et al, 2004).
In 2007, two generic human metabolic models were presented on the basis of an extensive evaluation of genomic and bibliomic data (Duarte et al, 2007; Ma et al, 2007). These network models consist of a collection of biochemical reactions that may take place under different tissues and cell types, depending on physiological conditions. The potential clinical utility of the generic model was previously demonstrated by its ability to identify functionally related sets of reactions that are causally related to hemolytic anemia, and potential drug targets for treating hypercholesterolemia (Duarte et al, 2007). In a recent study, the utility of this generic human metabolic model was further demonstrated in predicting metabolic biomarkers whose concentration is altered due to genomic mutations in IEMs (Shlomi et al, 2009). Addressing the challenge of using a generic human model to predict tissue-specific metabolism, a computational method for integrating a generic model with tissue-specific gene and protein expression data was recently presented (Shlomi et al, 2008). This study successfully predicted a variety of metabolic behaviors of different human tissues, including the brain, liver, kidney and more. The predicted metabolic behavior characterizes, for each tissue, a single, normal physiological condition under which the expression data (used as input) was measured.
In this study, we develop a new computational method that uses a variety of different tissue-specific molecular data sources to reconstruct functional metabolic network models of human tissues, rather than predicting a single metabolic state of a tissue as shown in the study by Shlomi et al (2008). Such models can then be used to explore the metabolic state of a tissue under various genetic and physiological conditions through standard CBM methods, without requiring additional context-specific molecular data. More specifically, although in the previous approach of Shlomi et al (2008) one could not simulate and study the effects of genetic perturbations or drug applications, this can now be performed in a straightforward manner given the model constructed in this study. Notably, harnessing the mixed-integer linear programming approach used in the study by Shlomi et al (2008) to our current goal of constructing a full-fledged tissue model does not work—this is due to the high computational demands put forward by the many tissue-specific data sources required in this study. Hence, alternatively, our new method is based on heuristically pruning the generic human metabolic model to derive a sub-network that is as consistent as possible with the pertaining tissue-specific molecular data sources, including literature-based knowledge, transcriptomic, proteomic, metabolomic, and phenotypic data. Applying the new method to generate the first genome-scale metabolic model of the liver, the resulting model is shown to be consistent with a variety of hepatic data sources, and to successfully permit the simulation of various metabolic states under different physiological conditions, in a manner superior to that obtained using the generic model.
Results
The model-building algorithm (MBA)
Our algorithm derives a tissue-specific metabolic model from a generic model based on network integration with various molecular data sources. We begin by first inferring from the tissue-specific data a set of reactions denoted as the core reactions, that is, reactions that are included in the generic model and should be included in the tissue model we aim to build (see Materials and methods section). We differentiate between core reactions that have a high versus moderate probability to be carried out in the specific tissue and divide the core into two sets, CH and CM, for high and moderate likelihood reactions, respectively. In general, the CH set includes human-curated tissue-specific pathways and the CM set includes reactions testified by molecular data. Both the CH and the CM are subsets of the generic model. The input to our algorithm is a generic model that is composed of a union of reactions that may exist in different, individual tissues (i.e., in our case, the generic human model), and the core, tissue-specific reactions (Figure 1). Our goal is then to derive the most parsimonious tissue-specific consistent model, which includes all the tissue-specific high-probability reactions (CH), a maximal number of moderate probability reactions (CM), and a set of additional reactions from the generic model that is required for gap filling—that is, for enabling the activation of all core reactions, resulting in a fully viable and consistent tissue-specific model. The latter reactions are observed by searching for a minimal set of reactions that should be added to obtain a consistent model—that is, a model in which for each reaction there is an overall feasible flux distribution in which it is active. Aiming to find the most parsimonious model on one hand, and maximizing the number of moderate probability reactions that are included in the model on the other hand, induces a tradeoff. The latter is tuned through a parameter that weighs both optimization criteria to obtain a single score that evaluates the quality of a model (see Materials and methods section). Sensitivity analysis was preformed to examine the reliance of the resulting model on this optimization parameter (Supplementary information, pp 5–6), showing that MBA's performance is fairly robust and does not hinge upon a choice of a narrow range of optimization parameter values.
Figure 1.

The diagram illustrates the function of the model-building algorithm (MBA). The algorithm is given tissue-specific core reactions sets (CH and CM) as input and reconstructs a tissue model containing all of the CH reactions, as many as possible CM reactions, and a minimal set of other generic model reactions that are required for obtaining overall model consistency.
To find an optimal model with a maximal score, we use a greedy heuristic search that is based on iteratively pruning reactions from the generic model, in a random order, while maintaining the consistency of the pruned model (starting from a generic model that is consistent). In each pruning step, a reaction is removed only if its removal does not prevent the activation of reactions in CH, and its removal increases the model's score. As the reactions’ scanning order may affect the resulting model, the algorithm is executed with different, random pruning orders (1000 in our implementation) to construct multiple candidate models (see Supplementary Figure 1 for further clarification). The fraction of models that contains a certain reaction reflects the confidence that it should be included in the final tissue model. Hence, to construct the final tissue model, the candidate models are aggregated, starting from CH and iteratively adding reactions ordered by their scores, until a final, minimal but consistent model is obtained.
Generating a metabolic model of the liver
We applied our method to automatically generate a genome-scale metabolic network model of the liver. Our starting point is the generic human metabolic model proposed by Duarte et al (2007), accounting for 2766 metabolites, 3742 reactions, 1905 genes, and 100 metabolic pathways. The essential core, CH, was extracted from literature-based curation of tissue-specific metabolic pathways that are known to be active in the liver (Bock et al, 1991; Chisari and Fausto, 2001; Gropper and Smith, 2008; Rosenthal and Glew, 2009). It consists of 37 intact metabolic pathways that are involved in central metabolism, carbohydrate, lipid, and amino acids metabolism, as well as specific hepatic metabolism (e.g., drug metabolism, bile acid biosynthesis). These pathways involve in sum 779 reactions and 873 metabolites. The more permissive core, CM, consists of a set of 304 reactions, and 484 metabolites. It was assembled from tissue-specific data sources, including metabolomic (Wishart et al, 2007) transcriptomic (Shmueli et al, 2003; Yanai et al, 2005), proteomic (Yan and Sadee, 2000; He, 2005; Saier et al, 2006), and phenotypic data (McKusick, 2007) of the liver (Supplementary information, data set I). Each reaction was included in CM only if it was supported by at least two of the data sources listed above, or if it was necessary for the inclusion of a liver metabolite that appeared in the metabolomics data (Wishart et al, 2007). The total core hence comprises of 1083 reactions and 1187 metabolites (description of reactions comprising the CH, CM, and final liver model is given in Supplementary information, data set I).
After applying our MBA method, the resulting liver model consists of 1827 reactions and 1360 metabolites. The network visualization is accessible through a supplemental website (http://www.cs.technion.ac.il/~tomersh/methods.html) and can be explored interactively using the freely available Cytoscape software (Cline et al, 2007). Out of the reactions in the derived liver model that are not included in either reaction cores, 50% are transport reactions that transfer metabolites across compartments (most of them are not associated with genes in the model and hence could not be included in the core reaction sets). The compartmentalization pattern of the liver and the generic models is given in Supplementary Figure 2. Notably, despite the heuristic nature of the MBA algorithm, the participation of many of the reactions in the resulting liver model is consistently predicted across the different random reaction elimination orders. For 70.65% of the non-CH reactions the algorithm provides completely unanimous predictions, that is, the reaction is either present in all models or absent in all of them (Figure 2).
Figure 2.

Coherency of the MBA model construction process, measured by the distribution of non-CH (CM and non-core) reaction confidence scores. As shown, a high fraction of the reactions (70.65%) are predicted with complete certainty, i.e., they appear either in all or in none of the sub-models generated.
We first tested the liver model by simulating various known hepatic metabolic functions under different physiological conditions. Evidently, even though the relevant metabolic pathways were already used as input to the model reconstruction algorithm (within the set of high-reliability reactions, CH), the resulting model is not guaranteed to have the capacity to perform complex functions involving the integration of several metabolic pathways. In the absence of available carbohydrates, hepatocytes have the unique ability to perform gluconeogenesis, that is, to synthesize glucose through glucogenic amino acids, glycerol, and lactate. We simulated gluconeogenesis by limiting the uptake of metabolites that can be used as carbon sources, apart from glucogenic amino acids, glycerol, and lactate, and maximizing the glucose production and secretion rate. A feasible flux distribution in which glucose is secreted was identified, with its secretion depending on the uptake rate of the various uptake nutrients (Supplementary Figure 3), demonstrating the ability of the model to perform gluconeogenesis (KIDA et al, 1980; Chan et al, 2003).
One of the main functions that take place in the liver is the conversion of ammonia to urea. Urea cycle deficiencies are inborn errors of hepatic metabolism that may cause severe hyperammonemia and hyperglutaminemia. In the study by Lee et al (2000), metabolic fluxes of urea secretion and glutamine uptake were measured in vivo in subjects with urea disorders, including argininosuccinate synthetase (ASS) deficiency, argininosuccinate lyase (ASL) deficiency, and ornithine transcarbamylase (OTC) deficiency, as well as in control healthy subjects. As the secretion and synthesis of urea are correlated with the consumption of dietary amino acids, the ratio of urea secretion versus glutamine uptake can better depict the functionality of the urea cycle than the rate of each of the fluxes by itself, as depicted in the results obtained by Lee et al (2000). For each of the three disorders, we simulated the metabolic phenotype of the healthy homozygote genotype (enforcing a non-zero flux through the corresponding reaction), the mutated heterozygote genotype (limiting the flux through the corresponding reaction to 50% of its maximal rate found by flux variability analysis (FVA; Mahadevan and Schilling, 2003), and the full knockout genotype (i.e., enforcing a zero flux through the reaction), both in the generic human model and in the liver model. Specifically, in each case, we computed the urea:glutamine ratio by sampling the space of feasible flux distributions, satisfying stoichiometric mass-balance and reaction directionality constraints (Price et al, 2004), deriving a mean and s.d. of the ratio across 1000 sampled solutions. We find that the results obtained by the liver model better represent the experimentally observed metabolic profiles than the generic model. Primarily, in the liver model, the urea:glutamine ratio decreases monotonically with the severity of the disease, with the exception of the full knockout in the OTC simulation (Figure 3; Supplementary Table I). In the liver model, the simulation of the healthy case obtains a significantly higher urea:glutamine ratio in comparison to the ratio obtained in the full knockout of ASS and ASL simulations (t-test P-values of 6 × 10⁻² and 1 × 10⁻⁴, respectively), unlike the generic model (t-test P-values of 0.8469 and 0.2235, respectively). In addition, the variance of the ratio across the solution spaces that are defined by the liver model is fairly smaller than the variance of the one defined by the generic model (Supplementary Table I). These latter results are in line with the phenomenon described by Lee et al (2000), that the ratio is kept rather stable for each of the genotypes.
Figure 3.

The mean urea/glutamine ratio and the standard error in (A) the liver and (B) the generic model simulations of the healthy (i.e., normal homozygote), partial (i.e., heterozygote) and full knockout cases.
Cross-validation
To evaluate MBA's performance in correctly identifying liver reactions, it was applied to construct a liver model in a standard five-fold cross-validation process. Specifically, MBA was given various subsets of the full core reaction sets, and the reaction-content of the predicted MBA model was then compared with the left-out core reactions data, that is, the ability of MBA to correctly add the missing, left-out, liver reactions was tested. The predictions of the algorithm are significantly enriched with the left-out test data (hypergeometric P-value=5.24 × 10⁻¹⁵), obtaining accuracy of 0.5086, recall of 0.5308, and precision of 0.2732. Another cross-validation was performed in a different manner, such that each time one of the molecular omics data sets was omitted from the construction stage. Furthermore, the predictions are significantly enriched with the missing data set (mean hypergeometric P-value=4.33 × 10−04), obtaining on average an accuracy of 0.6174, recall of 0.7, and precision of 0.3844 (Figure 4).
Figure 4.

Prediction of missing core data via a five-fold cross-validation test. Each of the five columns represents the performance of the MBA algorithm in predicting one omitted data source, using the four other data sources to construct the core for the algorithm.
Predicting hepatic flux measurements
The liver model was applied to predict changes of flux rates at different hepatic metabolic conditions, and its prediction accuracy was compared with that obtained by using the original, generic human model. The predictions were tested using a comprehensive set of flux measurements performed by Chan et al (2003). The experiments reported in the study by Chan et al (2003) were performed in primary rat hepatocytes. Hepatocytes form the main component of bioartificial liver assist devices, which are destined to provide short-term support to patients with acute liver failure (Busse et al, 1999; Stockmann et al, 2000; Tzanakakis et al, 2000; Hui et al, 2001). Hepatocytes were cultured in a standard hepatocyte culture medium and were preconditioned with high or low levels of insulin, and exposed to human plasma with or without amino-acid supplementation. Metabolic fluxes were measured in these four conditions.
Given this relatively rich liver flux data, we set out to perform a comprehensive comparison between four different classifiers: (a) the liver model, (b) the generic model, (c) a liver model built using expression data only, and (d) a random background model. The model built on tissue-specific expression data solely (model (c) is built and tested here too, since such data are readily available for many tissues (while other kinds of molecular data are yet more sporadic), and hence of interest. The prediction test is conducted by providing the models with the experimental flux data of the exchange reactions measured and predicting the resulting internal fluxes. To perform a rigorous comparison between the classifiers, we track their performance using a standard receiver–operator curve (ROC), which portrays the tradeoff between the true positive (TPR) and false positive rates (FPRs) of prediction as the decision threshold of a classifier is varied. The overall performance is then provided by the area under the curve (AUC), which varies between zero and one, the latter denoting the performance of a perfect classifier.
As evident from Figure 5, the liver model, obtaining an AUC of 0.6745 and 0.6044 for predicting increasing and decreasing fluxes, respectively, markedly outperforms the generic model, with predictions that obtain an AUC of 0.46073 and 0.5103 for increasing and decreasing fluxes, respectively. The model built based on liver-specific gene expression obtains an intermediate level of accuracy (an AUC of 0.57331 for increasing fluxes and 0.4806 for decreasing ones). Thus, even though it is built based on a partial information core founded on gene expression solely, it still outperforms the generic human model. The ability of the different models to predict extracellular fluxes given the intracellular fluxes, and in a global five-fold cross-validation test (in which 4/5 of all reactions are used to predict the remaining 1/5, irrespective of their external/internal identity), is depicted in Supplementary Figure 4. Overall, these results show that the liver model can serve as a much better basis for predicting hepatic alterations than the generic model, relying on just a fairly limited set of flux measurements.
Figure 5.

Prediction of experimental hepatic flux data in primary hepatocytes exposed to plasma at low or high levels of insulin, with or without amino-acid supplementation. The ROC curves (and the resulting AUCs) of all classifiers are presented separately for predicting (A) increasing and (B) decreasing internal fluxes (setting the exchange fluxes to their experimentally measured values).
Predicting metabolic biomarkers
Recently, Shlomi et al (2009) have shown that the generic model of Duarte et al (2007) can be used to successfully predict changes in metabolite concentrations due to IEMs, representing diagnostic biomarkers that can be detected through biofluid metabolomics. As a further validation of the reconstructed liver model, we repeated this analysis here focusing on metabolic disorders that arise from mutations in hepatic metabolic genes. The method is based on comparing the concentrations of boundary metabolites in the disease simulation versus the normal simulation. Each boundary metabolite has an exchange reaction that transports it from the extracellular compartment to the intracellular compartment and vice versa. Therefore, changes in the concentration of each of these metabolites can be inferred from comparing the flux intervals of its exchange reaction (representing uptake versus secretion), by using FVA (see Materials and methods section; Mahadevan and Schilling, 2003) in the simulated normal versus disease states.
The initial set of metabolic disorders (documented in the OMIM database) consists of 137 IEMs, the causative gene of which is included in the generic human metabolic model (Duarte et al, 2007), and are associated with one or more known metabolic diagnostic biomarkers (Shlomi et al, 2009). From this set, we extracted a subset of 84 disorders whosecausative gene is included in the reconstructed liver model (Supplementary information, data set II). As evident from Figure 6, the liver model improves upon the generic model, with an AUC of 0.6691 for the liver model; versus an AUC of 0.5868 achieved by the generic model (description of the liver model's biomarkers predictions is given in Supplementary information, data set II). This time the model built based solely on liver-specific gene expression performs disappointingly, obtaining a lower level of accuracy than the generic one, with an AUC of 0.5221. These results again show the ability of the liver model to improve the identification of hepatic flux alterations caused by dysfunctional enzymes beyond the level yielded by the generic model, but also highlight the importance of integrating multiple data sources for the construction process if/when the latter are available.
Figure 6.

Prediction of metabolic biomarkers of IEMs. The figure depicts the ROC curves (and the resulting AUCs) of the four classifiers, as in Figure 5.
Discussion
A rigorous, rapid computational method for the generation of in silico tissue-specific metabolic models is presented. MBA carves out a tissue-specific model out of a generic species model, based on existing literature and molecular data characterizing the tissue's metabolism. The resulting model satisfies stoichiometric, mass-balance and thermodynamic constraints. The algorithm is structured according to the accuracy level of the input data by the division of the tissue-specific core into the more reliable human-curated (CH) and the omics data (CM), which are treated with different levels of confidence. Despite the heuristic nature of the algorithm the model construction is consistent, such that most reactions selected for the final model from the candidate solutions appear in the large majority of the solutions. The algorithm is applied to construct the first stoichiometric genome-scale liver metabolic model. The resulting liver model has the ability to perform a range of hepatic metabolic functions, as well as correctly depict the metabolic profile of the liver at different physiological and genetic conditions, in which it outperforms the generic, human model.
The above approach is akin to a recently published method by Christian et al (2009) in that it defines a set of reactions as a core and attempts to carve out the minimal model that consists of this core, but it differs in that it is based on optimization rather than on a network expansion procedure that does not consider the stochiometric constraints. MBA has its pros and cons: on the pros side, it is a generic and fast approach to generate tissue-specific models, which are fairly accurate and useful. It is practically unlimited in its scalability, and can process a large variety of data sources. Importantly, using cross-validation, one can readily get a quantitative assessment of the model consistency and reliability, and know where things stand. On the cons side, several limitations should be noted. First, the starting point—as the approach hinges upon a generic species model, its accuracy depends on the quality of the latter. This dependency may be alleviated in the future with an extended computational approach that includes the possibility of adding reactions from a universal pool during model construction. Second, the accuracy of different molecular omics data that are used to determine the tissue core is also an obvious limiting factor—to mitigate this effect our approach treats human-curated pathways data in a preferential manner, and requires evidence from multiple molecular sources, and yet, it is likely that not all inaccuracies in the molecular data are filtered out. Bearing these potential caveats in mind, the accuracy of the liver model generated here is quite remarkable.
As the final liver model consists of more than 95% of the CM core (Table I), we further tested the added value of having a moderate reliability core over simply including all of its reactions in the resulting liver model (similarly to the high reliability core CH). To this end, we constructed a model that has a fixed predetermined core composed of both the original CH and CM reaction sets (i.e., now all defined as CH reactions), and studied its ability to predict flux alterations. The resulting model is denoted as a strict model, for its construction does not tolerate a removal of any core reaction. The strict model's performance is rather similar to the performances of the liver model in predicting inner fluxes, obtaining an AUC of 0.6061 and 0.6433 for increasing and decreasing fluxes. However, comparison of the models by their ability to predict extracellular fluxes given the intracellular fluxes, in a global five-fold cross-validation test (Supplementary Figure 4), as well as in biomarker prediction (Supplementary Figure 5), shows the advantage of the liver model built by the standard, flexible MBA version. Although the liver model contains most of the CM reactions, a considerable number of 100 reactions differentiate between it and the strict model. This set of reactions is involved in 22 metabolic pathways (see Supplementary information, data set II, for full description), and effects the performances of the models.
Table 1. Content of the input and output sets of MBA.
| Generic model | C H | Initial CM | Liver model |
|||
|---|---|---|---|---|---|---|
| Final CM | Non core | Total | ||||
| Reactions | 2469 | 779 | 304 | 291 | 757 | 1827 |
| Metabolites | 1587 | 873 | 484 | 457 | 922 | 1360 |
| Genes | 1479 | 898 | 346 | 338 | 250 | 1335 |
| Pathways | 83 | 37 | 39 | 38 | 37 | 80 |
The MBA approach opens up opportunities for many promising future applications. First and foremost, the liver model developed in this study can help in the rational design of bioengineering artificial devices that emulate hepatic metabolism (e.g., BAL; Yang et al, 2009). Hepatocytes, the main components of the BAL (Strain and Neuberger, 2002), have a tendency to rapidly lose their functionality due to metabolic transformations (e.g., lipid accumulation and reduced ammonia removal). Applying the liver metabolic model to optimize the functionality of these cells and predict potential ways for inhibiting the metabolic processes that contribute to this unwanted transformation can assist in bypassing this hurdle. Second, MBA can serve for the rapid development of an array of metabolic models of a variety of human tissues, providing a computational opportunity to probe the metabolism of such tissues as the kidney, heart, and brain on a genomic scale. Third, MBA can be used to generate tissue models for any organism for which a generic model exists, such as Mus musculus (Sheikh et al, 2005; Quek and Nielsen, 2008) and the model plant Arabidopsis thaliana (Poolman et al, 2009).
Materials and methods
The model-building algorithm (MBA)
A metabolic network model, amenable to CBM, can be represented by a four-tuple, (M, R, S, L), in which M denotes a set of metabolites, R denotes a set of biochemical reactions, 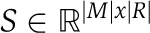 denotes reactions’ stoichiometry, and
 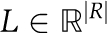 denotes constraints on reactions’ directionality (i.e., reflecting a lower bound on reactions’ flux rate). Reactions’ stoichiometry is represented by a stoichiometric matrix, S, in which Si,j, represents the stoichiometric coefficient of metabolite i in reaction j.
A feasible flux distribution within a metabolic network model, is a vector 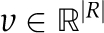 , satisfying mass-balance (Sv=0), and directionality constraints (L⩽v). A metabolic network model is considered consistent if it enables to activate all of its reactions—that is, for each reaction
  there exists a feasible flux distribution v, such that ∣vi∣>0.
Given a metabolic network model, GM=(MG, RG, SG, LG), referred to as the generic model, a partial model, PM=(MP, RP, SP, LP), including only a subset of the generic model's reactions (RP⊂RG) can be defined on the basis of the corresponding subsets of metabolites, stoichiometry, and directionality constraints. Notably, a partial model of a consistent generic model is not necessarily consistent by itself (i.e., it may contain dead-end reactions that cannot be activated considering all possible feasible flux distributions).
Given a generic model, GM, and two sets of core reactions, CH and CM⊂RG, known to have a high and moderate probability to be included in some partial model, respectively, our goal is to derive the most parsimonious, consistent, partial model PM, consisting of all reaction in CH and a maximal number of reactions from CM. Specifically, we would like to identify PM by solving the following optimization problem:
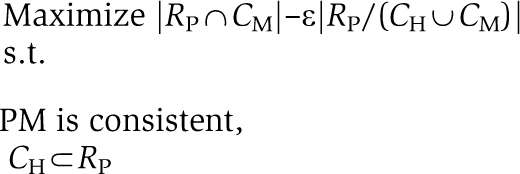 |
where ε is a parameter reflecting a tradeoff between obtaining the most parsimonious model (for a high value of ε) and including a maximal number of moderate probability reactions in the partial model (for a low value of ε). For the construction of the liver model ε was set to 0.5.
To solve the above optimization problem, we use the following simple search heuristic:
Define RP=RG
Choose a random permutation, P, of reactions from the set RG/(CH∪CM)
For each reaction r∈P
inactiveReactions=CheckModelConsistency (RP, r)
eH=inactiveReactions∩CH
eM=inactiveReactions∩CM
eX=inactiveReactions/(CH∪CM)
If (∣eH∣=0) AND (∣eM∣<ε*∣eX∣) then RP=RP/(eM∪eX)
First, the current set of reactions in the partial model, RP, is initialized to include all reactions in the generic model RG (1). Then, a random permutation of all reactions that are neither in the high-reliability core, CH, nor in the moderate-reliability core, CM (and hence their potential removal from the partial model can increase the optimization objective function) is generated. In (3), the potential removal of each reaction in turn (based on the random order P) is evaluated. The procedure CheckModelConsistency computes the set inactiveReactions that consists of reactions in RP that cannot be activated due to the removal of reaction r from RP. eH, eM, and eX are then computed to consist of inactive reactions that belong to CH, CM or to none of the cores, respectively. In case the removal of r from RP would affect the ability to activate a high-reliability reaction, r would not be removed from RP (3.b). Otherwise, if removal of r would increase the optimization objective value, r will be removed from RP, along with the additional reactions eM, eX that cannot be activated following its removal.
A naive implementation of CheckModelConsistency can simply iterate through all reactions in RP applying FVA (Mahadevan and Schilling, 2003) to check whether they can carry non-zero flux within a feasible flux distribution when r is removed. The naive algorithm is computationally prohibitive, with an overall time complexity of O(nkt), where n denotes the number of reactions in CH∪CM, k denotes the number of non-core reactions (∣RP/CH∪CL∣), and t denotes the (polynomial) complexity of each LP problem. Instead, a simple speed-up technique was implemented that aims to concurrently activate multiple core reactions in the same LP problem, by trying to maximize their total sum of flux. These optimizations are repeated several times on a monotonically decreasing set of core reactions. Each iteration is performed on a smaller subset of the core reactions, which have received zero flux in all previous iterations (see Supplementary information, p 7 for pseudo-code and further explanation). These speed-ups reduce the running time by 97%, in comparison to the naive approach. The total running time of the algorithm is ∼10–20 min depending on the cores’ size.
As the resulting model depends on the chosen reaction scanning order, the algorithm is executed repeatedly for a number of times (1000 in the results presented here) with different, random scanning orders. Each run results in a candidate model. All 1000 candidate models are then processed to assign the CM and non-core reactions with scores, representing the fraction of candidate models in which they appear. An aggregative model is built by considering the scores across all runs, starting with the CH and incrementally adding reactions according to their confidence score until a consistent, viable model is obtained.
Model availability
The liver model, in excel and SBML format, is available as Supplementary information. MBA can be applied via a web server at http://imat.cs.tau.ac.il.
Predicting flux measurements
The liver model was applied to predict changes in metabolic flux rates under different hepatic conditions. The predictions were compared with a set of flux measurements, including 23 exchange fluxes (uptake of metabolites) and 22 inner fluxes (Chan et al, 2003; a complete description of the experimental flux data is given in Supplementary information, data set II). The measurements were obtained from primary rat hepatocytes in four metabolic conditions: high/low-insulin preconditioning with (HPA/LPA) or without (HP/LP) amino-acid supplementations.
Quadratic programming (QP) was applied to first find a feasible flux distribution, satisfying stoichiometric mass-balance and reaction directionality constraints, that is as close as possible to the measured flux through exchange reactions. This process was executed both for the generic and the liver models in each of the four growth conditions. To explore the metabolic profile that is deduced by this optimal match with the measured exchange fluxes, FVA (Mahadevan and Schilling, 2003) was used to predict a range of possible fluxes through all reactions in the model, while fixing the flux through the measured exchange reactions to the values computed using QP (the maximal uptake rate of other exchange reactions in the model was set to 10% of glutamine uptake rate (Chan et al, 2003).
Changes in metabolic flux were predicted in comparison with the reference condition HP. For each reaction, we compute the difference between its interval in the HP condition to its interval in the other three conditions, that is, change(vi)=(max(vi)-ref_max(vi))+(min(vi)-ref_min(vi)). A reaction is predicted to increase or decrease under the conditions for which either (1) or (2) listed below holds, respectively, where f is a threshold value. Otherwise, it is considered to be unchanged (Supplementary Figure 6). In addition, the change in the interval is normalized by its size (3), to account the significance of the flux alteration. The ROC curves of the predictions were plotted with increasing thresholds values (Bock et al, 1991).
change(vi)/Mi>f
change(vi)/Mi<−f
Mi=∣mean(min(vi), max(vi), min(ref_vi), max(ref_vi))∣
Biomarkers prediction
We applied the computational method described by Shlomi et al (2009) to systematically predict metabolic biomarkers characterizing 84 hepatic metabolic disorders (documented in the OMIM database), that is, disorders causative gene of which is included in the liver model (Supplementary information, data set II). The method relies on comparing the concentrations of boundary metabolites in the disease simulation versus the normal simulation. A boundary metabolite is defined as a metabolite that can be transported from the extracellular compartment to the intracellular compartment, and vice versa, through an exchange reaction. Changes in the concentration of a boundary metabolite can be inferred from shifts in the interval of the minimum/maximum flux values of its exchange reaction. For each metabolic reaction r, we computed the interval of exchange reactions e, via FVA, when r is forced to be either active or inactive, simulating the normal and disease case, respectively. If m is a boundary metabolite with an exchange reaction interval of A=(mina, maxa) in the normal simulation and B=(minb, maxb) in the disease simulation, then m is a biomarker if either of the following holds:
A<B
B<A
In adddition, based on the definition of Shlomi et al (2009), we define:
where f is the decision threshold value according to which we plot the ROC curve.
Supplementary Material
Supplementary figures S1–8, Supplementary table S1
The liver model in excel format.
The liver model in SBML format.The version of this supplementary file originally posted online on 7 September 2010 contained unreadable lines due to a problem with the COBRA toolbox used to generate the SBML file. These errors have been corrected and the file replaced on 21 September 2010.
Acknowledgments
This study was supported by grants from the Israeli Science Foundation (ISF) to ER and TS. LJ is supported by a fellowship from the Edmond J Safra Bioinformatics Program at TAU.
Footnotes
The authors declare that they have no conflict of interest.
References
- AbuOun M, Suthers PF, Jones GI, Carter BR, Saunders MP, Maranas CD, Woodward MJ, Anjum MF (2009) Genome scale reconstruction of a Salmonella metabolic model: comparison of similarity and differences with a commensal Escherichia coli strain. J Biol Chem 284: 29480–29488 [DOI] [PMC free article] [PubMed] [Google Scholar]
- Bock K, Gerok W, Matern S (1991) Hepatic Metabolism and Disposition of Endo- and Xenobiotics, pp 27–41, 205–207. London: Springer [Google Scholar]
- Busse B, Smith MD, Gerlach J (1999) Treatment of acute liver failure: hybrid liver support. Langenbecks Arch Surg 384: 588–599 [DOI] [PubMed] [Google Scholar]
- Chan C, Berthiaume F, Lee K, Yarmush ML (2003) Metabolic flux analysis of cultured hepatocytes exposed to plasma. Biotechnol Bioeng 81: 33–49 [DOI] [PubMed] [Google Scholar]
- Chatziioannou A, Palaiologos G, Kolisis FN (2003) Metabolic flux analysis as a tool for the elucidation of the metabolism of neurotransmitter glutamate. Metab Eng 5: 201–210 [DOI] [PubMed] [Google Scholar]
- Chisari V, Fausto N (2001) The Liver: Biology and Pathobiology, Chapter 20, pp 291–308. Philadelphia: Lippincott Williams & Wilkins [Google Scholar]
- Christian N, May P, Kempa S, Handorf T, Ebenhoh O (2009) An integrative approach towards completing genome-scale metabolic networks. Mol Biosyst 5: 1889–1903 [DOI] [PubMed] [Google Scholar]
- Cline MS, Smoot M, Cerami E, Kuchinsky A, Landys N, Workman C, Christmas R, Avila-Campilo I, Creech M, Gross B, Hanspers K, Isserlin R, Kelley R, Killcoyne S, Lotia S, Maere S, Morris J, Ono K, Pavlovic V, Pico AR et al. (2007) Integration of biological networks and gene expression data using Cytoscape. Nat Protoc 2: 2366–2382 [DOI] [PMC free article] [PubMed] [Google Scholar]
- Duarte NC, Becker SA, Jamshidi N, Thiele I, Mo ML, Vo TD, Srivas R, Palsson BO (2007) Global reconstruction of the human metabolic network based on genomic and bibliomic data. Proc Natl Acad Sci USA 104: 1777–1782 [DOI] [PMC free article] [PubMed] [Google Scholar]
- Durot M, Bourguignon P-Y, Schachter V (2009) Genome-scale models of bacterial metabolism: reconstruction and applications. FEMS Microbiol Rev 33: 164–190 [DOI] [PMC free article] [PubMed] [Google Scholar]
- Edwards JS, Ibarra RU, Palsson BO (2001) In silico predictions of Escherichia coli metabolic capabilities are consistent with experimental data. Nat Biotechnol 19: 125–130 [DOI] [PubMed] [Google Scholar]
- Feist AM, Palsson BO (2008) The growing scope of applications of genome-scale metabolic reconstructions using Escherichia coli. Nat Biotechnol 26: 659–667 [DOI] [PMC free article] [PubMed] [Google Scholar]
- Galmarini CM, Popowycz F, Joseph B (2008) Cytotoxic nucleoside analogues: different strategies to improve their clinical efficacy. Curr Med Chem 15: 1072–1082 [DOI] [PubMed] [Google Scholar]
- Garfinkel D, Hess B (1964) Metabolic control mechanisms. VII.A detailed computer model of the glycolytic pathway in ascites cells. J Biol Chem 239: 971–983 [PubMed] [Google Scholar]
- Goodacre R, Vaidyanathan S, Dunn WB, Harrigan GG, Kell DB (2004) Metabolomics by numbers: acquiring and understanding global metabolite data. Trends Biotechnol 22: 245–252 [DOI] [PubMed] [Google Scholar]
- Gropper S, Smith L (2008) Advanced Nutrition and Human Metabolism, pp 78–99, 157–168, 198–279. Belmont: Wadsworth Pub Co [Google Scholar]
- He F (2005) Human liver proteome project: plan, progress, and perspectives. Mol Cell Proteomics 4: 1841–1848 [DOI] [PubMed] [Google Scholar]
- Holmes E, Tsang TM, Tabrizi SJ (2006) The application of NMR-based metabonomics in neurological disorders. NeuroRx 3: 358–372 [DOI] [PMC free article] [PubMed] [Google Scholar]
- Huang C, Tang C, Feigin A, Lesser M, Ma Y, Pourfar M, Dhawan V, Eidelberg D (2007) Changes in network activity with the progression of Parkinson's disease. Brain 130: 1834–1846 [DOI] [PMC free article] [PubMed] [Google Scholar]
- Hui T, Rozga J, Demetriou AA (2001) Bioartificial liver support. J Hepatobiliary Pancreat Surg 8: 1–15 [DOI] [PubMed] [Google Scholar]
- Kanehisa M, Goto S (2000) KEGG: Kyoto encyclopedia of genes and genomes. Nucleic Acids Res 28: 27–30 [DOI] [PMC free article] [PubMed] [Google Scholar]
- Kida K, Nishio T, Yokozawa T, Nagai K, Matsuda H, Nakagawa H (1980) The circadian change of gluconeogenesis in the liver: in vivo in fed rats. J Biochem 88: 1009–1013 [DOI] [PubMed] [Google Scholar]
- Kumar VS, Maranas CD (2009) GrowMatch: an automated method for reconciling in silico/in vivo growth predictions. PLoS Comput Biol 5: e1000308. [DOI] [PMC free article] [PubMed] [Google Scholar]
- Lee B, Yu H, Jahoor F, O’Brien W, Beaudet AL, Reeds P (2000) In vivo urea cycle flux distinguishes and correlates with phenotypic severity in disorders of the urea cycle. Proc Natl Acad Sci USA 97: 8021–8026 [DOI] [PMC free article] [PubMed] [Google Scholar]
- Ma H, Sorokin A, Mazein A, Selkov A, Selkov E, Demin O, Goryanin I (2007) The Edinburgh human metabolic network reconstruction and its functional analysis. Mol Syst Biol 3: 135. [DOI] [PMC free article] [PubMed] [Google Scholar]
- Mahadevan R, Schilling CH (2003) The effects of alternate optimal solutions in constraint-based genome-scale metabolic models. Metab Eng 5: 264–276 [DOI] [PubMed] [Google Scholar]
- McKusick VA (2007) Mendelian inheritance in man and its online version, OMIM. Am J Hum Genet 80: 588–604 [DOI] [PMC free article] [PubMed] [Google Scholar]
- Oberhardt MA, Palsson BO, Papin JA (2009) Applications of genome-scale metabolic reconstructions. Mol Syst Biol 5: 320. [DOI] [PMC free article] [PubMed] [Google Scholar]
- Poolman MG, Miguet L, Sweetlove LJ, Fell DA (2009) A genome-scale metabolic model of Arabidopsis and some of its properties. Plant Physiol 151: 1570–1581 [DOI] [PMC free article] [PubMed] [Google Scholar]
- Price ND, Schellenberger J, Palsson BO (2004) Uniform sampling of steady-state flux spaces: means to design experiments and to interpret enzymopathies. Biophys J 87: 2172–2186 [DOI] [PMC free article] [PubMed] [Google Scholar]
- Quek LE, Nielsen LK (2008) On the reconstruction of the Mus musculus genome-scale metabolic network model. Genome Inform 21: 89–100 [PubMed] [Google Scholar]
- Romero P, Wagg J, Green M, Kaiser D, Krummenacker M, Karp P (2004) Computational prediction of human metabolic pathways from the complete human genome. Genome Biol 6: R2. [DOI] [PMC free article] [PubMed] [Google Scholar]
- Rosenthal MD, Glew RH (2009) Medical Biochemistry: Human Metabolism in Health and Disease, 2nd edn, pp 112–325. Philadelphia: Mosby, Elsevier [Google Scholar]
- Saier MH Jr, Tran CV, Barabote RD (2006) TCDB: the Transporter Classification Database for membrane transport protein analyses and information. Nucleic Acids Res 34: D181–D186 [DOI] [PMC free article] [PubMed] [Google Scholar]
- Segre D, Vitkup D, Church GM (2002) Analysis of optimality in natural and perturbed metabolic networks. Proc Natl Acad Sci USA 99: 15112–15117 [DOI] [PMC free article] [PubMed] [Google Scholar]
- Serkova NJ, Spratlin JL, Eckhardt SG (2007) NMR-based metabolomics: translational application and treatment of cancer. Curr Opin Mol Ther 9: 572–585 [PubMed] [Google Scholar]
- Sheikh K, Forster J, Nielsen LK (2005) Modeling hybridoma cell metabolism using a generic genome-scale metabolic model of Mus musculus. Biotechnol Prog 21: 112–121 [DOI] [PubMed] [Google Scholar]
- Shlomi T, Berkman O, Ruppin E (2005) Regulatory on/off minimization of metabolic flux changes after genetic perturbations. Proc Natl Acad Sci USA 102: 7695–7700 [DOI] [PMC free article] [PubMed] [Google Scholar]
- Shlomi T, Cabili MN, Herrgard MJ, Palsson BO, Ruppin E (2008) Network-based prediction of human tissue-specific metabolism. Nat Biotechnol 26: 1003–1010 [DOI] [PubMed] [Google Scholar]
- Shlomi T, Cabili MN, Ruppin E (2009) Predicting metabolic biomarkers of human inborn errors of metabolism. Mol Syst Biol 5: 263. [DOI] [PMC free article] [PubMed] [Google Scholar]
- Shmueli O, Horn-Saban S, Chalifa-Caspi V, Shmoish M, Ophir R, Benjamin-Rodrig H, Safran M, Domany E, Lancet D (2003) GeneNote: whole genome expression profiles in normal human tissues. C R Biol 326: 1067–1072 [DOI] [PubMed] [Google Scholar]
- Stockmann HB, Hiemstra CA, Marquet RL, Ijzermans JNM (2000) Extracorporeal perfusion for the treatment of acute liver failure. Ann Surg 231: 460–470 [DOI] [PMC free article] [PubMed] [Google Scholar]
- Strain AJ, Neuberger JM (2002) A bioartificial liver—state of the art. Science 295: 1005–1009 [DOI] [PubMed] [Google Scholar]
- Tzanakakis ES, Hess DJ, Sielaff TD, Hu W-S (2000) Extracorporeal tissue engineered liver-assist devices. Annu Rev Biomed Eng 2: 607–632 [DOI] [PubMed] [Google Scholar]
- Vo TD, Greenberg HJ, Palsson BO (2004) Reconstruction and functional characterization of the human mitochondrial metabolic network based on proteomic and biochemical data. J Biol Chem 279: 39532–39540 [DOI] [PubMed] [Google Scholar]
- Wiback SJ, Palsson BO (2002) Extreme pathway analysis of human red blood cell metabolism. Biophys J 83: 808–818 [DOI] [PMC free article] [PubMed] [Google Scholar]
- Wishart DS, Tzur D, Knox C, Eisner R, Guo AC, Young N, Cheng D, Jewell K, Arndt D, Sawhney S, Fung C, Nikolai L, Lewis M, Coutouly M-A, Forsythe I, Tang P, Shrivastava S, Jeroncic K, Stothard P, Amegbey G et al. (2007) HMDB: the Human Metabolome Database. Nucleic Acids Res 35: D521–D526 [DOI] [PMC free article] [PubMed] [Google Scholar]
- Yan Q, Sadee W (2000) Human membrane transporter database: a Web-accessible relational database for drug transport studies and pharmacogenomics. AAPS PharmSci 2: E20. [DOI] [PMC free article] [PubMed] [Google Scholar]
- Yanai I, Benjamin H, Shmoish M, Chalifa-Caspi V, Shklar M, Ophir R, Bar-Even A, Horn-Saban S, Safran M, Domany E, Lancet D, Shmueli O (2005) Genome-wide midrange transcription profiles reveal expression level relationships in human tissue specification. Bioinformatics 21: 650–659 [DOI] [PubMed] [Google Scholar]
- Yang H, Roth CM, Ierapetritou MG (2009) A rational design approach for amino acid supplementation in hepatocyte culture. Biotechnol Bioeng 103: 1176–1191 [DOI] [PubMed] [Google Scholar]
Associated Data
This section collects any data citations, data availability statements, or supplementary materials included in this article.
Supplementary Materials
Supplementary figures S1–8, Supplementary table S1
The liver model in excel format.
The liver model in SBML format.The version of this supplementary file originally posted online on 7 September 2010 contained unreadable lines due to a problem with the COBRA toolbox used to generate the SBML file. These errors have been corrected and the file replaced on 21 September 2010.