

Abstract
The control of sequenced behaviors, including human speech, requires that the brain coordinate the production of discrete motor elements with their concatenation into complex patterns. In birdsong, another sequential vocal behavior, the acoustic structure (phonology) of individual song elements, or “syllables,” must be coordinated with the sequencing of syllables into a song. However, it is unknown whether syllable phonology is independent of the sequence in which a syllable is produced. We quantified interactions between phonology and sequence in Bengalese finch song by examining both convergent syllables, which can be preceded by at least two different syllables and divergent syllables, which can be followed by at least two different syllables. Phonology differed significantly based on the identity of the preceding syllable for 97% of convergent syllables and differed significantly with the identity of the upcoming syllable for 92% of divergent syllables. Furthermore, sequence-dependent phonological differences extended at least two syllables away from the convergent or divergent syllable. To determine whether these phenomena reflect differences in central control, we analyzed premotor neural activity in the robust nucleus of the arcopallium (RA). Activity associated with a syllable varied significantly depending on the sequence in which the syllable was produced, suggesting that sequence-dependent variations in premotor activity contribute to sequence-dependent differences in phonology. Moreover, these data indicate that RA activity could contribute to the sequencing of syllables. Together, these results suggest that, rather than being controlled independently, the sequence and phonology of birdsong are intimately related, as is the case for human speech.
Introduction
When producing complex motor sequences, the brain must control discrete motor gestures while also organizing those gestures into patterns over time. Human speech, for example, is composed of individual phonemes sequenced into words and sentences. Similarly, Bengalese finch song is composed of song syllables arranged into variable sequences (Okanoya, 2004). In both song and speech, the brain must therefore coordinate two distinct levels of control: the acoustic structure of individual vocal gestures (phonology) and their organization into complex patterns across time (sequence).
These two levels of vocal control are closely related in human speech. Both past and future differences in sequencing can alter the phonology of the ongoing phoneme (Daniloff and Hammarberg, 1973). Differences in previous vocalizations can have “carryover” effects on the current vocalization, whereas differences in future vocalizations can cause anticipatory adjustments to the ongoing phoneme (Recasens, 1984). This phenomenon, termed “coarticulation” (Ohman, 1966), can reflect both differences in central planning and history dependence in the motor periphery (Ostry et al., 1996).
In contrast, the relationship between sequence and phonology in birdsong is less clear. Neurophysiological studies have suggested that different brain nuclei might serve complementary functions. In the zebra finch, activity in motor nucleus HVC appears to encode temporal information (Yu and Margoliash, 1996; Hahnloser et al., 2002). In contrast, in both the zebra finch and the Bengalese finch, activity in robust nucleus of the arcopallium (RA), which receives input from HVC, reflects the acoustic structure of individual song syllables (Yu and Margoliash, 1996; Leonardo and Fee, 2005; Sober et al., 2008).
Although these studies suggest a hierarchical model in which sequence and phonology are controlled by HVC and RA, respectively, stimulation studies have demonstrated that disrupting activity in RA and one of its downstream targets can alter syllable sequencing (Ashmore et al., 2005). These results argue against a strictly hierarchical model of song production, since they suggest that nuclei involved in phonological control can influence syllable sequencing, perhaps via ascending projections from RA and brainstem nuclei to the forebrain. Despite such evidence, however, there has been little examination of interactions between sequence and phonology using either behavioral or neurophysiological tools.
We exploited the variable sequencing of Bengalese finch syllables to investigate whether the phonology of syllables and their premotor representation in RA differ when the same syllable is produced in different sequences. We found that sequence-dependent phonological differences are common, raising the question of whether such differences reflect differences in premotor activity or result solely from the dynamics of the vocal periphery. One possibility is that, when the same syllable is produced in different sequences, RA activity is no more similar than when two unrelated syllables are produced. A second possibility is that RA activity is identical for the same syllable in different sequences, and any sequence-dependent phonological differences result from history dependence in the vocal articulators or brainstem circuitry. A third possibility is that, when a syllable is produced in different sequences, differences in RA activity scale with the magnitude of sequence-dependent differences in phonology, reflecting the contribution of the CNS to generating the observed acoustic variation. We found that the size of sequence-dependent phonological differences correlates with the magnitude of differences in RA activity, consistent with the third possibility. Together, our results indicate that phonology and sequence are intimately related at the behavioral level and that RA contributes to sequence-dependent differences in syllable phonology.
Materials and Methods
Behavioral analysis
General song recording techniques
Undirected songs (sung in social isolation) of 18 adult male Bengalese finches (Lonchura domestica), aged 4 months to 2 years, were recorded (labeled BF01 through BF18 in the text). Fourteen birds (BF01 to BF14) were used to examine the interactions between sequence and phonology, and four additional birds (BF15 to BF18) were used to examine the effects of deafening on such interactions. Omnidirectional Lavalier microphones (Countryman) were used to record songs. Songs were bandpass filtered between 50 and 10,000 Hz before being digitized at 32 kHz (National Instruments). Customized acquisition software (LabView) was used for identifying and saving songs. A set of randomly selected songs from each bird was analyzed (range, 10–100 songs; mean, 69 songs). These songs were taken from multiple days and always from morning hours (the first 5 h after the lights are turned on in a 14 h day) to avoid diurnal effects on syllable phonology and sequencing. In total, we analyzed 90,494 syllables in 963 songs from BF01 to BF14 and 13,637 syllables in 240 songs (120 before deafening and 120 after deafening) from BF15 through BF18. Birds BF15 through BF18 were deafened by removal of the cochlea using techniques described previously (Brainard and Doupe, 2001; Sakata and Brainard, 2006). All procedures were performed in accordance with established animal care protocols approved by the University of California, San Francisco, Institutional Animal Care and Use Committee.
Measuring spectral features
Songs were segmented into syllables using amplitude thresholds. Syllables were then visually labeled using a different letter for each unique syllable in the bird's song. The syllable labeling was performed within each bird, with no spectral relationship between syllables receiving the same label in two different birds' repertoires. The visual labeling was subsequently validated quantitatively, as described below. The validation procedure began by quantifying eight different spectrotemporal parameters for each syllable. This approach parallels those taken in several recent studies (Tchernichovski et al., 2001; Sakata et al., 2008; Sober et al., 2008; Hampton et al., 2009). The eight parameters (duration, fundamental frequency, time to half-peak amplitude, frequency slope, amplitude slope, spectral entropy, temporal entropy, and spectrotemporal entropy) were quantified as follows.
Duration.
Duration was defined as the time from the onset of the syllable to its offset.
Fundamental frequency.
Fundamental frequency was defined by performing an autocorrelation of the amplitude trace, as described previously (Sakata et al., 2008; Hampton et al., 2009). The time lag of the first nonzero lag peak of the autocorrelation was divided by the sampling rate to calculate the fundamental frequency. For syllables with flat frequency profiles (little change in frequency over time), the fundamental frequency measurement was made over a 16 ms window, centered on the middle of the syllable. For frequency-modulated syllables, the measurement was made across a 16 ms window starting 5 ms after onset of the syllable.
Time to half-peak amplitude.
Time to half-peak amplitude was defined as the interval between the onset of the syllable and the time at which the (time-varying) amplitude of the syllable reached one-half of its maximal value.
Frequency slope.
Frequency slope was defined as the mean derivative of fundamental frequency over the central 80% of the syllable.
Amplitude slope.
Amplitude slope was defined as follows: Amplitude slope = (P2 − P1)/(P2 + P1), where P1 and P2 are the summed absolute acoustic power (across frequencies) of the first and second halves of the syllable, respectively. Positive values correspond to syllables that increase in amplitude with time, and negative values correspond to syllables that decrease in amplitude.
Spectral entropy.
Spectral entropy was defined as follows:
 |
where pf is the normalized absolute acoustic power at each frequency f up to 8 kHz. For this calculation, the power at each frequency was measured across the entire syllable.
Temporal entropy.
Temporal entropy was defined as follows:
 |
where at is the normalized acoustic power at each time. The amplitude waveform was calculated by first rectifying and then smoothing the oscillogram representing the syllable with a 5 ms Gaussian window.
Spectrotemporal entropy.
Spectrotemporal entropy was defined as follows:
 |
where pt,f is the normalized absolute acoustic power at each frequency f up to 8 kHz in each time bin t during the syllable.
Determining syllable similarity
The eight acoustic parameters were calculated for every syllable from the songs of each bird. Each parameter was then transformed into a z-score (across all syllables from all birds) so that each parameter had a mean of zero and was measured in units of SDs from the mean. Data from hearing and deafened birds were considered separately in this analysis. A principal components analysis (PCA) was then performed on all z-score values. Performing the PCA on the entire dataset provided a single coordinate frame in which to describe and compare acoustic data from multiple birds. After the PCA was performed, the variance explained was plotted versus number of principal components to determine how many components to use for subsequent analysis. The first six principal components explained 95% of the variability in the data set (see supplemental Fig. 1, available at www.jneurosci.org as supplemental material), and the subsequent analysis was therefore based on these six components.
The acoustic similarity of two syllables was determined by measuring the distances between them in the coordinates of the six principal components (“PCA space”). Plotting a syllable in terms of its first three principal components provides an intuitive representation of PCA space. Figure 2d shows the mean ± 1 SD ellipsoids for the first three principal components of the syllables in BF03's song. For example, the ellipsoid labeled “F” in Figure 2d illustrates the mean and SD of the PCA values of 234 individual renditions of syllable F. Distance measurements can be made in three-dimensional space, but by extending to the full six principal components, a more complete description of syllable structure can be determined. The Euclidean distance between the centers of mass (COMs) in six-dimensional space was used to calculate the similarity of syllables. Syllables that are more acoustically different have larger distances between their centers of mass (means) in PCA space than those that are more similar to each other.
Figure 2.

Measurements of syllable structure. a, Spectrogram and smoothed, rectified amplitude waveform for syllable J of BF03. b, Spectrogram and smoothed, rectified amplitude waveform for syllable C of BF03. c, Spectrogram and smoothed, rectified amplitude waveform for syllable I of BF03. d, Example of syllable clustering after PCA. Plotted are mean ± 1 SD ellipsoids for the first three principal components of nine differently labeled syllables in the song of BF03.
Bengalese finches usually begin their songs with a series of low-amplitude, noisy introductory notes. Introductory notes also exhibit an extremely high level of acoustic variability, and including them in the PCA caused the analysis to select principal components that captured the variability within introductory notes (rather than the variability across different song syllable types or in the context of different sequences), thereby reducing our ability to derive meaningful measurements of the acoustic similarity of song syllables. Because our interest specifically pertains to the phonology and sequencing of song syllables, introductory notes were not included in the analysis.
Validation of syllable labels
We used the COM distance measure to validate our visual identification of song syllables. Because consistent phonological differences were observed when the same syllable was produced in different sequences (see Results), we sought to demonstrate that these sequence-dependent differences in phonology were smaller than the phonological differences found between differently labeled syllables in a bird's repertoire.
The labels assigned visually to convergent and divergent syllables were therefore compared with their categorization based on our PCA metric. This comparison was made by measuring the COM distance between the variants of the convergent (or divergent) syllable produced in two different sequences (e.g., measuring the COM distance between syllable AC and syllable BC, where C is a convergent syllable preceded by either A or B), and comparing that distance to the distances between all differently labeled pairs of syllables in the bird's repertoire. In 61 of 65 cases, PCA-based quantification confirmed that the COM distance between the variants of a given syllable in different sequences was smaller than the COM distances between all other pairs of syllables. The remaining cases (4 of 65) generally involved low-amplitude, noisy syllables that resembled introductory notes and yielded highly variable acoustic measurements. Because these syllables were not well described by our acoustic analysis, we took a conservative approach and excluded them from additional analysis.
Selection of convergent and divergent syllables
The sequencing of syllables in Bengalese finch song is highly variable. For instance, in the typical example of Bengalese finch song shown in Figure 1, a and b, syllable C is produced in a divergent sequence (CH vs CD). In the example song shown in Figure 1, c and d, syllable L is produced in a convergent sequence (KL vs PL). To differentiate interactions between sequence and phonology at convergences from those at divergences, we define “divergent” and “convergent” syllables by requiring that there must be at least two syllables in common in the sequence variants being compared. That is, syllable C in Figure 1b is divergent because in all instances C is preceded by a common syllable (BCD vs BCH). Similarly, syllable L in Figure 1d is convergent because in all instances L is followed by a common syllable (KLM vs PLM).
Figure 1.

Bengalese finch song and variable sequencing. a, Spectrogram showing part of a song produced by BF01. Syllables are labeled with unique letters. Note that some syllables are found embedded in multiple sequences. b, Syllable transition diagram for the song of BF01. The directions of the arrows represent possible transitions from one syllable to another, with all possible syllable transitions shown, including those not displayed in the segment of song shown in a. Syllables X and Y are not produced in the fragment of song displayed in a. We refer to a syllable that can be followed by more than one syllable as a divergent syllable (e.g., syllable C, highlighted in red, is a divergent syllable that can be followed by syllable D or H). c, Spectrogram of part of a song produced by BF02. d, Transition diagram for the song of BF02 with plotting conventions as in b. We refer to a syllable that can be preceded by more than one syllable as a convergent syllable (e.g., syllable L, highlighted in blue, is a convergent syllable that can be preceded by syllable K or P). In both b and d, some introductory notes (see Materials and Methods) have been excluded from the transition diagrams for visual clarity.
Note that, in some cases, this selection technique allows us to use certain instances of a syllable as both a convergent and a divergent syllable. For example, syllable P in Figure 1d might be used as a convergent syllable by selecting instances produced in some pairs of sequences (MPL vs NPL) and used as a divergent syllable by selecting instances produced in other pairs of sequences (NPJ vs NPL). Overall, 15 syllables were used solely as convergent syllables, 6 syllables were used solely as divergent syllables, and 20 syllables were used as both convergent and divergent, resulting in a total of 15 + 20 = 35 convergent and 6 + 20 = 26 divergent syllables.
The criterion for selecting convergent and divergent syllables was made even stricter in the analysis presented in Figure 5. Here, to analyze phonological variations at longer timescales, we required that convergent/divergent syllables must be followed/preceded by two common syllables (e.g., ABXZ and CBXZ would be an acceptable convergence). Applying this stricter criterion, we identified 29 convergent syllables and 26 divergent syllables.
Figure 5.

Temporal extent of sequence-dependent phonological differences. a, Nomenclature for the syllables adjacent to convergent and divergent syllables. The two syllables after a convergent syllables are referred to as convergent +1 and convergent +2 as shown. The syllables before a divergent syllables are referred to as divergent −1 and divergent −2. b, Extent of sequence-dependent phonological differences. Shown are mean ± SE values for the syllables described in a. Significant differences in COM distances are numbered (blue asterisk, p = 0.01, Wilcoxon signed-rank test; black asterisks, p < 0.05, two-sided KS test). The dashed red and blue lines represent the chance level of COM distance (that is, the distribution of COM distances under the null hypothesis that no sequence-dependent phonological differences exist) (see Materials and Methods). All six COM distances shown in red and blue were significantly greater than chance (p < 0.0001 for all cases, one-sided KS test).
Testing the significance of sequence-dependent phonological differences
A resampling technique (Good, 2006) was used to determine the statistical significance of phonological differences observed between different syllables and between variants of the same syllable produced in different sequences. For example, to determine whether phonological differences between AB (A followed by B) and AC (A followed by C) were significant, we pooled the PCA values from all renditions of AB and AC. Samples were then randomly drawn (with replacement) from this combined distribution to create two randomized datasets of the same size as the true datasets. These randomized datasets represent the null hypothesis that no significant phonological difference exists between AB and AC. The COM distance between these two randomized datasets was then calculated. This procedure was repeated 10,000 times, resulting in a distribution of COM distances under the null hypothesis. The actual COM distance between AB and AC was then compared with the null distribution. If the actual COM distance was beyond the 95th percentile of the null distribution, then the sequence-dependent phonological difference between AB and AC was considered significant (at p < 0.05). This analysis was done for each convergent and divergent syllable and was also used to assess the significance of phonological differences between differently labeled syllables.
To determine whether a group of sequence-dependent phonological differences (e.g., all phonological differences at convergent syllables) was significantly greater than chance, we used a resampling technique similar to the one described above for determining the significance of such differences at individual syllables. To establish the significance of a group of phonological differences observed at divergent syllables, for example, we computed a null distribution of COM values (as described above for syllables AB and AC) for each divergent syllable. We then found the mean of each null distribution, which reflects the expected COM distance for each divergent syllable in the absence of any effect of sequence. For N divergent syllables, we would therefore obtain N such COM values. The distribution of null values (see dashed lines in Fig. 5 and supplemental Fig. 3, available at www.jneurosci.org as supplemental material) was then compared with the distribution of COM values taken from the true dataset to compute significance.
Reference values for COM distances
To provide a reference for evaluating the magnitude of acoustic differences, we derived estimates of the lower and upper boundaries for COM distances in our dataset. For a lower COM boundary, we calculated the COM distance between renditions of the same syllable produced in the same sequence to derive an estimate of the minimum level of acoustic differences in our dataset. We refer to this as a measure of COM distance for “same syllable, same sequence,” or SS, in Results. For this measure, the distribution of PCA values for a given syllable in a fixed sequence was randomly split into two groups, and the COM distance between each randomly selected group was calculated. This was repeated 1000 times, and the mean of all 1000 comparisons was used as a lower boundary estimate on COM distances. For an upper boundary, the COM distance between differently labeled syllables was calculated to derive an estimate of the maximum level of acoustic difference in our dataset. The rationale was that the greatest acoustic difference as determined by COM distance should be between syllables that were originally identified with different labels. We refer to this as a measure of COM distance for “different syllables,” or DIFF, in Results. These lower and upper boundary estimates provided a reference for the magnitude of COM distances between the variants of a convergent (or divergent) syllable produced in different sequences. Differences in COM value distributions for groups of syllables were tested for significance using a two-sided Kolmogorov–Smirnov (KS) test.
Deafened bird comparisons
We also quantified the magnitude of sequence-dependent differences in phonology at convergent syllables before and after deafening. For each deafened bird, forty songs recorded before deafening were compared with forty songs recorded after deafening. Convergent syllables were identified in the predeafening songs, and only those convergent syllables were analyzed in the postdeafening songs. All predeafening songs were collected in the week before deafening, and postdeafening songs were collected within 1 week after deafening. By only using songs sung within 1 week of deafening, any long-term effects of deafening (i.e., central rearrangements) were limited. Predeafening and postdeafening comparisons were paired, and a Wilcoxon signed-rank test was used to test for significant effects of deafening.
Neural recordings and physiological data analysis
Single-unit and multiunit recordings of RA neurons were collected from 13 of the 14 nondeafened birds. We previously analyzed a distinct data set from these same animals in a study examining how trial-by-trial variations in RA activity affect the pitch, amplitude, and spectral entropy of song syllables (Sober et al., 2008). Briefly, birds were implanted with microdrives that were used to lower arrays of three to five high-impedance microelectrodes into RA. By advancing the electrode arrays, we recorded extracellular voltage traces reflecting the activity of RA neurons in birds producing undirected song (i.e., no female was present). In total, we recorded from 25 single neurons and from 120 multiunit sites. Based on the response properties and spike waveforms of our recordings, these recordings were classified as putative RA projection (output) neurons, which send their axons to motor nuclei in the brainstem (Spiro et al., 1999; Leonardo and Fee, 2005; Sober et al., 2008).
To analyze differences in neural activity at convergent and divergent syllables, we computed the discriminability index, or d′, which provides a quantitative measure of the difference between two variable signals as follows:
 |
Here, a and b represent instantaneous firing rates recorded when the same syllable is produced in two different sequences. Instantaneous rates were derived by convolving spike times with a 5 ms square filter.
We used the d′ statistic to quantify the differences in premotor neural activity that occur when the same syllable is produced in two different sequences. We computed the mean d′ value across the duration of the convergent or divergent syllables. To compensate for the premotor latency (the delay between neural activity in RA and its effect on behavior), we used the smoothed neural activity from 25 ms before syllable onset until 25 ms before syllable offset. This estimate of the premotor latency is consistent with those of previous studies (Vu et al., 1994; Fee et al., 2004; Ashmore et al., 2008; Sober et al., 2008). In total, we analyzed 259 cases of neural activity at convergent syllables (24 with single-unit data, 235 with multiunit data) and 218 cases of neural activity at divergent syllables (21 single-unit, 197 multiunit). When calculating how d′ varies with time near the onset or offset of a convergent or divergent syllable (see Fig. 11), d′ was computed in 5 ms bins.
Figure 11.
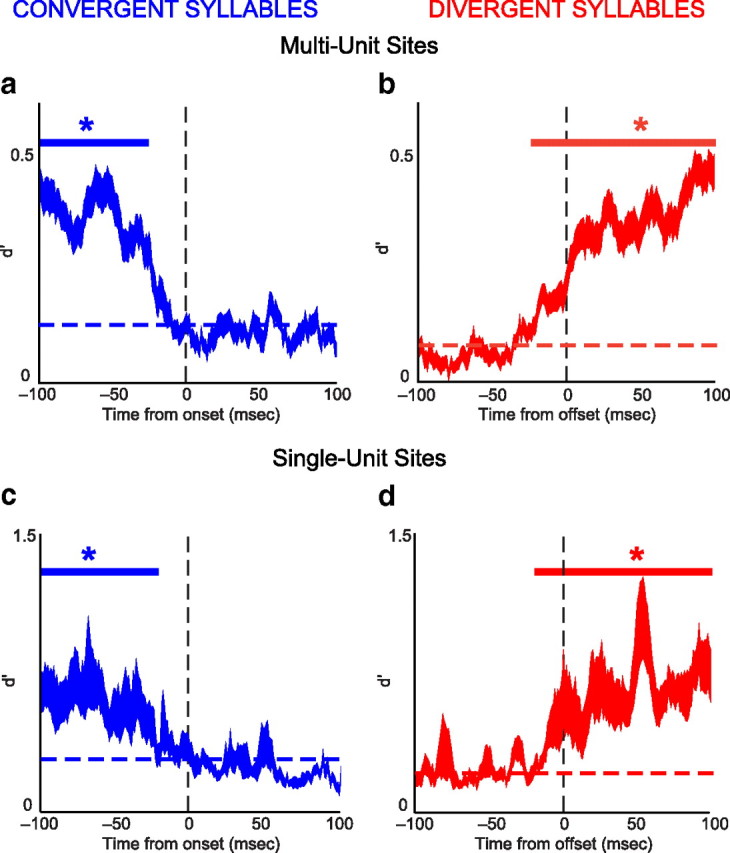
Time-varying differences in neural activity at convergent and divergent syllables. The mean ± 1 SE difference (d′) between neural activity recorded when the same syllable is produced during different sequences. a, c, Differences in neural activity for multiunit and single-unit sites, respectively, averaged across all convergent syllables, aligned at the onset of the convergent syllable. The solid blue line at top indicates when d′ values differed significantly (KS test, p < 0.05) from the d′ in the 5 ms bin immediately after syllable onset (dashed blue line). b, d, Differences in neural activity for multiunit and single-unit sites, respectively, averaged across all divergent syllables, aligned at the offset of the divergent syllable. The solid red line at top indicates when d′ values differed significantly from the 5 ms bin immediately after the onset of the divergent syllable (dashed red line).
We used a resampling technique analogous to that applied to syllable phonology to determine whether RA activity differed significantly when the same syllable was produced in different sequences (Good, 2000). For example, to determine whether d′ values for neural activity recorded during AB (A followed by B) and AC (A followed by C) were significantly different, we pooled the smoothed rectified neural activity recorded during all renditions of AB and AC (offset by the 25 ms premotor latency). Individual neural recordings were then randomly drawn (with replacement) from this combined distribution to create two randomized datasets to form a synthetic dataset in which no sequence-dependent difference differences in neural activity existed. The d′ value for these two randomized datasets was then calculated. This procedure was repeated 10,000 times, resulting in a distribution of d′ values under the null hypothesis. The original d′ value between AB and AC was then compared with the null distribution. If the d′ value from the real data was beyond the 95th percentile of the null distribution, then the original d′ was considered significant (at p < 0.05).
Results
Bengalese finch song is composed of acoustically continuous segments, or “syllables,” surrounded by short periods of silence (Fig. 1a). The complex sequencing of Bengalese finch song is often represented with a transition diagram. The transition diagram shown in Figure 1b illustrates the variability in syllable sequence typical of Bengalese finch song. The example song contains 11 different syllables (labeled A–I, X, and Y), and has six “branch points” (syllables A–C, F, I, and Y), or places in song where sequencing is probabilistic rather than deterministic. For example, syllable C can be followed by syllable D or H. We refer to these different contexts for syllable C as CD and CH, respectively. Syllable C in these instances is a divergent syllable, because it can be followed by one of several different syllables (the song can diverge to multiple syllables after C). In contrast, syllable L in Figure 1, c and d, can follow syllable K or P. We refer to these different contexts for syllable L as KL, and PL. Syllable L is therefore a convergent syllable, because it can be preceded by several different syllables (the song can converge to syllable L from multiple different syllables). Such variable sequencing is ubiquitous in Bengalese finches, with all recorded birds having at least one syllable used in multiple sequences. As described in Materials and Methods, we defined convergent and divergent syllables by identifying sequences that had at least two syllables in common, and some syllables served as examples of both convergent and divergent syllables. For example, we might examine a hypothetical syllable E as a convergent syllable across the sequences CEB versus AEB and as a divergent syllable across the sequences CED versus CEB. The 14 normal adult birds in this study sang a total of 115 different syllables, of which we identified 35 examples of convergent syllables and 26 examples of divergent syllables.
Representing a bird's song with a transition diagram, as has been done in many previous studies (Sossinka and Bohner, 1980; Scharff and Nottebohm, 1991; Okanoya, 2004; Sakata et al., 2008; Hampton et al., 2009), implies that sequence and phonology are independent. Put another way, the diagram shown in Figure 1b suggests that the phonology of syllable C is invariant with respect to the sequence in which it is embedded. To test whether sequence and phonology are indeed independent, we quantified the acoustic similarity between syllables produced in more than one sequence (all convergent and divergent syllables) and asked whether the phonology of a given syllable varies when that syllable is embedded in different sequences.
Quantification of acoustic similarity
To quantify acoustic similarity between different syllables (and between the same syllable produced in different sequences), we measured eight acoustic features of each syllable. PCA was then performed on these eight acoustic parameters for all renditions of syllables collected from all birds (see Materials and Methods). Figure 2a–c shows mean spectrograms and smoothed, rectified amplitude waveforms for three syllables (labeled by visual inspection) from one bird in our study (BF03). Figure 2d shows the mean ± 1 SD ellipsoids for all nine syllables produced by this bird, represented in the dimensions of the first three principal components. The large separation between the ellipsoids (which was typical of all birds in our study) shows that the visually assigned syllable labels indeed represent distinct categories of vocalizations.
By providing a compact representation of the acoustics of each syllable, this analysis allows a straightforward technique for quantifying the similarity of two syllables. We used the Euclidean COM distance between each pair of syllables as a measure of acoustic similarity, reasoning that COM distances will be smaller for acoustically similar syllables. Analysis of intersyllable COM distances validated our visually defined labels: for every bird in our study, each syllable was found to be significantly different from every other syllable in the bird's repertoire (i.e., the COM distances between pairs of differently labeled syllables were significantly greater than that expected by chance, p < 0.0001 for all pairs of syllables) (see Materials and Methods).
Syllable phonology varies significantly across different sequences
We quantified phonological differences that occur when the same syllable is used in different sequences using the same technique. An example of this analysis performed on a convergent syllable is shown in Figure 3a–d. Syllable B in this bird's song is preceded by either syllable A (AB) or syllable K (KB). A significant difference in duration was observed when B was produced in these two sequences: syllable KB was significantly longer than syllable AB (average spectrograms in Fig. 3b; distribution of durations in Fig. 3c), demonstrating that sequence-dependent phonological differences can sometimes be observed by examining a single acoustic parameter. Shown in Figure 3d are the mean ± 1 SD ellipses for the first and second principal component values of syllables KB and AB, as well as those for the other syllables in the bird's song. The distributions along the first two principal components for syllable B in each sequence are significantly different from each other (i.e., COM distances are significantly greater than chance; p < 0.0001) but are closer to each other than to any other syllable in the bird's repertoire.
Figure 3.

Sequence-dependent differences in phonology. a, Spectrogram of ∼1 s of song from BF04. The convergent syllable B is highlighted: AB in green and KB in red. b, Average spectrograms of 10 examples of syllable B in each sequence. c, Histogram of the durations of syllable B in each sequence. d, Mean ± 1 SD ellipses for the first two principal components (PC1 and PC2) of syllable B found in each sequence, as well as all other syllables from the bird's repertoire (in gray) for comparison. Syllable AB is significantly different from KB at p < 0.0001. e, Spectrogram of ∼1.5 s of song from BF05. Note that the letters assigned to each syllable are arbitrarily chosen for each bird, so that the acoustic similarity of syllable B in this case (for bird BF05) to syllable B from bird BF04 is not meaningful. The divergence from syllable B is highlighted: BC in green and BK in red. f, Average spectrograms of 10 examples of syllable B in each sequence. g, Histogram of the pitch of syllable B in each sequence. h, Mean ± 1 SD ellipses for the first two principal components of syllable B found in each sequence, as well as all other syllables from the bird's repertoire (in gray) for comparison. Syllable BB is significantly different from BC at p < 0.0001.
Sequence-dependent differences in phonology were observed at divergent syllables as well. Figure 3e–h shows an analysis of divergent syllable B, which can be followed either by syllable C (BC) or by syllable K (BK). Although BC and BK do not differ significantly when some acoustic parameters are considered individually (e.g., fundamental frequency, as shown in Fig. 3g), Figure 3h shows that when all acoustic parameters are taken into account in the PCA analysis, the ellipses for syllable B in each sequence are significantly different (p < 0.001) but are relatively distant from the ellipses representing other syllables in the bird's repertoire, as was the case in Figure 3d. For an analysis of how frequently each individual acoustic parameter differed at convergent and divergent syllables, see supplemental information (available at www.jneurosci.org as supplemental material, Sequence-dependent differences in individual acoustic parameters).
Sequence-dependent phonological differences: prevalence and magnitude
We analyzed all available convergent and divergent syllables to quantify the prevalence of sequence-dependent differences in phonology. We found significant phonological differences for 97% (34 of 35) of convergent syllables and for 92% (24 of 26) of divergent syllables. Hence interactions between syllable sequence and syllable phonology are very common in Bengalese finch song.
In addition to quantifying the prevalence of sequence-dependent differences in phonology, we also measured the magnitude of such effects. For each convergent syllable, we measured the COM distance between the variants of the syllable produced in different sequences (e.g., for the convergent syllable J in Fig. 4a, we measured the COM distance between HJ and LJ). Figure 4b (CONV, blue line) shows the distribution of COM distances determined in this fashion for all convergent syllables in our data set (n = 35; mean ± SD, 0.65 ± 0.52). For comparison, we determined a lower boundary for COM distances by measuring the COM distance between subsets of the data corresponding to multiple occurrences of the same syllable in the same sequence (e.g., for syllable ABC in Fig. 4a, we randomly separated all renditions into two groups and measured the COM difference between those groups) (see Materials and Methods). Figure 4b (green line) shows the distribution of COM distances for all such same syllable, same sequence (SS) measurements (n = 126; mean ± SD, 0.08 ± 0.05). COM distances for convergent syllables were significantly greater than COM distances for the same syllable, same sequence reference (p < 0.001, one-sided KS test), confirming that there was indeed an interaction between syllable sequence and phonology for convergent syllables. We also determined an upper boundary for COM distances by measuring the COM distances between differently labeled syllables (DIFF) (e.g., syllables N and P in Fig. 4a). Figure 4b (black line) shows the distribution of COM distances for all such pairwise comparisons of different syllables (n = 380; mean ± SD, 3.25 ± 1.23). Consistent with the examples in Figure 3, the COM distances for convergent syllables were less than COM distances for differently labeled syllables (p < 0.0001, one-sided KS test).
Figure 4.

Magnitude of sequence-dependent phonological differences. a, Examples of the four different relationships for which COM distances were measured: same syllable/same sequence (SS), divergent syllable (DIV), convergent syllable (CONV), and different syllables (DIFF). b, Probability distribution plots for COM distances of each syllable relationship outlined in a (color convention the same). All distributions are significantly different from each other (means ± SD: 0.08 ± 0.05, SS; 0.34 ± 0.31, DIV; 0.65 ± 0.52, CONV; 3.25 ± 1.25, DIFF; p < 0.05 for all combinations, two-sided KS test). The triangles mark mean values. Inset, Probability distributions for COM distances of CONV syllables and DIV syllables. COM distances for CONV syllables are significantly higher than for DIV syllables (p = 0.004, one-sided KS test).
For each divergent syllable, we similarly measured the COM distance between the variants of the syllable produced in different sequences (e.g., for the divergent syllable E in Fig. 4a, we measured the COM distance between EF and EG). Figure 4b (red) shows the distribution of COM distances determined in this fashion for all divergent syllables (DIV) in our data set (n = 26; mean ± SD, 0.34 ± 0.31). As was the case for convergent syllables, the COM distances for divergent syllables were greater than the COM distances for same syllables in same sequences, but were less than the COM distances for differently labeled syllables (p < 0.0001 for both comparisons, one-sided KS tests). Furthermore, we found that the COM distances were significantly smaller for divergent than for convergent syllables (Fig. 4b, inset) (p < 0.005, one-sided KS test). This indicates that the sequence-dependent phonological differences were greater at convergent syllables than at divergent syllables.
Interactions between sequence and phonology extend across multiple syllables
The results presented above describe sequence-dependent phonological differences at convergent and divergent syllables. To investigate the temporal extent of these effects, we asked whether similar phonological differences are found multiple syllables away from each branch point (see schematic in Fig. 5a). As shown in Figure 5b, we found that, when produced in different sequences, COM distances for syllables one and two positions after convergent syllables (“convergent +1” and “convergent +2”) as well as syllables one and two positions before divergent syllables (“divergent −1” and “divergent −2”) were significantly greater than chance (Fig. 5b, each blue and red point vs the dashed lines representing chance level for convergent and divergent syllable COM values) (p < 0.0001, one-sided KS test). Chance distributions were computed using a resampling technique to remove the effect of sequence on COM values (see Materials and Methods). These data demonstrate that interactions between sequence and phonology are temporally extended, persisting at least two syllables away from convergent and divergent syllables. Additionally, further analysis demonstrated that sequence-dependent phonological differences are still significantly different as far as three syllables away from convergent syllables (supplemental Fig. 3, available at www.jneurosci.org as supplemental material). We did not have sufficient statistical power to determine whether such differences extend three syllables away from divergent syllables (see supplemental information, available at www.jneurosci.org as supplemental material, Longer sequences of convergent and divergent syllables).
Although significant interactions between sequence and phonology extended multiple syllables after convergent syllables (and before divergent syllables), there was an additional, temporally restricted effect of sequence on the phonology of the convergent syllables themselves. Sequence-dependent phonological differences were greater at the convergent syllable than at the convergent +1 syllable (Fig. 5b, blue asterisk) (p = 0.01, Wilcoxon's signed-rank test), demonstrating a significant decrease in COM distance with the number of syllables elapsed after a convergence. Additionally, COM distances were significantly greater at convergent and convergent +1 than at divergent and divergent −1 (Fig. 5b, black asterisks), suggesting an interaction between sequence and phonology that is both specific to convergent syllables and temporally restricted (i.e., there was no significant difference in COM distances between convergent +2 and divergent −2). Finally, unlike the temporally restricted effect found at convergent syllables, distance from divergent syllables did not result in a significant change in sequence-dependent phonological difference. The sequence-dependent COM distances found at divergent, divergent −1 and divergent −2 syllables were not significantly different from each other (Fig. 5b, red squares) (p > 0.25 for all combinations). As considered in detail in Discussion, these results suggest that sequence and phonology interact on two distinct timescales: a long-timescale interaction extending at least two syllables away from both convergent and divergent syllables, and a second, short-timescale interaction found only at convergent syllables (but not at either of the two syllables after a convergent syllable, at divergent syllables, or either of the syllables before a divergent syllable).
Motor history predicts phonological differences at convergent syllables
One possible explanation for the effects of sequence on phonology at convergent and divergent syllables is that they reflect mechanical and/or central constraints of transitioning between different vocal patterns. Effects on phonology at convergent syllables, for example, might result from the bird's failure to fully change the configuration of the motor periphery or patterns of premotor neural activity from the state necessary for the production of the previous syllables to that needed to produce the convergent syllable. Such a phenomenon (termed “perseverative coarticulation” or “motor inertia”) is thought to be common in the production of human speech (Ohman, 1966; Amerman et al., 1970; Daniloff and Hammarberg, 1973; Ostry et al., 1996). One prediction of this hypothesis is that the effects of sequence on phonology at convergent syllables should be correlated with the phonological differences between the two preceding syllables. That is, if the convergent syllable B can be preceded by either syllable A or syllable D (Fig. 6a), then the difference between AB and DB should be smaller if A and D are acoustically similar, and larger if A and D are acoustically very different.
Figure 6.

Relationships between sequence-dependent phonological differences and the phonological differences between adjacent syllables. a, Schematic of how the acoustic difference between syllables preceding a convergent syllable is compared with the size of sequence-dependent differences in phonology. Syllable B is found after either syllable A or D in the songs of BF06. The COM distance between syllables A and D is compared with the COM distance between AB and DB. This datum is plotted in green in b. b, Acoustic differences between syllables preceding a convergent syllable versus the size of sequence-dependent phonological differences. There is a significant, positive relationship between the COM distance separating the preceding syllables (pre-CONV COM distance) and the size of the sequence-dependent acoustic difference (CONV COM distance, p = 0.017; r = 0.40). c, Schematic of how the acoustic difference between syllables after a divergent syllable is compared with the size of sequence-dependent differences in phonology. Syllable A is found preceding either syllable B or another rendition of syllable A in the songs of BF07. The COM distance between syllables AB and AA is compared with the COM distance between A and B. This datum is plotted in green in d. d, Acoustic differences between syllables after a divergent syllable versus the size of sequence-dependent phonological differences. There is no significant relationship between the COM distance separating the following syllables (post-DIV COM distance) and the size of the sequence-dependent acoustic difference (DIV COM distance, p = 0.87).
We found that the magnitude of sequence-dependent effects on phonology at convergent syllables was indeed related to the magnitude of acoustic differences in immediately preceding syllables (Fig. 6a,b). For each convergent syllable, we measured both the COM distance between the variants of the convergent syllable when produced in the two different sequences (i.e., AB and DB in the example of Fig. 6a), and the COM distance between the immediately preceding syllables (i.e., A and D in Fig. 6a). Figure 6b shows that there was a significant positive correlation between the effects of sequence on phonology at a convergent syllable (“CONV COM distance”) and the acoustic difference between the immediately preceding syllables (“pre-CONV COM distance”; r = 0.40, p = 0.017). Hence, a significant component of the acoustic differences between the variants of a convergent syllable could be explained by acoustic differences between the syllables that preceded those variants. This relationship was restricted to the convergent syllable and was not present for the syllables that followed the convergent syllable (i.e., the convergent +1 and convergent +2 syllables schematically illustrated in Fig. 5a) (data not shown). These results suggest that part of the interaction between sequence and phonology at convergent syllables may reflect mechanical and/or central constraints in bringing the motor periphery from disparate states to the common state needed to produce the convergent syllable (see Discussion).
Sequence-dependent phonological differences at divergent syllables might similarly depend on the magnitude of acoustic differences in the syllables after the divergent syllable. For example, sequence-dependent differences in divergent syllables might result from the bird modifying the divergent syllable to anticipate the physical demands of producing the next syllables. Such anticipatory shaping is well documented in the human speech literature (Recasens, 1984; Ostry et al., 1996). A prediction of this hypothesis is that sequence-dependent effects on phonology at divergent syllables should be correlated with the phonological differences between the two following syllables. That is, if syllable A can be followed by either syllable B or another rendition of syllable A (Fig. 6c), then the difference between AA and AB should be smaller if A and B are acoustically similar, and larger if A and B are acoustically very different. To test this prediction, we compared the acoustic difference between the variants of the divergent syllable (“DIV COM distance”) with the acoustic difference between the two syllables after the divergent syllable (“post-DIV COM distance”). In contrast to the relationship at convergent syllables, no significant correlation was observed (Fig. 6d) (r = −0.03; p = 0.87), suggesting that the sequence-dependent phonological differences at divergent syllables do not reflect anticipatory positioning of the vocal effectors.
Motor versus auditory contributions to sequence-dependent phonological differences
Convergent syllables differ from divergent syllables in that auditory feedback may vary greatly before convergent syllables (i.e., feedback from different syllables), whereas it is relatively similar before divergent syllables. As shown in the inset of Figure 4b, sequence-dependent acoustic differences observed at convergent syllables are significantly larger than those observed at divergent syllables. It is therefore possible that a portion of the effects of sequence on phonology at convergent syllables is attributable to differences in recent auditory history. Song nuclei in the bird brain have been shown to be responsive to a bird's own song (Margoliash, 1986; Doupe and Solis, 1997; Mooney et al., 2001; Sakata and Brainard, 2008), and differences in auditory feedback in singing birds can affect the descending motor program (Sakata and Brainard, 2008). To assess the effects of auditory feedback on syllable phonology, we compared the size of sequence-dependent differences in phonology at convergent syllables in Bengalese finches immediately before and soon after deafening (Fig. 7). We found no significant change in this measure as a result of deafening (p = 0.41, Wilcoxon's signed-rank test). These data suggest that the differences in phonology observed at convergent syllables do not result from differences in recent auditory history.
Figure 7.

Effect of deafening on phonology. Sequence-dependent phonological differences at convergent syllables before and after deafening (n = 4 birds). No significant difference was found as a result of deafening (p = 0.41, Wilcoxon signed-rank test), and the slope of a regression line (data not shown) fit to the data was not significantly different from unity.
Evaluating central contributions to sequence-dependent changes in syllable phonology
The observed interactions between syllable sequence and phonology might reflect sequence-dependent differences in premotor neural activity, the dynamics of the vocal motor periphery, or some combination thereof. For example, the phonological differences at convergent syllables (Figs. 4b, 5b) and the correlation between the COM distance between the preceding syllables and the magnitude of such differences (Fig. 6b) might reflect history-dependent differences in premotor neural activity or history dependence in the vocal effectors (or both). To assay the contribution of central influences to sequence-dependent differences in phonology, we collected chronic neural recordings in singing Bengalese finches (a total of 25 single units and 120 multiunit sites in 13 of the 14 nondeafened birds) in the RA of the avian song system (see Materials and Methods).
We focused our recordings on RA because this nucleus receives input signals from nucleus HVC related to timing within a song (Hahnloser et al., 2002) and sends a pattern of output to brainstem motor circuits that uniquely specifies the syllable being produced (Yu and Margoliash, 1996; Leonardo and Fee, 2005), suggesting a hierarchical control structure in which HVC and RA regulate sequence and phonology, respectively. (For a schematic of the brain structures involved in song production, see Fig. 8.) Although the behavioral data described above demonstrate that phonology varies with sequence, these variations may or may not reflect a difference in RA activity. In other words, RA neurons might fire identically when the same syllable is produced in different sequences, with the observed sequence-dependent phonological differences resulting from history dependence in the vocal periphery. In this case, RA activity would encode the identity (rather than the phonology) of the syllable being produced. Finding sequence-dependent differences in RA activity, however, would suggest a central source for such sequence-dependent acoustic differences. Furthermore, such a finding would argue against a strictly hierarchical neural control structure, since sequence-related neural signals in RA might influence the sequencing of future song syllables via ascending projections from RA to HVC (Fig. 8, dotted line) or indirect projections from the targets of RA in the brainstem (Fig. 8, dashed line) to forebrain motor centers (Vates et al., 1997; Reinke and Wild, 1998; Striedter and Vu, 1998; Roberts et al., 2008).
Figure 8.
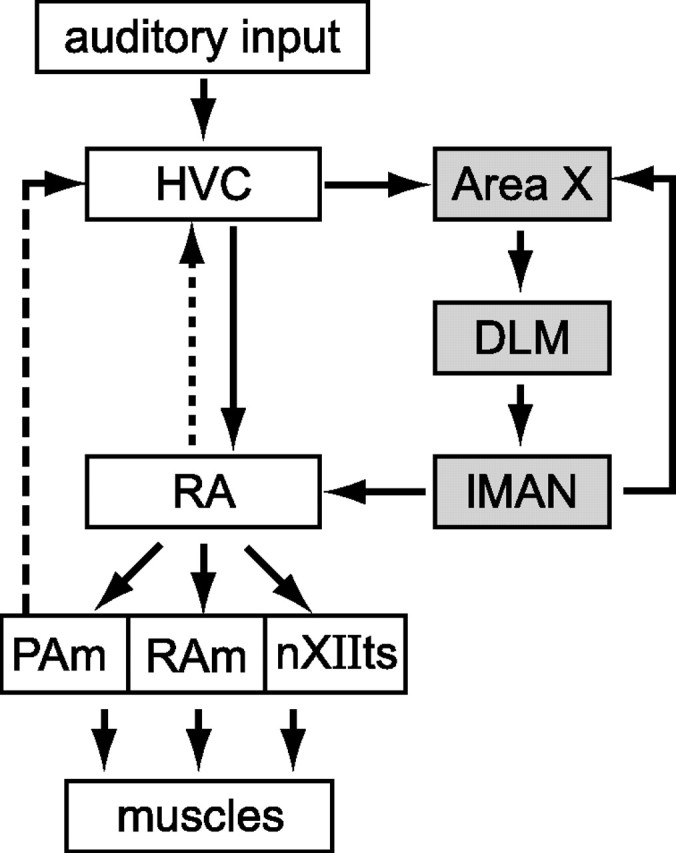
The song system. The song system includes a direct motor pathway consisting of nuclei HVC and RA and an AFP (gray boxes) containing area X, the medial portion of the dorsolateral thalamus (DLM) and lMAN. RA sends projections to brainstem motor nuclei retroambigualis (RAm) and paraambigualis (PAm), which innervate the respiratory musculature, and to the tracheosyringeal portion of the 12th motor nucleus (nXIIts), which innervates the muscles of the syrinx (vocal organ). A recurrent motor pathway (dashed line) indirectly connects respiratory nucleus paraambigualis back to HVC (Reinke and Wild, 1998; Striedter and Vu, 1998) via a network of midbrain and thalamic nuclei (data not shown). Additionally, RA sends a reciprocal projection (dotted line) back to HVC (Roberts et al., 2008).
Figure 9 shows examples of single-unit and multiunit activity in RA at a convergent (Fig. 9a) and divergent (Fig. 9b) syllable. Qualitatively, it is apparent that neural activity is more similar when the bird is singing the same syllable in two sequences (e.g., syllable B in sequences 1 and 2 in Fig. 9a) than when the bird is producing two different syllables (e.g., syllable C in sequence 1 vs syllable D in sequence 2 in Fig. 9a). Additionally, subtle sequence-dependent differences in RA activity were sometimes apparent when the same syllable was produced in two different sequences. An example of this can be seen in the second single-unit recording in Figure 9a, where a burst during convergent syllable A (the premotor window for which is shaded in gray) contained noticeably fewer spikes in sequence CAB (white arrowhead) than in sequence DAB (black arrowhead). This sequence-dependent difference in neural activity might therefore contribute to the acoustic difference between syllable A in sequences CAB and DAB. Furthermore, note that spiking activity during syllable A provides information about the previous sequence of syllables.
Figure 9.
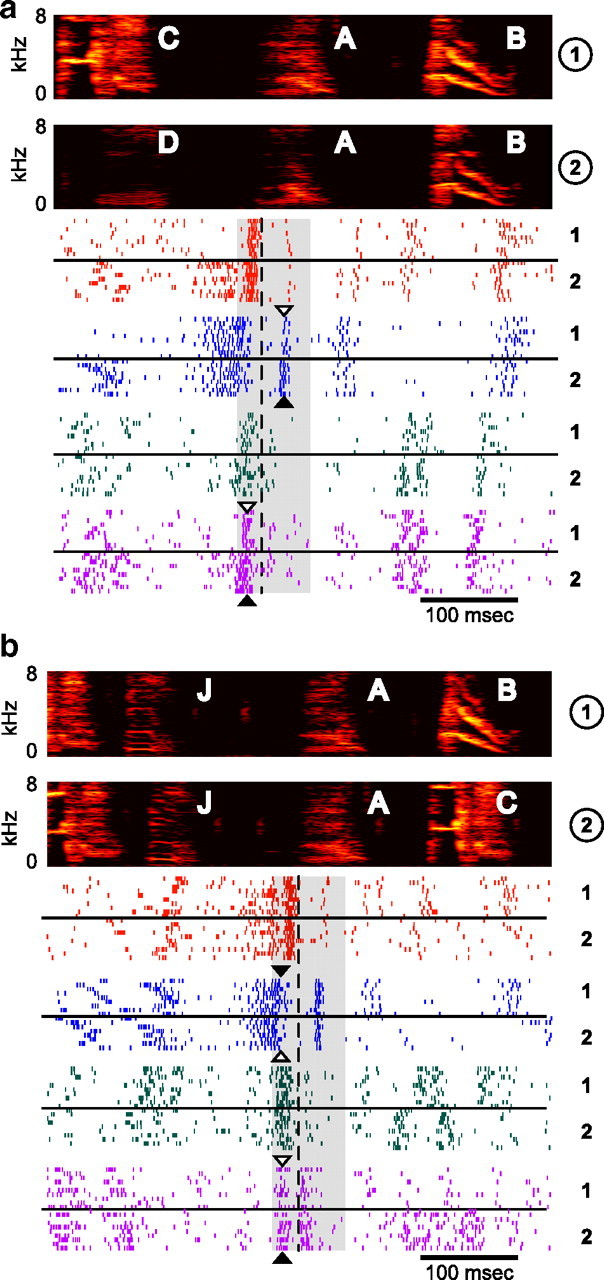
RA activity at convergent and divergent syllables. a, Examples of four RA recordings (2 single-unit, top; and 2 multiunit, bottom) during convergent syllable A from BF08. Spectrograms (top) show examples of convergent syllable A sung in two different sequences (labeled 1 and 2 at right). Raster plots show spike times (aligned at the onset of syllable A; dashed line) for 10 trials in each of the two sequences, as labeled to the right of each example. The premotor window for syllable A is shaded in gray. b, Four RA recordings (2 single-unit, top; and 2 multiunit, bottom) during divergent syllable A in the same bird (for an explanation of how a syllable can be both convergent and divergent, see Materials and Methods). Plotting conventions are as in a. Differences in neural activity, which were quantified using the d′ statistic (see text), are sometimes visible by eye, as in the case of the unit shown in blue in a, in which a burst during the production of syllable A has significantly more spikes during sequence 2 (black arrowhead) than sequence 1 (white arrowhead). Other instances of sequence-dependent differences in neural activity are highlighted with black and white arrowheads, which indicate the context in which more or fewer spikes were produced, respectively.
Quantifying sequence-dependent differences in premotor neural activity
We computed the discriminability index d′ to quantify sequence-dependent differences in RA activity (see Materials and Methods), as illustrated in Figure 10. Shown, top to bottom, are the spectrograms, raster plots, smoothed firing rates, and d′ as a function of time for a convergent and divergent syllable. In Figure 10a, the pattern of RA activity differs during the production of syllables C and D, and then converges to a more similar pattern during the production of the convergent syllable A and the subsequent syllable B. That neural activity becomes more similar as the sequence converges can also be seen in the d′ statistic, which is larger before the convergent syllable than after. Conversely, in Figure 10b, the pattern of RA activity is similar during the production of syllables J and A at the beginning of the two sequences and then diverges during the production of syllables B and C. This can be seen quantitatively in the d′ measurement, which is larger after the sequences have diverged.
Figure 10.

Quantifying sequence-dependent differences in neural activity. a, Comparing RA neural activity across sequences at a convergent syllable. Top, Spectrograms of convergent sequences CAB and DAB in BF08 and raster plot of activity in a single RA neuron during 10 iterations of CAB (blue) and DAB (orange). Other plotting conventions are as in Figure 9. Middle, Smooth rectified firing rates. Bottom, Difference between the smoothed firing rates (d′) in the two sequences as a function of time. b, Comparing RA neural activity across sequences at a divergent syllable. Shown are spectrograms and firing rates for convergent sequences JAB and JAC. Other plotting conventions are as in a.
We used the d′ statistic to distinguish between three possibilities for how RA activity might differ when the same syllable is produced in different contexts, as described in Introduction. The first possibility is that RA activity accompanying the same syllable in different contexts will be no more closely related than RA activity underlying the production of two unrelated syllables. As shown in Figure 11, analysis of the d′ statistic combined across all sequences demonstrates that RA activity is significantly more similar when the same syllable is produced in different contexts than when two different syllables are produced. Quantifying the d′ statistic as a function of time showed that neural activity during a convergent syllable produced in two different sequences (times greater than zero in Fig. 11a,c) was significantly more similar (i.e., had a lower d′ value) than the preceding activity, which occurred during the production of different syllables. Similarly, neural activity during a divergent syllable produced in two different sequences (times less than zero in Fig. 11b,d) was significantly more similar than the subsequent activity, which likewise occurred during the production of two different syllables. These results, along with our comparison of the magnitude of mean d′ values during convergent and divergent syllables with those during unrelated syllables (see below), demonstrate that sequence-dependent differences in neural activity are significantly smaller than those that occur when different syllables are produced.
Determining the premotor latency for RA activity
For multiunit activity, differences in d′ ceased to be significant 25 ms before the onset of convergent syllables (Fig. 11a, blue bar) and achieved significance 25 ms before the offset of divergent syllables (Fig. 11b, red bar). For single-unit recordings, significance ended 20 ms before syllable onset at convergent syllables (Fig. 11c, blue bar) and began 20 ms before divergent syllable offset (Fig. 11d, red bar). Based on these results, we chose a 25 ms premotor latency (see Materials and Methods) in the analysis described below (Fee et al., 2004; Ashmore et al., 2005; Sober et al., 2008).
Sequence-dependent differences in neural activity: prevalence and magnitude
We evaluated the second possibility posited in Introduction—that neural activity is identical when a syllable is produced in two different contexts—by using a resampling technique to determine the significance of sequence-dependent differences in RA activity (see Materials and Methods). Briefly, we estimated the null distribution of d′ values expected in the absence of sequence-dependent differences in neural activity and then determined whether the mean value of d′ during the production of each convergent or divergent syllable (offset by the 25 ms premotor latency) exceeded the 95th percentile of the null distribution. At convergent syllables, single-unit neural activity differed in 63% (15 of 24) of cases and multiunit activity differed in 81% (190 of 235) of cases. These results suggest that changes in RA activity underlie sequence-dependent phonological differences and demonstrate that neural activity during convergent syllables often reflects which song syllable was produced previously (Fig. 9a, arrowheads). At divergent syllables, single-unit neural activity differed in 62% (13 of 21) of cases and multiunit activity differed in 78% (153 of 197) of cases, indicating that activity in RA is also informative about the upcoming sequence of syllables (Fig. 9b, arrowheads). These results therefore demonstrate the prevalence of sequence-dependent differences in RA activity and rule out the possibility that identical patterns of RA population activity are produced when a syllable is produced in different contexts.
The d′ values for convergent and divergent syllables were significantly smaller than those observed during the production of different syllables. As described in Materials and Methods, we used the d′ values during the production of the different syllables as a control for the greatest expected difference in neural activity. During the production of convergent syllables in different sequences, neural activity was significantly more similar (i.e., d′ values were lower) than when two unrelated syllables were being produced (Fig. 12, blue and black lines) (one-sided KS test, p < 0.0001). RA activity was also significantly more similar during the production of divergent syllables than during the production of unrelated syllables (Fig. 12, red and black lines) (one-sided KS test, p < 0.0001). Together with the analysis shown in Figure 11, these results demonstrate that sequence-dependent differences in RA activity are smaller than those occurring during the production of different syllables.
Figure 12.

Comparison of RA activity for different categories of syllables. a, The probability distribution of d′ statistics of multiunit activity for each syllable category: same syllable, same sequence (SS) (green); divergent syllables (DIV) (red); convergent syllables (CONV) (blue); and differently labeled syllables (DIFF) (black). Distributions of neural d′ values for all syllable categories were significantly different from one another (KS test, p < 0.0001). b, The distribution of d′ values for single-unit activity for each syllable category: same syllable, same sequence (green); divergent syllables (red); convergent syllables (blue); and differently labeled syllables (black). Distributions of neural d′ values for all syllable categories were significantly different from one another (KS test, p < 0.05).
Additionally, sequence-dependent differences in neural activity were significantly larger at convergent syllables than at divergent syllables. For both single-unit (Fig. 12a) and multiunit data (Fig. 12b), RA activity varied more with sequence (higher d′) at convergent syllables than at divergent syllables (red and blue lines; one-sided KS test, p < 0.0001). This difference in the distribution of neural d′ values parallels that found in the acoustic analysis, in which COM distances were significantly greater at convergent syllables than at divergent syllables (Fig. 4).
Central contributions to sequence-dependent phonological differences
Analysis of the relationship between the size of sequence-dependent neural (d′) and phonological (COM) differences revealed that differences in RA activity during the production of a convergent or divergent syllable scale with the size of the associated phonological difference, consistent with the third possibility described in Introduction. Our results show that both acoustic (Fig. 4b) and neural (Fig. 12) measures are most similar when comparing the same syllable in the same sequence, significantly less similar at divergent syllables, less similar still at convergent syllables, and the least similar during the production of unrelated syllables. This pattern suggests that RA contributes to sequence-dependent variations in phonology at divergent and convergent syllables. We sought additional evidence for this hypothesis by comparing the acoustic similarity of each convergent or divergent syllable to the similarity of the neural activity during its production. Syllable similarity was quantified using COM distances as described above. The syllable similarity values were regressed against the corresponding neural d′ values for each recording site from each bird. We found significant positive correlations between both convergent and divergent syllable similarity and the similarity of premotor activity in RA (Fig. 13). Differences in neural activity therefore predict differences in syllable phonology in many cases, suggesting a central contribution (at the level of RA) to sequence-dependent differences in syllable phonology.
Figure 13.

Relationship between sequence-dependent differences in syllable phonology and RA activity. Phonological differences (COM distance) versus differences in RA neural activity (d′) at convergent (blue) and divergent (red) syllables. There is a significant, positive correlation between these quantities at both divergent (red; r = 0.56, p < 0.0001) and convergent (blue; r = 0.23, p < 0.0005) syllables. Values of d′ from multiunit recordings are plotted as circles, and single-unit recordings are plotted as squares.
Discussion
Our results demonstrate that the phonology of song syllables varies significantly when the same syllable is produced in different sequences. Sequence-dependent phonological differences extend at least two syllables away from both convergent and divergent syllables (Fig. 5). Additionally, a greater short-term difference is observed at convergent syllables than divergent syllables (Fig. 5, asterisks 2 and 3). Furthermore, we found a significant positive correlation between the level of acoustic difference between the syllables before a convergent syllable and the size of sequence-dependent phonological differences at the convergent syllable itself (Fig. 6b). We also examined the contribution of RA activity to sequence-dependent phonological differences. Our results demonstrate that RA activity often differs significantly when a syllable is produced in two different contexts and that differences in RA activity are proportional to differences in syllable phonology (Fig. 13), suggesting that variations in RA activity contribute to sequence-dependent phonological differences. Furthermore, the prevalence of sequence-dependent differences in neural activity demonstrates that the firing of RA neurons contains information about the upcoming (and previous) sequence of syllables.
Controlling the vocal periphery in birdsong and human speech
Our behavioral data indicate that the recent history of vocal production strongly influences the production of the current syllable. Sequence-dependent differences in phonology occurred at 97% of convergent syllables. These differences were significantly larger than those at subsequent syllables and at divergent syllables (Fig. 5b, asterisks 1 and 2, respectively). This suggests that increased phonological differences at convergent syllables (relative those at subsequent and divergent syllables) might result from physical constraints on the production of sequenced vocalizations. In this scheme, the song system would have more difficulty bringing the vocal apparatus to a particular state (in terms of airflow, muscle tensions, etc.) from two very disparate syllables than it would from two very similar syllables, resulting in greater sequence-dependent phonological differences in the former case than in the latter. The magnitude of sequence-dependent phonological differences at convergent syllables might therefore scale with the phonological difference between the preceding syllables (Fig. 6b) because differences in recent motor history prevent the song system from fully converging on a single state. Parallel results have been found in human speech. In vowel–consonant–vowel utterances, sequence-dependent acoustic differences in the final vowel are proportional to the differences in articulator positions throughout the sequence (Ohman, 1966; Recasens, 1984). Although previous studies have emphasized the contributions of peripheral motor constraints to such effects in human speech, our analysis of premotor neural activity suggests that carryover effects in songbirds may reflect both central and peripheral influences.
Sequence-dependent acoustic differences at divergent syllables were nearly as frequent (in 92% of cases) as those observed at convergent syllables. Unlike the pattern observed at convergent syllables, however, we found no correlation between the size of phonological differences at divergent syllables and the acoustic differences between the two immediately following syllables (Fig. 6d). Such correlations are, however, common at divergent phonemes in human speech (Ohman, 1966; Daniloff and Moll, 1968; Amerman et al., 1970) and are thought to reflect anticipatory adjustments that prepare the vocal periphery to produce different upcoming phonemes. Moreover (unlike the case for convergent syllables), there was no change in the magnitude of sequence-dependent phonological differences at divergent syllables versus preceding syllables (Fig. 5b, solid red line). These data argue that effects on the phonology of divergent syllables do not arise from constraints on transitioning to the next syllable. The lack of this effect in Bengalese finches might reflect either a difference in the challenges faced by the motor system or a difference in the ability of Bengalese finches and humans to make such adjustments. That is, birds may be able to make anticipatory adjustments in a way that does not alter the phonology of the divergent syllable, or birds may not be able to make such anticipatory adjustments at all.
Modulations of sequence and phonology: a common cause?
The extended timescale of interactions between sequence and phonology (at least two syllables away from the convergent/divergent syllable) (Fig. 5b) suggests that a single factor might simultaneously affect both the phonology of individual syllables and the statistics of transitions between different sequences. This common factor may be related to the bird's level of arousal and/or motivation to sing, which might vary over the course of single song bouts or longer timescales, resulting in correlations between sequence and phonology extending across multiple syllables. Song tempo and the underlying respiratory pattern vary over the course of the day and with the bird's level of arousal (Cooper and Goller, 2006; Glaze and Troyer, 2006). Furthermore, differences between directed song (sung to a female) and undirected song (sung in isolation) demonstrate that social context can have significant effects on both phonology and sequence (Sakata et al., 2008). These changes in song across social contexts are associated with differences in neural activity in the anterior forebrain pathway (AFP) (Hessler and Doupe, 1999; Kao et al., 2008), gene expression (Jarvis et al., 1998), and the biochemistry of the brain (Sasaki et al., 2006). Changes in arousal might therefore alter neural activity in RA and other song nuclei, resulting in coincident changes in sequence and phonology.
Central contributions to sequence-dependent phonological differences
Behavioral analysis alone cannot tell us whether sequence-dependent phonological differences result from differences in central motor planning or from history dependence in the vocal periphery. We found that RA activity differed significantly across sequences at convergent syllables in 79% of cases (combining single-unit and multiunit data) and that the magnitude of these differences was correlated with the magnitude of the differences in phonology (Fig. 13). Although these data do not rule out potential contributions by the dynamics of the vocal periphery, our results strongly suggest that differences in RA activity contribute to sequence-dependent phonological variation at convergent syllables. Sequence-dependent differences in premotor neural activity were observed in 76% of all divergent syllables and were similarly correlated with differences in premotor neural activity (Fig. 13), further implicating RA in the generation of sequence-dependent phonological differences.
One key finding—that sequence-dependent differences in RA activity for a given convergent or divergent syllable are smaller than differences in RA activity during the production of unrelated syllables (Fig. 12)—is in agreement with a previous finding obtained in the zebra finch. Leonardo and Fee (2005) measured correlations between ensemble neural activity at different times across a song motif. They found that when the same syllable was produced in different sequences, neural activity was highly correlated, but when different syllables were produced, the mean neural correlation was close to zero. This previous study emphasized the similarity (i.e., high correlation) of neural activity when the same syllable is produced in different sequences. In contrast, the present study demonstrates that, although neural activity is indeed more similar when the same syllable is produced in different sequences than when different syllables are produced, sequence-dependent differences in neural activity encoding individual syllables are widespread.
Our results suggest that RA might influence the sequencing of upcoming song syllables. Because sequence-dependent differences in RA activity precede the divergence of the syllable sequence, such differences might bias the transition probability at the divergent syllable in addition to affecting its phonology. Put another way, our data reveal that RA activity differs during the production of divergent syllable AB versus AC. Because the difference in RA activity precedes the transition to syllable B or C, the difference in RA activity might influence (via ascending projections) (Fig. 8, dashed lines) whether the song transitions to B or C, consistent with results demonstrating that stimulation of RA and its brainstem targets can influence syllable sequence (Ashmore et al., 2005).
Potential involvement of the AFP
Inputs to HVC originating from motor and premotor structures would also allow signals related to both sequence and phonology to propagate into the AFP (Fig. 8). Inactivation of lateral magnocellular nucleus of the anterior neostriatum (lMAN) (the output of the AFP) in juvenile zebra finches affects both sequence and phonology, perhaps by interfering with the interaction between these levels of control (Olveczky et al., 2005). However, lMAN lesions in adult Bengalese finches affect syllable phonology but not sequencing (Hampton et al., 2009), suggesting that the involvement of the AFP in coordinating sequence and phonology might vary across development or species.
Implications for the neural control of vocal behavior
Our results demonstrate that neural signals related to both the sequence and phonology of birdsong are present at the level of RA, complementing previous analysis showing that trial-by-trial variations in RA activity may drive trial-by-trial variations in the phonology of song syllables (Sober et al., 2008). Together with anatomical and stimulation studies suggesting that RA and its downstream targets can influence syllable sequence via projections to the forebrain (Vates et al., 1997; Reinke and Wild, 1998; Striedter and Vu, 1998; Ashmore et al., 2005, 2008; Roberts et al., 2008), these data support a model in which both sequence and phonology are controlled by interactions between descending and ascending circuits, rather than by individual nuclei dedicated to the control of sequence or phonology alone.
Footnotes
This work was supported by a Helen Hay Whitney postdoctoral fellowship (S.J.S.) and by a National Institute on Deafness and Other Communication Disorders R01 award, a National Institute of Mental Health Conte Center for Neuroscience Research award, and a McKnight Foundation Scholars award (M.S.B.). We also thank Allison Doupe and Loren Frank for helpful comments on this manuscript.
References
- Amerman JD, Daniloff R, Moll KL. Lip and jaw coarticulation for the phoneme (ae) J Speech Hear Res. 1970;13:147–161. doi: 10.1044/jshr.1301.147. [DOI] [PubMed] [Google Scholar]
- Ashmore RC, Wild JM, Schmidt MF. Brainstem and forebrain contributions to the generation of learned motor behaviors for song. J Neurosci. 2005;25:8543–8554. doi: 10.1523/JNEUROSCI.1668-05.2005. [DOI] [PMC free article] [PubMed] [Google Scholar]
- Ashmore RC, Renk JA, Schmidt MF. Bottom-up activation of the vocal motor forebrain by the respiratory brainstem. J Neurosci. 2008;28:2613–2623. doi: 10.1523/JNEUROSCI.4547-07.2008. [DOI] [PMC free article] [PubMed] [Google Scholar]
- Brainard MS, Doupe AJ. Postlearning consolidation of birdsong: stabilizing effects of age and anterior forebrain lesions. J Neurosci. 2001;21:2501–2517. doi: 10.1523/JNEUROSCI.21-07-02501.2001. [DOI] [PMC free article] [PubMed] [Google Scholar]
- Cooper BG, Goller F. Physiological insights into the social-context-dependent changes in the rhythm of the song motor program. J Neurophysiol. 2006;95:3798–3809. doi: 10.1152/jn.01123.2005. [DOI] [PubMed] [Google Scholar]
- Daniloff R, Hammarberg RE. On defining coarticulation. J Phon. 1973;1:239–248. [Google Scholar]
- Daniloff R, Moll K. Coarticulation of lip rounding. J Speech Hear Res. 1968;11:707–721. doi: 10.1044/jshr.1104.707. [DOI] [PubMed] [Google Scholar]
- Doupe AJ, Solis MM. Song- and order-selective neurons develop in the songbird anterior forebrain during vocal learning. J Neurobiol. 1997;33:694–709. [PubMed] [Google Scholar]
- Fee MS, Kozhevnikov AA, Hahnloser RH. Neural mechanisms of vocal sequence generation in the songbird. Ann N Y Acad Sci. 2004;1016:153–170. doi: 10.1196/annals.1298.022. [DOI] [PubMed] [Google Scholar]
- Glaze CM, Troyer TW. Temporal structure in zebra finch song: implications for motor coding. J Neurosci. 2006;26:991–1005. doi: 10.1523/JNEUROSCI.3387-05.2006. [DOI] [PMC free article] [PubMed] [Google Scholar]
- Good P. Permutation tests. Ed 2. New York: Springer; 2000. [Google Scholar]
- Good PI. Resampling methods: a practical guide to data analysis. Ed 3. Boston: Birkhäuser; 2006. [Google Scholar]
- Hahnloser RH, Kozhevnikov AA, Fee MS. An ultra-sparse code underlies the generation of neural sequences in a songbird. Nature. 2002;419:65–70. doi: 10.1038/nature00974. [DOI] [PubMed] [Google Scholar]
- Hampton CM, Sakata JT, Brainard MS. An avian basal ganglia-forebrain circuit contributes differentially to syllable versus sequence variability of adult Bengalese finch song. J Neurophysiol. 2009;101:3235–3245. doi: 10.1152/jn.91089.2008. [DOI] [PMC free article] [PubMed] [Google Scholar]
- Hessler NA, Doupe AJ. Social context modulates singing-related neural activity in the songbird forebrain. Nat Neurosci. 1999;2:209–211. doi: 10.1038/6306. [DOI] [PubMed] [Google Scholar]
- Jarvis ED, Scharff C, Grossman MR, Ramos JA, Nottebohm F. For whom the bird sings: context-dependent gene expression. Neuron. 1998;21:775–788. doi: 10.1016/s0896-6273(00)80594-2. [DOI] [PubMed] [Google Scholar]
- Kao MH, Wright BD, Doupe AJ. Neurons in a forebrain nucleus required for vocal plasticity rapidly switch between precise firing and variable bursting depending on social context. J Neurosci. 2008;28:13232–13247. doi: 10.1523/JNEUROSCI.2250-08.2008. [DOI] [PMC free article] [PubMed] [Google Scholar]
- Leonardo A, Fee MS. Ensemble coding of vocal control in birdsong. J Neurosci. 2005;25:652–661. doi: 10.1523/JNEUROSCI.3036-04.2005. [DOI] [PMC free article] [PubMed] [Google Scholar]
- Margoliash D. Preference for autogenous song by auditory neurons in a song system nucleus of the white-crowned sparrow. J Neurosci. 1986;6:1643–1661. doi: 10.1523/JNEUROSCI.06-06-01643.1986. [DOI] [PMC free article] [PubMed] [Google Scholar]
- Mooney R, Hoese W, Nowicki S. Auditory representation of the vocal repertoire in a songbird with multiple song types. Proc Natl Acad Sci U S A. 2001;98:12778–12783. doi: 10.1073/pnas.221453298. [DOI] [PMC free article] [PubMed] [Google Scholar]
- Ohman SE. Coarticulation in VCV utterances: spectrographic measurements. J Acoust Soc Am. 1966;39:151–168. doi: 10.1121/1.1909864. [DOI] [PubMed] [Google Scholar]
- Okanoya K. The Bengalese finch: a window on the behavioral neurobiology of birdsong syntax. Ann N Y Acad Sci. 2004;1016:724–735. doi: 10.1196/annals.1298.026. [DOI] [PubMed] [Google Scholar]
- Olveczky BP, Andalman AS, Fee MS. Vocal experimentation in the juvenile songbird requires a basal ganglia circuit. PLoS Biol. 2005;3:e153. doi: 10.1371/journal.pbio.0030153. [DOI] [PMC free article] [PubMed] [Google Scholar]
- Ostry DJ, Gribble PL, Gracco VL. Coarticulation of jaw movements in speech production: is context sensitivity in speech kinematics centrally planned? J Neurosci. 1996;16:1570–1579. doi: 10.1523/JNEUROSCI.16-04-01570.1996. [DOI] [PMC free article] [PubMed] [Google Scholar]
- Recasens D. Vowel-to-vowel coarticulation in Catalan VCV sequences. J Acoust Soc Am. 1984;76:1624–1635. doi: 10.1121/1.391609. [DOI] [PubMed] [Google Scholar]
- Reinke H, Wild JM. Identification and connections of inspiratory premotor neurons in songbirds and budgerigar. J Comp Neurol. 1998;391:147–163. [PubMed] [Google Scholar]
- Roberts TF, Klein ME, Kubke MF, Wild JM, Mooney R. Telencephalic neurons monosynaptically link brainstem and forebrain premotor networks necessary for song. J Neurosci. 2008;28:3479–3489. doi: 10.1523/JNEUROSCI.0177-08.2008. [DOI] [PMC free article] [PubMed] [Google Scholar]
- Sakata JT, Brainard MS. Real-time contributions of auditory feedback to avian vocal motor control. J Neurosci. 2006;26:9619–9628. doi: 10.1523/JNEUROSCI.2027-06.2006. [DOI] [PMC free article] [PubMed] [Google Scholar]
- Sakata JT, Brainard MS. Online contributions of auditory feedback to neural activity in avian song control circuitry. J Neurosci. 2008;28:11378–11390. doi: 10.1523/JNEUROSCI.3254-08.2008. [DOI] [PMC free article] [PubMed] [Google Scholar]
- Sakata JT, Hampton CM, Brainard MS. Social modulation of sequence and syllable variability in adult birdsong. J Neurophysiol. 2008;99:1700–1711. doi: 10.1152/jn.01296.2007. [DOI] [PubMed] [Google Scholar]
- Sasaki A, Sotnikova TD, Gainetdinov RR, Jarvis ED. Social context-dependent singing-regulated dopamine. J Neurosci. 2006;26:9010–9014. doi: 10.1523/JNEUROSCI.1335-06.2006. [DOI] [PMC free article] [PubMed] [Google Scholar]
- Scharff C, Nottebohm F. A comparative study of the behavioral deficits following lesions of various parts of the zebra finch song system: implications for vocal learning. J Neurosci. 1991;11:2896–2913. doi: 10.1523/JNEUROSCI.11-09-02896.1991. [DOI] [PMC free article] [PubMed] [Google Scholar]
- Sober SJ, Wohlgemuth MJ, Brainard MS. Central contributions to acoustic variation in birdsong. J Neurosci. 2008;28:10370–10379. doi: 10.1523/JNEUROSCI.2448-08.2008. [DOI] [PMC free article] [PubMed] [Google Scholar]
- Sossinka R, Bohner J. Song types in the zebra finch Poephila guttata castanotis. Z Tierpsychol. 1980;53:123–132. [Google Scholar]
- Spiro JE, Dalva MB, Mooney R. Long-range inhibition within the zebra finch song nucleus RA can coordinate the firing of multiple projection neurons. J Neurophysiol. 1999;81:3007–3020. doi: 10.1152/jn.1999.81.6.3007. [DOI] [PubMed] [Google Scholar]
- Striedter GF, Vu ET. Bilateral feedback projections to the forebrain in the premotor network for singing in zebra finches. J Neurobiol. 1998;34:27–40. [PubMed] [Google Scholar]
- Tchernichovski O, Mitra PP, Lints T, Nottebohm F. Dynamics of the vocal imitation process: how a zebra finch learns its song. Science. 2001;291:2564–2569. doi: 10.1126/science.1058522. [DOI] [PubMed] [Google Scholar]
- Vates GE, Vicario DS, Nottebohm F. Reafferent thalamo-“cortical” loops in the song system of oscine songbirds. J Comp Neurol. 1997;380:275–290. [PubMed] [Google Scholar]
- Vu ET, Mazurek ME, Kuo YC. Identification of a forebrain motor programming network for the learned song of zebra finches. J Neurosci. 1994;14:6924–6934. doi: 10.1523/JNEUROSCI.14-11-06924.1994. [DOI] [PMC free article] [PubMed] [Google Scholar]
- Yu AC, Margoliash D. Temporal hierarchical control of singing in birds. Science. 1996;273:1871–1875. doi: 10.1126/science.273.5283.1871. [DOI] [PubMed] [Google Scholar]