

Abstract
Preclinical development of therapeutic agents against cancer could greatly benefit from noninvasive markers of tumor killing. Potentially, the intracellular partial pressure of oxygen (pO2) can be used as an early marker of anti-tumor efficacy. Here, the feasibility of measuring intracellular pO2 of CNS glioma cells in vivo using 19F magnetic resonance techniques is examined. Rat 9L glioma cells were labeled with perfluoro-15-crown-5-ether (PCE) ex vivo and then implanted into the rat striatum. 19F MRI was used to visualize tumor location in vivo. The mean 19F T1 of the implanted cells was measured using localized, single-voxel spectroscopy. The intracellular pO2 in tumor cells was determined from an in vitro calibration curve. The basal pO2 of 9L cells (day 3) was determined to be 45.3±5 mm Hg (n=6). Rats were then treated with a 1× LD10 dose of bischloroethylnitrosourea (BCNU) intravenously, and changes in intracellular pO2 were monitored. The pO2 increased significantly (p=0.042, paired T-test) to 141.8±3 mm Hg within 18 hours after BCNU treatment (day 4) and remained elevated (165±24 mm Hg) for at least 72 hours (day 6). Intracellular localization of the PCE emulsion in 9L cells before and after BCNU treatment was confirmed by histological examination and fluorescence microscopy. Overall, non-invasive 19F magnetic resonance techniques may provide a valuable preclinical tool for monitoring therapeutic response against CNS or other deep-seated tumors.
Keywords: glioma, fluorine, perfluorocarbon, oxygenation, MRI
INTRODUCTION
Tumor oxygenation has strong prognostic significance in the outcome of chemotherapy and radiotherapy (1). Hypoxia renders tumors resistant to treatments, while pre- or post-treatment hyperoxia is associated with improved survival rate (2). Thus, methods to non-invasively measure partial pressure of oxygen (pO2) in tumors may have enormous potential for evaluating the efficacy of cancer therapeutics (1).
The most widely used technique to measure tumor pO2 is the polarographic oxygen electrode method (1,3). Electrode measurements are invasive and several penetrations are required to sample the tumor volume; furthermore this technique is not suitable for deep-seated tumors, for example in the central nervous system (CNS). Electron paramagnetic resonance (EPR) (4), immunohistochemistry of nitroimidazole binding (5–7), and in situ hybridization of hypoxia inducible factor alpha (HIF-α) (8) are other methods used for tissue oximetry. With the exception of EPR, these techniques are not suitable for in vivo, longitudinal studies. EPR, using implanted probe microcrystals containing unpaired electron spins, have been used as tissue probes to measure tumor oxygenation (4,9,10).
In vivo MR techniques using perfluorocarbon-based probes and 19F detection is a sensitive approach to map pO2 in deep tissues and tumors (11–18). The molecule perfluoro-15-crown-5 ether (PCE), with twenty fluorine atoms having an equivalent chemical shift, is a molecule that is well suited for 19F MRS and MRI. Generally, PCE is formulated as an emulsion for in vivo use. In common with other perfluorocarbons, PCE is known to associate paramagnetic oxygen, thereby decreasing the 19F T1 and T2 (11, 18, 19). Normally T1 is used to measure pO2, as it exhibits a larger response to O2 concentration. The 19F relaxation rates of PCE exhibit a strong linear dependence with local oxygen levels in proximity to emulsion droplets. Tissue oxygenation in vivo can be calculated using an in vitro calibration curve correlating relaxation rates with pO2. In fact, Mason et al. (21) demonstrated the validity of calibration curves obtained in solutions for pO2 mapping in tissues.
In prior tumor studies, the PCE emulsion is generally introduced intravenously, or injected directly intratumoral (11,13,14,16,18). Following systemic administration, PCE particles are often found in tumor tissues within several days post-administration. The PCE emulsion droplets are sequestered predominantly in the periphery of the tumors because of the leakage in the tumor vasculature (14,16), or phagocytosed by tumor-associated macrophage (11,13). Thus, pO2 was sensed from tumor stroma, tumor cells, or inflammatory cells surrounding the tumor. Generally, in the above routes of administration PCE emulsion deposits are distributed non-uniformly in the tumors, and direct injection of PCE into the tumor can disrupt tumor architecture.
Recently, studies have demonstrated in vivo cell tracking using 19F MRI via ex vivo cell labeling with perfluorocarbon (22–25). The key feature of this approach is that the 19F images are extremely selective for the labeled cells (22), with no background signal from the host’s tissues. Ex vivo labeling of specific cell populations of interest by simple co-incubation with the perfluorocarbon emulsion ensures consistent intracellular 19F dose and cell specificity. Importantly, a body of data has shown that intracellular perfluorocarbon emulsion does not affect cell phenotype and function (22–26). To date, MRI visualization of transplanted perfluorocarbon labeled cells has been demonstrated in vivo in several recent studies using dendritic cells (22,23), T cells (25) and stem cells (24,26).
Building on these results, we hypothesize that T1 measurements of intracellular PCE can be used as a local pO2 probe to detect real-time, in vivo changes in oxygen metabolism in an ex vivo selected cell type. Ex vivo labeling of tumor cells ensures cell specificity and an initial uniformity in labeling throughout the tumor volume. Potentially, intracellular pO2 measurements of tumor cells may reflect the tumor growth and response to treatment more accurately than extracellular or interstitial measurements of tumor pO2.
In this paper, we imaged PCE-labeled 9L cells implanted in the rat striatum. The 9L cells form aggressive brain tumors in F-344 and Wistar strain rats (27,28), and these tumors are often non-hypoxic and are highly radiosensitive (9,29,30). Following inoculation of labeled 9L cells into the rat striatum, we visualized the tumor cells using in vivo 19F MRI. Next, using single voxel 19F MRS, we measured the mean T1 of the tumor implant and used this value to determine the pO2. We then demonstrated that PCE can be used as an intracellular probe to monitor the changes in pO2 before and after treatment with bischloroethylnitrosourea (BCNU) in 9L tumors. BCNU is an alkylating agent that crosses the blood-brain-barrier (BBB) and is widely used for the treatment of gliosarcoma. Using 19F MRS we observed that a single BCNU dose was sufficient to dramatically increase tumor oxygenation. At the experimental endpoint, histology was used to confirm that the PCE was retained intracellularly in 9L cells. Our data show that intracellular oxygen sensing is feasible, and may be a valuable preclinical tool for monitoring therapeutic effects or developmental changes in tumor and other cell types.
METHODS
9L cells
9L glioma cells (ATCC, Manassas, VA) were cultured in Dulbecco’s modified Eagle’s media (DMEM) supplemented with 10% fetal bovine serum (FBS) and 1% penicillin and streptomycin (PS) under standard conditions (i.e., 37 °C and 5% CO2). Alternatively, 9L glioma were used that constitutively express green fluorescent protein (GFP); these GFP-expressing 9L cells were established by transfecting a plasmid, pL-EGFP-IRES-Neo, using Lipofectamine (Invitrogen, Inc., Carlsbad, CA). The pL-EGFP-IRES-Neo plasmid contains a gene cassette consisting of an enhanced GFP (EGFP), internal ribosome entry site (IRES) and neomycin resistant gene (NeoR); the whole cassette was driven by the retroviral LTR promoter. After a 48 h transfection, cells were treated with trypsin and GFP expressing cells were sorted by fluorescent assisted cell sorting (FACS) using the FACSVantage SE cell sorter (Becton Dickinson, Franklin Lakes, NJ). The sorted cells were then cultured in medium supplemented with 1 µg/ml of G418 (Geneticin®, an analog of neomycin, Invitrogen) for at least 14 days to establish a stable mixed-population of GFP-expressing 9L cells.
PCE labeling
The PCE emulsion was prepared using neat PCE oil obtained from Exfluor, Inc. (Round, TX) using previously published methods (23,25). Alternate ‘dual-mode’ PCE formulations were made containing trace amounts of a conjugate of linear perfluoropolyether and BODIPy-TR fluorescent dye, as reported elsewhere (23). For PCE labeling, 9L cells, ~90% confluent in a 10 cm culture dish, were co-incubated with 7.5 mg/ml of PCE emulsion in serum-free media using similar materials and methods described previously (22,23). Negligible cell toxicity was observed after the labeling as seen by trypan exclusion and Cell Titer Glo (Promega, Madison, WI) assays. After 4 h of incubation at 37 °C, the cells were washed three times in Hank’s balanced salt solution (HBSS) prior to inoculation into the brain.
NMR of cell pellets
A portion of the labeled cells were assayed for 19F content by NMR; 1×10⁶ cells were pelleted in an NMR tube and 200 µl of 2% trifluoroacetic acid (TFA) was added as a calibrated 19F standard. NMR spectroscopy of the cell pellets was performed at 470 MHz using a Bruker spectrometer (Bruker Biospin, Billerica, MA) with a delay time of 8 s and 32 averages. Two distinct peaks were observed at −76 ppm for TFA and −91.6 ppm for the PCE. The peaks were integrated separately and were used to calculate the mean 19F content per cell, as described elsewhere (23,25).
PCE and pO2 in vitro calibration
A calibration curve was constructed displaying the empirical relationship between 19F R1=1/T1 and pO2 for the PCE emulsion. Standards with four concentrations of O2 (0%, 25%, 80% and 100%) were produced by bubbling the appropriate O2/N2 gas mixture into an aliquot of the PCE emulsions in an NMR tube for thirty minutes. The tubes were then sealed with a gas-tight stopper and epoxy resin. The T1 of each standard was measured at 37 °C and 280 MHz using a Bruker AVANCE AV3, 7.0 T/20 cm, horizontal-bore imaging system (Bruker, Billerica, MA) using a saturation-recovery PRESS sequence. The relaxation recoveries were fit to a single exponential. A calibration curve was produced by linear least square fit relating R1 to pO2.
Fixed cell confocal microscopy
Intracellular localization of the emulsion was confirmed using the GFP expressing 9L line (above). Cells were labeled using the PCE-BODIPy emulsion. Following the same labeling procedure as above, cells were then plated in 8-well microscopy chambers (Corning Inc., Corning, NY) at a density of 10,000–30,000 cells per well. After an ~18 h incubation in chambers, cells were fixed with 2% paraformaldehyde (PFA) for 10 minutes, and washed again with phosphate buffered saline (PBS). Cell nuclei were stained using 1 µg/ml of Hoechst 3342 dye (Sigma, St. Louis, MO) for 10 minutes at room temperature, followed by a wash step in PBS. Multi-spectral confocal microscopy was performed on the fixed cells using a Zeiss 510 LSM UV Duoscan instrument (Carl Zeiss, Thornwood, NY).
9L glioma rat model
Experiments were carried out in accordance with the guidelines provided by the Carnegie Mellon Institutional Animal Care and Use Committee (IACUC) and the National Institute of Health Guide for the Care and Use of Laboratory Animals. Female Fisher 344 rats (n=6), 6 weeks of age, were sourced from Jackson laboratories (Bar Harbor, ME). Rats were anesthetized with a cocktail of Ketamine (Sigma, Inc., St. Louis, MO) (40–95 mg/kg) and Xylazine (Lloyd, Inc., Shenandoah, IA) (5–20 mg/kg). Using a stereotaxic instrument, two holes were drilled in the skull 0.7 mm anterior and 3 mm lateral to either side of the bregma using a surgical drill leaving the dura intact. 2×10⁶ labeled 9L cells, suspended in 20 µl PBS, were injected into the brain at a depth of 4.6 mm below the dura using a 28 gauge syringe. PCE labeled cells were injected to the right striatum, and unlabeled cells were injected into the contralateral side as a negative control. BCNU (Sigma, St. Louis, MO)(13.3 mg/kg body weight or 1× LD10 dose) (31,32) in 10% ethanol was administered intra-jugular after the first MRI session. Animal weight, general health, and food habits were monitored regularly after brain injection and BCNU treatment. Rats serving as controls (n=3) did not receive BCNU after the first imaging session.
MRI
Brain imaging was performed using a Bruker 7.0 T imaging system. A birdcage volume resonator was used that could be tuned to either 19F or 1H. The rats were anesthetized with 2% isoflurane in 70% O2 and 30% N2O. Animal temperature was maintained at 37 °C during the course of the experiments. Arterial blood oxygen was monitored using an ABL 80 FLEX blood analyzer (Radiometer, Westlake, OH) on serial blood draws, and arterial pO2 was maintained between 290 and 310 mm Hg during the imaging session. High resolution 1H images were obtained using a standard spin echo sequence (TR/TE = 1000/15 ms, matrix size = 512×256, FOV = 4×4 cm, slice thickness = 3 mm). 19F images were obtained using the rapid acquisition with relaxation enhancement (RARE) sequence (RARE factor = 8, TR/TE = 1500/10 ms, matrix size = 64×32, FOV = 4×4 cm, slice thickness = 3 mm). The 19F images were rendered in pseudo-color and superimposed onto the 1H image. The 19F T1 measurements were performed by point resolved spectroscopy (PRESS) with a single voxel (7×10×10 mm) encompassing the entire tumor. The PRESS sequence was used over conventional T1 MRI mapping to accelerate data acquisition and for measurement simplicity for these small tumors. Localized voxel placement ensured that no 19F was detected from fluorine-containing structural components of the RF coil. T1 was calculated by saturation recovery method, and the integrated area of the spectrum at different TR values was fitted by a three parameter single exponential equation using the Levenberg-Marquardt algorithm. The T1 fit quality, R2, was >0.97. The T1's at a given time point from each cohort were averaged together, and the standard error was calculated. The pO2 was calculated from these average T1 values using the in vitro calibration curve. The time-dependent 19F clearance within the in vivo images was estimated by integrating the total 19F signal in all slices at given time point. This 19F signal was normalized to the SNR of the 1H images acquired in the same scanning session in an ROI encompassing the striatum to account for any small changes in imaging sensitivity from scan-to-scan.
Histology and microscopy
Rats were perfused transcardially, first with PBS to remove blood, followed by 4% PFA in PBS. The intact brain tissue was dissected from the skull and stored in 4% PFA overnight. The fixed brain was paraffin embedded and sliced into 10 µm sections encompassing the tumor injection site. Alternate sections were stained with hematoxylin and eosin (H&E) and imaged using an Olympus AX 70 (Olympus, Center Valley, PA). Rats inoculated with 9L cells expressing GFP and labeled with PCE-BODIPy emulsion were decapitated, the brains were removed, flash frozen in OCT compound (QIAGEN, Valencia, CA), and stored in −80 °C until sectioning. Brains were cut into 10 µm sections using a cryotome and mounted on a glass slides. The slides were washed with PBS to remove excess of OCT compound and fixed in 2% PFA for 20 minutes. The mounted sections were observed under the microscope for the expression and co-localization of GFP with PCE-BODIPy using a Zeiss 510 LSM UV Duoscan microscope.
RESULTS
Characterization of PCE emulsion uptake
To confirm intracellular localization of the PCE emulsion into 9L glioma cells, labeled cells were imaged using confocal microscopy. The confocal microscopy samples were prepared using 9L glioma cells expressing GFP, and the PCE labeling emulsion was formulated to incorporate BODIPY-TR dye. Figure 1a shows a labeled cell undergoing mitosis with two separated nuclei, and GFP is expressed diffusely throughout the cytoplasm; the PCE droplets are present as punctate deposits within the cell consistent with a vesicular localization. Labeled cells generally contain a large number of PCE emulsion droplets, on the order of 104 droplets, distributed intracellularly, thus with each division daughter cells will receive approximately equal amounts of PCE droplets. Indeed, Figure 1 shows that the daughter cells both retain PCE. Internalization of PCE emulsion did not affect the cell proliferation in vitro (data not shown). For our in vivo experiments, the average fluorine content per cell determined by NMR spectroscopy was approximately 2×10¹¹ 19F/cell; a typical cell pellet NMR spectrum is shown in Figure 1b.
Fig. 1.

In vitro characterization of 9L cell labeling. (a) Confocal microscopy (left panel) of 9L cells expressing GFP and labeled with PCE-BODIPy emulsion. Internalized PCE-BODIPy appears as punctate (red) deposits consistent with vesicular localization within cytoplasm (green). Nuclei (blue) are stained by Hoechst 3342. The right panel shows a white light image of the same 9L cell. (b) 19F NMR is used to quantify PCE uptake by 9L cell pellets. Shown is the PCE peak (−92 ppm) from a cell pellet and the TFA peak (−76 ppm) that is used as an absolute 19F reference for quantification. From this spectrum the average uptake of PCE is calculated to be ~2×10¹¹ 19F/cell.
In vivo MRI and MRS
In vivo MRI was performed on day 3 after implanting 9L cells labeled with PCE emulsion. Figure 2a shows a typical composite 19F/1H image, where the 19F is rendered in pseudo-color and overlaid onto the 1H image. Typical 1H coronal images reveal the presence of solid tumors in both the right (PCE labeled) and left (unlabeled) injection sites in the striatum. In Figure 2a, the 19F image shows a single ‘pool’ of signal in the right hemisphere co-localizing with the tumor site. Figure 2b shows a typical in vivo 19F MRS spectrum from the 9L cells. The SNR of the spectrum is 4.5.
Fig. 2.
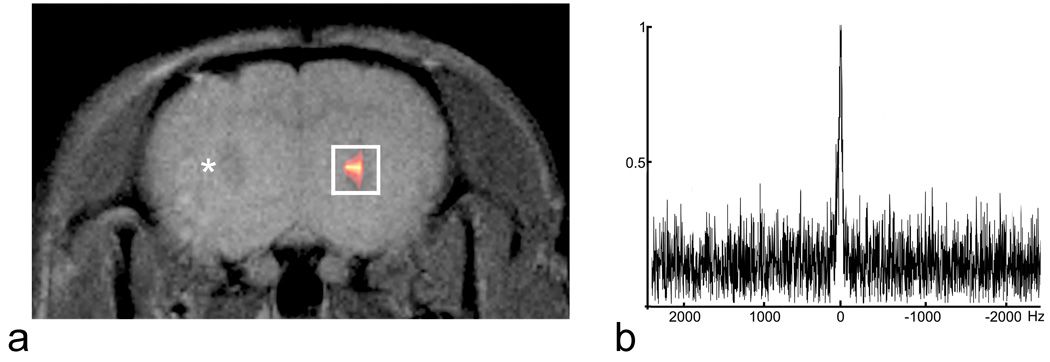
In vivo 19F MRI and MRS of 9L glioma in rat brain. (a) A composite 19F/1H image of the labeled 9L glioma cells stereotaxically injected into the right striatum three days prior. The 19F is rendered in a hot-iron intensity scale and the 1H is grayscale. Control, unlabeled 9L cells were injected into the contralateral striatum in the same imaging plane; a small tumor is visible to the right of the asterisk. The white rectangular box encompassing the 19F signal represents the approximate voxel placement for MRS. Panel (b) shows a typical in vivo 19F spectrum obtained from the a single voxel using the PRESS MRS sequence.
The effective intracellular pO2 was determined by measuring the 19F T1 and comparing the results to a calibration curve, obtained from in vitro standards of the PCE emulsion held at various oxygen tensions. Figure 3 shows the calibration curve measured at 7 T and 37 °C. Using a linear least-square analysis, we obtained the empirical relationship between R1=1/T1 and pO2 given by
| (1) |
where R1 and pO2 have units of s−1 and mm Hg, respectively, and the standard error for the slope and intercept is 5.6×10⁻⁵ and 0.024, respectively.
Fig. 3.

Calibration curve for R1 versus pO2 at 7 T and 37 °C. The curve was derived from 19F R1 measurements of four different concentrations of O2 in a saturated O2/N2 mixture of PFC emulsion in water. A linear least square analysis yields a slope of 0.0036, intercept of 0.542 and R2=0.99. Here, 100% oxygen is equivalent to 760 mm Hg.
Figure 4a shows a typical T1 recovery for a rat on day 3 (pre-treatment, solid circles). The average T1 on day 3 post-implantation was T1=1.4±0.2 s (n=6) indicating pO2=45.3±5 mm Hg at day 3 using Eq. 1.. Immediately following T1 measurements, rats were administered BCNU i.v. (13.3 mg/kg, 1× LD10 dose). The entire cohort was imaged again 18 hours later (day 4), and a significant reduction of T1= 0.95±0.1 s (n=6) was observed, where Figure 4a (open squares) shows a typical T1 recovery. Using Eq. 1, this corresponds to a significant increase in the tumor oxygenation from 45.3±5 to 141.8±3 mm Hg (Fig. 4b, p = 0.042, paired T test). The T1 measurements 6 hours after BCNU treatment were not significantly different (1.4±0.2 s).
Fig. 4.

Intracellular pO2 and BCNU treatment. (a) Typical T1 recoveries on day 3 (solid circles) and after BCNU treatment (day 4, open squares). T1 becomes significantly reduced 18 hours following BCNU treatment (day 4). The two recovery curves were normalized to the signal at the initial time point. (b) Summarizes the initial pO2 changes after BCNU treatment. Data is an average of n=6 rats and shows a significant effect due to BCNU (asterisk, p = 0.042, paired T test).
Figure 5 shows the longitudinal time course of tumor pO2 values. In the control group receiving no BCNU (n=3), the measured pO2 showed a gradual decline (Fig. 5). The tumor oxygenation remained elevated (165±24 mm Hg) in the BCNU treated rats compared to the control group (13.4±5 mm Hg) for at least 72 hours after treatment (day 6). In BCNU treated tumors, 19F signal intensity was 88±9% on day 4, and 67±15% on day 6 compared to the signal intensity on day 3 (100%); for control tumors, 19F signal intensity was 82±9% on day 4 and 56±3% on day 6.
Fig. 5.

Longitudinal pO2 changes after BCNU treatment. Post-BCNU, the pO2 increase persists for at least 72 hours (day 6). In controls, pO2 gradually decreased from day 3 to day 6 (closed circles).
Histology and fluorescent microscopy of CNS tissue
Following the imaging sessions on day 6, rats were sacrificed and brain sections were prepared and stained with H&E. The staining revealed circumscribed tumor tissue in the brain with polyploidal nuclei and neutrophil infiltration. BCNU treatment resulted in loss of tumor cell mass in the periphery of the tumors (Figure 6a) compared to the controls.
Fig. 6.

Histology and fluorescent microscopy of 9L glioma in rat brain. (a) H&E staining of glioma shows reduced cell density in the periphery of the tumor after BCNU treatment (day 4) compared to control, where upper and lower panels are at 200× and 400× magnification, respectively. (b) Fluorescent microscopy of brain tissue before and after BCNU treatment (day 4) confirms the intracellular localization of PCE emulsion, where GFP expressing 9L cells (green) and PCE-BODIPy (red) co-localize (630× magnification).
In order to confirm that the PCE emulsion droplets remained intracellular with and without BCNU treatment, we injected GFP expressing 9L cells labeled with dual-mode PCE-BODIPy emulsion into the rat brain. The 9L cells in the periphery of the tumor were analyzed by fluorescent microscopy to examine the distribution of PCE-BODIPy deposits. We observed co-localization of the GFP expressing 9L cells and PCE-BODIPy emulsion before and after BCNU treatment (Figure 6b). The data suggests that the PCE remains intracellular pre- and post-treatment and that PCE from apoptotic cells is cleared from the tumor region by undetermined mechanisms.
DISCUSSION
In this study, we demonstrated the feasibility of in vivo 19F magnetic resonance to non-invasively measure intracellular pO2 in 9L glioma. Our novel approach utilized ex vivo intracellular cell labeling with an in situ pO2 sensor comprised of a non-toxic perfluorocarbon-based emulsion. Labeled tumor cells were then implanted and longitudinally followed using 19F MRI to detect cell localization, and 19F T1 measurements were used to determine the intracellular pO2. Following a BCNU injection i.v., we showed that the in situ pO2 can provide an early indicator of the transport of the therapeutic into the CNS and its anti-tumor efficacy, as supported by the peripheral cell loss seen in the H&E histological staining. Fluorescence microscopy was used to confirm that the PCE droplets remained intracellular in viable cells.
In the previous work using 19F magnetic resonance for pO2 measurements, PCE was directly injected into the tumor tissues, or a large dose was injected systemically resulting in a small amount of PCE delivered to the tumor tissues. Generally, after systemic introduction of PCE emulsion, the reagent localizes in the periphery of the tumor tissue; it remains unresolved as to whether this is due to sequestration in the stroma (14,16), or whether the PCE droplets are taken up by phagocytic immune cells (e.g., macrophage) surrounding the tumor (11,13). Direct injection of PCE in tumor tissues is invasive and may potentially cause trauma, disturb tumor architecture, and will often result in an inhomogenous distribution.
The CNS offers unique challenges when attempting to deliver imaging probes due to the impermeability of the intact BBB. In one set of experiments we attempted to in situ label the CNS 9L glioma using an i.v. bolus of PCE emulsion in our model. However, no 19F signal could be observed at the tumor site or elsewhere in the brain.
Our approach sidesteps the probe delivery issue by directly labeling the tumor cells ex vivo before implantation into the brain. Ex vivo labeling of tumor cells provides an initial uniform distribution of the probe within all the cells. In our pO2 measurements we used a single-voxel MRS technique that effectively determines the average value over the entire tumor volume, but cannot detect pO2 heterogeneity. This is reasonable in the 9L model because small, early tumors have a relatively homogenous mass and do not have a necrotic center until approximately two weeks post-implantation (28). An alternative to MRS for larger tumors would be to acquire a spatial pO2 map from voxel-wise T1 measurements using 19F MRI; several techniques are known in the art for rapidly generating pO2 maps (33,34).
We observed that BCNU treatment increases the intracellular pO2 in 9L cells significantly compared to untreated controls. Previous work has shown that the increase in oxygenation after BCNU treatment is due to an increase in tumor perfusion and metabolism after treatment (35). Hou et al. (9) using EPR and LiPc microcrystalline probes injected directly into the brain report that that the basal pO2 in F-344 rat brain parenchyma ranges from 64.4±8.4 mm Hg to 95.7±12.9 mm Hg while breathing 100% oxygen. The same study reports that the pO2 in implanted 9L tumors in the brain ranged from 97.3±8.9 to 112.7±9.0 mm Hg, which is higher than our measured values (45.3±5 mm Hg at day 3), and treatment with the drug efaproxiral elevated the pO2 to values ranging from 148.0±14.8 to 197.7±15 mm Hg. We note that these microcrystalline ESR probes cannot be administered systemically due to their large size (100–200 µm). 19F relaxation rates of hexafluorobenzene (HFB) have been used previously to monitor changes in pO2 following treatment with combretastatin A4 phosphate in a rat breast cancer model. In this study, HFB was directly injected into the tumor tissue, and a decrease in pO2 following treatment was observed (20).
In studies by Duong et al. (12), cerebral parenchyma pO2 was measured by 19F T1 measurements following an intra-cerebroventricular infusion of PCE emulsion. Cerebral pO2 increased linearly from 40 to 100 mm Hg as arterial pO2 increased from 90 to 300 mm Hg (12). Brain tissue pO2 (12) and tumor pO2 (33) are directly proportional to the percentage of oxygen inhaled. Cerebral pO2 can be also influenced by the type of anesthesia used; inhalation anesthetic results in higher tissue pO2 compared to injected anesthetics (36). Arterial pO2 and route of anesthesia may partly explain the variability in base brain tumor oxygenation levels observed by different groups (9,37). In our experiments we used 2% isoflurane mixed with 30% N2O and 70% oxygen, and the arterial pO2 was maintained between 290–310 mm Hg. Temperature is the only other factor that alter PCE T1 considerably, however, in our experiments we carefully regulated the temperature to 37 °C at all times.
In our study, changes in pO2 of control tumors during growth can be compared to previous studies (14,17) of tumor oximetry using sequestered Oxypherol emulsion following systemic administration. We observed that as tumor size increased pO2 decreased from 62.6±8 mm Hg (day 3) to 26.6±5 (day 4) and 13.5±3 (day 6). Baldwin et al. (17) in a KHT tumor model showed that pO2 decreased from 60 to ~0 mm Hg as the tumor mass increased from 0.2 to 1.8 g. In a Dunning prostate R3327-AT1 tumor model, Mason et al. (14) demonstrated that as the tumor doubled in size, the core pO2 changed from 75 to 1 mm Hg.
Biochemical techniques, such as pimonidazole immunohistochemistry, are widely used for hypoxia mapping in tumor tissues. Pimonidazole typically detects only hypoxic regions with tissue pO2 less than 10 mm Hg (7). In our study, the average baseline tumor pO2 was 45.3±5 mm Hg. Nonetheless, we attempted to find hypoxic fractions in tumor with pimonidazole immunohistochemistry but were unsuccessful. This results may be due to the small tumor size (< 1 cm) (33), and/or the absence of hypoxic regions in the 9L gliomas (9,29,30).
Several characteristics of perfluorocarbon emulsions make them useful as intracellular MRI agents. The carbon-fluorine bond is highly stable chemically. There are no known enzymes that degrade perfluorocarbons in vivo, and they do not degrade at typical lysosomal pH values (38). The 19F NMR line shape and chemical shift of perfluorocarbon is not altered within cells, implying that the compound is not metabolized (22). Most perfluorocarbons are both lipophobic and hydrophobic and do not incorporate into cell membranes (38). Overall, we have never observed any long term cellular toxicity or changes in proliferation, phenotype or function associated with intracellular labeling with perfluorocarbon emulsions. The results of a large number of in vitro tests on various cell types are described elsewhere (22,23,25,39). There is no evidence for active exocytosis of the PCE agents (22). Clearance of PFC agents from the body occurs ultimately via the reticuloendothelial system and the lungs (40).
The detection of perfluorocarbon labeled cells using 19F MRI (or MRS) is fundamentally different from prior art using paramagnetic MRI contrast agents, such as superparamagnetic ironoxide (SPIO) nanoparticles or Gd-based agents. In the case of the metal ion-based agents, one detects the presence of the paramagnetic agent indirectly via its effect on T1, T2, and/or T2* of surrounding protons in mobile water. Mobile water exists in tissues at high concentrations, generally ~50 M. In contrast, the perfluorocarbon acts like a ‘tracer’ agent that is generally dilute compared to 1H. Thus, the signal-to-noise-ratio (SNR) of the 19F images will be significantly lower than what is commonly observed for 1H MRI. Paramount, however, is that one does not demand a high 19F SNR. Because there is negligible 19F background, any 19F signal detected is from labeled cells. Unlike 1H anatomical imaging, where one relies on its high SNR and contrast-to-noise ratio (CNR) to resolve detailed anatomy and organ definition, the 19F image only needs to detect localized pools of cells at arbitrarily low SNR; and the 1H overlay provides the detailed anatomical context. The average number of 19F nuclei per cell is calibrated as part of the tissue culture protocol development (25), and is generally observed to be on the order of 1011–1012 19F/cell. Overall, the practical cell detection sensitivity is of order 104 to 105 cells per voxel for clinical MRI systems (22) and 103–104 for high field animal scanners, such as used in this study (25). Single-voxel MRS detection is expected to yield even higher sensitivity to sparse cell numbers.
CONCLUSIONS
In this paper we have demonstrated the feasibility of in vivo intracellular pO2 measurement of ex vivo labeled glioma cells. We showed that cellular oximetry can be used to monitor the efficacy of chemotherapy in CNS glioma. The technique may be useful, for example, for non-invasively evaluating real-time pharmokinetics of anti-tumoral therapeutics. These methods potentially could be applied to other cell types, where redox reactions play important roles in cell function. For example, it may be possible to monitor the degree of inflammation or immune cell activation based on intracellular their oxygen consumption.
ACKNOWLEDGEMENTS
We thank Hongyan Xu for technical assistance. Also, we thank Drs. Kevin Hitchens and Paul Kornblith for helpful discussion. This work was supported by the National Institutes of Health (R01-CA134633, R01-EB003453, P01-HD047675, P41-EB001977).
REFERENCES
- 1.Tatum JL, Kelloff GJ, Gillies RJ, Arbeit JM, Brown JM, Chao KS, Chapman JD, Eckelman WC, Fyles AW, Giaccia AJ, Hill RP, Koch CJ, Krishna MC, Krohn KA, Lewis JS, Mason RP, Melillo G, Padhani AR, Powis G, Rajendran JG, Reba R, Robinson SP, Semenza GL, Swartz HM, Vaupel P, Yang D, Croft B, Hoffman J, Liu G, Stone H, Sullivan D. Hypoxia: importance in tumor biology, noninvasive measurement by imaging, and value of its measurement in the management of cancer therapy. Int J Radiat Biol. 2006;82:699–757. doi: 10.1080/09553000601002324. [DOI] [PubMed] [Google Scholar]
- 2.Brizel DM, Dodge RK, Clough RW, Dewhirst MW. Oxygenation of head and neck cancer: changes during radiotherapy and impact on treatment outcome. Radiother Oncol. 1999;53:113–117. doi: 10.1016/s0167-8140(99)00102-4. [DOI] [PubMed] [Google Scholar]
- 3.Lyng H, Sundfor K, Rofstad EK. Oxygen tension in human tumours measured with polarographic needle electrodes and its relationship to vascular density, necrosis and hypoxia. Radiother Oncol. 1997;44:163–169. doi: 10.1016/s0167-8140(97)01920-8. [DOI] [PubMed] [Google Scholar]
- 4.Bratasz A, Pandian RP, Deng Y, Petryakov S, Grecula JC, Gupta N, Kuppusamy P. In vivo imaging of changes in tumor oxygenation during growth and after treatment. Magn Reson Med. 2007;57:950–959. doi: 10.1002/mrm.21212. [DOI] [PMC free article] [PubMed] [Google Scholar]
- 5.Hutchison GJ, Valentine HR, Loncaster JA, Davidson SE, Hunter RD, Roberts SA, Harris AL, Stratford IJ, Price PM, West CM. Hypoxia-inducible factor 1alpha expression as an intrinsic marker of hypoxia: correlation with tumor oxygen, pimonidazole measurements, and outcome in locally advanced carcinoma of the cervix. Clin Cancer Res. 2004;10:8405–8412. doi: 10.1158/1078-0432.CCR-03-0135. [DOI] [PubMed] [Google Scholar]
- 6.Janssen HL, Haustermans KM, Sprong D, Blommestijn G, Hofland I, Hoebers FJ, Blijweert E, Raleigh JA, Semenza GL, Varia MA, Balm AJ, van Velthuysen ML, Delaere P, Sciot R, Begg AC. HIF-1A, pimonidazole, and iododeoxyuridine to estimate hypoxia and perfusion in human head-and-neck tumors. Int J Radiat Oncol Biol Phys. 2002;54:1537–1549. doi: 10.1016/s0360-3016(02)03935-4. [DOI] [PubMed] [Google Scholar]
- 7.Raleigh JA, Chou SC, Arteel GE, Horsman MR. Comparisons among pimonidazole binding, oxygen electrode measurements, and radiation response in C3H mouse tumors. Radiat Res. 1999;151:580–589. [PubMed] [Google Scholar]
- 8.Bos R, van der Groep P, Greijer AE, Shvarts A, Meijer S, Pinedo HM, Semenza GL, van Diest PJ, van der Wall E. Levels of hypoxia-inducible factor-1alpha independently predict prognosis in patients with lymph node negative breast carcinoma. Cancer. 2003;97:1573–1581. doi: 10.1002/cncr.11246. [DOI] [PubMed] [Google Scholar]
- 9.Hou H, Khan N, O'Hara JA, Grinberg OY, Dunn JF, Abajian MA, Wilmot CM, Demidenko E, Lu S, Steffen RP, Swartz HM. Increased oxygenation of intracranial tumors by efaproxyn (efaproxiral), an allosteric hemoglobin modifier: in vivo EPR oximetry study. Int J Radiat Oncol Biol Phys. 2005;61:1503–1509. doi: 10.1016/j.ijrobp.2004.12.077. [DOI] [PubMed] [Google Scholar]
- 10.Halpern HJ, Yu C, Peric M, Barth ED, Karczmar GS, River JN, Grdina DJ, Teicher BA. Measurement of differences in pO2 in response to perfluorocarbon/carbogen in FSa and NFSa murine fibrosarcomas with low-frequency electron paramagnetic resonance oximetry. Radiat Res. 1996;145:610–618. [PubMed] [Google Scholar]
- 11.Dardzinski BJ, Sotak CH. Rapid tissue oxygen tension mapping using 19F inversion-recovery echo- planar imaging of perfluoro-15-crown-5-ether. Magn Reson Med. 1994;32:88–97. doi: 10.1002/mrm.1910320112. [DOI] [PubMed] [Google Scholar]
- 12.Duong TQ, Iadecola C, Kim SG. Effect of hyperoxia, hypercapnia, and hypoxia on cerebral interstitial oxygen tension and cerebral blood flow. Magn Reson Med. 2001;45:61–70. doi: 10.1002/1522-2594(200101)45:1<61::aid-mrm1010>3.0.co;2-8. [DOI] [PubMed] [Google Scholar]
- 13.Hees PS, Sotak CH. Assessment of changes in murine tumor oxygenation in response to nicotinamide using 19F NMR relaxometry of a perfluorocarbon emulsion. Magn Reson Med. 1993;29:303–310. doi: 10.1002/mrm.1910290305. [DOI] [PubMed] [Google Scholar]
- 14.Mason RP, Antich PP, Babcock EE, Constantinescu A, Peschke P, Hahn EW. Non-invasive determination of tumor oxygen tension and local variation with growth. Int J Radiat Oncol Biol Phys. 1994;29:95–103. doi: 10.1016/0360-3016(94)90231-3. [DOI] [PubMed] [Google Scholar]
- 15.Noth U, Morrissey SP, Deichmann R, Adolf H, Schwarzbauer C, Lutz J, Haase A. In vivo measurement of partial oxygen pressure in large vessels and in the reticuloendothelial system using fast 19F-MRI. Magn Reson Med. 1995;34:738–745. doi: 10.1002/mrm.1910340513. [DOI] [PubMed] [Google Scholar]
- 16.van der Sanden BP, Heerschap A, Simonetti AW, Rijken PF, Peters HP, Stuben G, van der Kogel AJ. Characterization and validation of noninvasive oxygen tension measurements in human glioma xenografts by 19F-MR relaxometry. Int J Radiat Oncol Biol Phys. 1999;44:649–658. doi: 10.1016/s0360-3016(98)00555-0. [DOI] [PubMed] [Google Scholar]
- 17.Baldwin NJ, Ng TC. Oxygenation and metabolic status of KHT tumors as measured simultaneously by 19F magnetic resonance imaging and 31P magnetic resonance spectroscopy. Magn Reson Imaging. 1996;14:541–551. doi: 10.1016/0730-725x(96)00049-5. [DOI] [PubMed] [Google Scholar]
- 18.Zhao D, Jiang L, Mason RP. Measuring changes in tumor oxygenation. Methods Enzymol. 2004;386:378–418. doi: 10.1016/S0076-6879(04)86018-X. [DOI] [PubMed] [Google Scholar]
- 19.Guo Q, Mattrey RF, Guclu C, Buxton RB, Nalcioglu O. Monitoring of pO2by spin-spin relaxation rate 1/T2 of 19F in a rabbit abscess model. Artif Cells Blood Substit Immobil Biotechnol. 1994;22:1449–1454. doi: 10.3109/10731199409138849. [DOI] [PubMed] [Google Scholar]
- 20.Zhao D, Jiang L, Hahn EW, Mason RP. Tumor physiological response to Combretastatin A4 phosphate assessed by MRI. Int J Radiat Oncol Biol Phys. 2005;62:872–880. doi: 10.1016/j.ijrobp.2005.03.009. [DOI] [PubMed] [Google Scholar]
- 21.Mason RP, Shukla H, Antich PP. In vivo oxygen tension and temperature: simultaneous determination using 19F NMR spectroscopy of perfluorocarbon. Magn Reson Med. 1993;29:296–302. doi: 10.1002/mrm.1910290304. [DOI] [PubMed] [Google Scholar]
- 22.Ahrens ET, Flores R, Xu HY, Morel PA. In vivo imaging platform for tracking immunotherapeutic cells. Nat Biotechnol. 2005;23:983–987. doi: 10.1038/nbt1121. [DOI] [PubMed] [Google Scholar]
- 23.Janjic JM, Srinivas M, Kadayakkara DKK, Ahrens ET. Self-delivering nanoemulsions for dual fluorine-19 MRI and fluorescence detection. J Am Chem Soc. 2008;130:2832–2841. doi: 10.1021/ja077388j. [DOI] [PubMed] [Google Scholar]
- 24.Partlow KC, Chen J, Brant JA, Neubauer AM, Meyerrose TE, Creer MH, Nolta JA, Caruthers SD, Lanza GM, Wickline SA. 19F magnetic resonance imaging for stem/progenitor cell tracking with multiple unique perfluorocarbon nanobeacons. Faseb J. 2007;21:1647–1654. doi: 10.1096/fj.06-6505com. [DOI] [PubMed] [Google Scholar]
- 25.Srinivas M, Morel PA, Ernst LA, Laidlaw DH, Ahrens ET. Fluorine-19 MRI for visualization and quantification of cell migration in a diabetes model. Magn Reson Med. 2007;58:725–734. doi: 10.1002/mrm.21352. [DOI] [PubMed] [Google Scholar]
- 26.Ruiz-Cabello J, Walczak P, Kedziorek DA, Chacko VP, Schmieder AH, Wickline SA, Lanza GM, Bulte JW. In vivo "hot spot" MR imaging of neural stem cells using fluorinated nanoparticles. Magn Reson Med. 2008;60:1506–1511. doi: 10.1002/mrm.21783. [DOI] [PMC free article] [PubMed] [Google Scholar]
- 27.Barth RF. Rat brain tumor models in experimental neuro-oncology: The 9L, C6, T9, F98, RG2 (D74), RT-2 and CNS-1 gliomas. J. Neurooncol. 1998;36:91–102. doi: 10.1023/a:1005805203044. [DOI] [PubMed] [Google Scholar]
- 28.Stojiljkovic M, Piperski V, Dacevic M, Rakic L, Ruzdijic S, Kanazir S. Characterization of 9L glioma model of the Wistar rat. J Neurooncol. 2003;63:1–7. doi: 10.1023/a:1023732619651. [DOI] [PubMed] [Google Scholar]
- 29.Franko AJ, Koch CJ, Boisvert DP. Distribution of misonidazole adducts in 9L gliosarcoma tumors and spheroids: implications for oxygen distribution. Cancer Res. 1992;52:3831–3837. [PubMed] [Google Scholar]
- 30.Wheeler KT, Wallen CA, Wolf KL, Siemann DW. Hypoxic cells and in situ chemopotentiation of the nitrosoureas by misonidazole. Br J Cancer. 1984;49:787–793. doi: 10.1038/bjc.1984.122. [DOI] [PMC free article] [PubMed] [Google Scholar]
- 31.Bullard DE, Bigner SH, Bigner DD. Comparison of intravenous versus intracarotid therapy with 1,3-bis(2-chloroethyl)-1-nitrosourea in a rat brain tumor model. Cancer Res. 1985;45:5240–5245. [PubMed] [Google Scholar]
- 32.Ross BD, Zhao YJ, Neal ER, Stegman LD, Ercolani M, Ben-Yoseph O, Chenevert TL. Contributions of cell kill and posttreatment tumor growth rates to the repopulation of intracerebral 9L tumors after chemotherapy: an MRI study. Proc Nat Acad Sci USA. 1998;95:7012–7017. doi: 10.1073/pnas.95.12.7012. [DOI] [PMC free article] [PubMed] [Google Scholar]
- 33.Hunjan S, Zhao D, Constantinescu A, Hahn EW, Antich PP, Mason RP. Tumor oximetry: demonstration of an enhanced dynamic mapping procedure using fluorine-19 echo planar magnetic resonance imaging in the Dunning prostate R3327-AT1 rat tumor. Int J Radiat Oncol Biol Phys. 2001;49:1097–1108. doi: 10.1016/s0360-3016(00)01460-7. [DOI] [PubMed] [Google Scholar]
- 34.Jordan BF, Cron GO, Gallez B. Rapid monitoring of oxygenation by 19F magnetic resonance imaging: Simultaneous comparison with fluorescence quenching. Magn Reson Med. 2009;61:634–638. doi: 10.1002/mrm.21594. [DOI] [PubMed] [Google Scholar]
- 35.Steen RG, Graham MM. 31P magnetic resonance spectroscopy is sensitive to tumor hypoxia: perfusion and oxygenation of rat 9L gliosarcoma after treatment with BCNU. Nmr Biomed. 1991;4:117–124. doi: 10.1002/nbm.1940040302. [DOI] [PubMed] [Google Scholar]
- 36.Hou H, Grinberg OY, Taie S, Leichtweis S, Miyake M, Grinberg S, Xie H, Csete M, Swartz HM. Electron paramagnetic resonance assessment of brain tissue oxygen tension in anesthetized rats. Anesth Analg. 2003;96:1467–1472. doi: 10.1213/01.ANE.0000055648.41152.63. [DOI] [PubMed] [Google Scholar]
- 37.Dunn JF, O'Hara JA, Zaim-Wadghiri Y, Lei H, Meyerand ME, Grinberg OY, Hou H, Hoopes PJ, Demidenko E, Swartz HM. Changes in oxygenation of intracranial tumors with carbogen: a BOLD MRI and EPR oximetry study. J Magn Reson Imaging. 2002;16:511–521. doi: 10.1002/jmri.10192. [DOI] [PubMed] [Google Scholar]
- 38.Krafft MP, Chittofrati A, Riess JG. Emulsions and microemulsions with a fluorocarbon phase. Curr Opin Colloid Interface Sci. 2003;8:251–258. [Google Scholar]
- 39.Janjic JM, Ahrens ET. Fluorine-containing nanoemulsions for MRI cell tracking. Nanomed Nanobiotechnol. 2009;1:492–501. doi: 10.1002/wnan.35. [DOI] [PMC free article] [PubMed] [Google Scholar]
- 40.Castro O, Nesbitt AE, Lyles D. Effect of a perfluorocarbon emulsion (Fluosol-Da) on reticuloendothelial system clearance function. Am J Hematol. 1984;16:15–21. doi: 10.1002/ajh.2830160103. [DOI] [PubMed] [Google Scholar]