

Abstract
Binding can now be quantified in live cells, but the accuracy of such measurements remains uncertain. To address this uncertainty, we compare fluorescence recovery after photobleaching (FRAP) and fluorescence correlation spectroscopy (FCS) measurements of the binding kinetics of a transcription factor, the glucocorticoid receptor, in the nuclei of live cells. We find that the binding residence time measured by FRAP is 15 times longer than that obtained by FCS. We show that this discrepancy is not likely due to the significant differences in concentrations typically used for FRAP and FCS, nor is it likely due to spatial heterogeneity of the nucleus, improper calibration of the FCS focal volume, or the intentional FRAP photobleach. Instead, our data indicate that photobleaching of bound molecules in FCS is mainly responsible. When this effect is minimized, FRAP and FCS measurements nearly agree, although cross-validation by other approaches is now required to rule out mutual errors. Our results demonstrate the necessity of a photobleach correction for FCS measurements of GFP-tagged molecules that are bound for >0.25 s, and represent an important step forward in establishing a gold standard for in vivo binding measurements.
Introduction
Measurements of biologically relevant molecular binding interactions have traditionally been done in vitro, but with recent breakthroughs in green fluorescent protein (GFP) technology and fluorescence microscopy, in vivo measurements have become routine. Of the techniques used to quantify in vivo binding, fluorescence recovery after photobleaching (FRAP) (1–3) is perhaps the most widespread. As its popularity continues to increase, however, discrepancies in the FRAP literature are beginning to accumulate (4,5). For example, FRAP measurements of in vivo transcription factor dynamics have differed by roughly four orders of magnitude, with binding-time estimates ranging from milliseconds to tens of seconds (6–9). Are these discrepancies biological in origin, or do they reflect technical errors in the FRAP procedures?
This question can be addressed by cross-validation. We recently compared several different FRAP procedures and showed that large differences in published transcription factor binding times were solely due to errors in FRAP modeling (10). However, to rule out common errors in FRAP, cross-validation by other techniques is also required.
Fluorescence correlation spectroscopy (FCS), like FRAP, was developed to measure diffusion and binding (11); however, most FCS studies have measured multicomponent diffusion, with the slowest component sometimes interpreted as binding (12–17). This gives the bound fraction, but the actual residence time cannot be estimated in this way. Fluorescence cross correlation spectroscopy (FCCS) can similarly quantify bound fractions (18), but again the residence time is difficult to extract and, moreover, the application to molecules that bind chromatin is not clear since the method requires that chromatin be fluorescently labeled at sites that are not known a priori. Although some studies have compared some of the predictions of FRAP, FCS (19–21), and single-molecule tracking (SMT) (22,23), no explicit comparison of binding residence times has been made.
To enable such a comparison, we recently derived analogous solutions for FRAP and FCS that describe molecular diffusion and binding to relatively immobile substrates such as chromatin (24). Using these solutions, we measured the in vivo binding kinetics of a GFP-tagged transcription factor fragment, VBP-B-ZIP, and showed that both FRAP and FCS yielded the same bound fraction and diffusion coefficient for the protein. However, because the binding kinetics were too fast for FRAP to distinguish from diffusion, the binding residence time could only be measured directly with FCS. Thus, although the two techniques at least partially agree, it remains unclear whether they completely agree, since the binding residence time—arguably the most important parameter—could not be cross-validated.
Here we confronted this issue by focusing on a slower DNA-binding transcription factor, the glucocorticoid receptor (GR). Unlike VBP-B-ZIP, GR binding times can be measured separately from diffusion with the use of FRAP (10). This allowed us to directly compare FRAP and FCS estimates of in vivo binding times for the first time, to our knowledge. This comparison uncovered a significant discrepancy that our data now suggest is primarily due to photobleaching of bound molecules in FCS.
Materials and Methods
Cells
We performed FRAP and FCS experiments on GFP-GR using mouse adenocarcinoma cell line 3617, in which the stable expression of GFP-GR is regulated by a tet-off system, as previously described (25). Tetracyline was removed from the medium and cells were examined by FCS 4–8 h later (dim cells) and by temporal image correlation spectroscopy (TICS) and FRAP 12–24 h later (bright cells ∼3× brighter than dim cells). FCS experiments on VBP-B-ZIP were performed in NIH-3T3 cells transiently transfected with VBP-B-ZIP-GFP plasmids, as previously described (24). All experiments were performed in fluorescently homogeneous regions of cells centered within the imaging frame. See the Supporting Material for details.
FRAP
FRAP was performed on a Zeiss LSM 5 LIVE DuoScan confocal microscope (63×/1.4 NA oil objective, 488 nm/100 mW diode laser, acousto-optic tunable filter (AOTF) 6%, pinhole 2.5 Airy units = 2.0 μm slice) in DuoScan mode (20% imaging/80% bleaching). A total of 100 prebleach images (300 × 160 pix2 = 31 × 17 μm2) were acquired, followed by a single 16 ms circular photobleach (AOTF 100%, diameter 2.5 μm). The data were background-subtracted and observational photobleaching was corrected for by normalizing the postbleach nuclear fluorescence to the first postbleach value. The spatial fluorescence intensity profiles of the FRAP recovery were calculated by radial averaging in concentric rings within the photobleach spot, and the resultant data were fit to a reaction-diffusion model (26). See the Supporting Material for model details.
FCS
Two-photon (2P)-FCS experiments were performed on a custom-built system as previously described (24). One-photon (1P)-FCS experiments were performed on a Zeiss LSM510-ConfoCor2 combination system (40×/1.2 NA water objective, 488 nm/45 mW laser, AOTF 20%). 2P-FCS laser power was set between 8–12 mW just before the objective. 1P-FCS laser power was adjusted with a second AOTF set between 0.2–5%. These values were chosen to avoid excitation saturation effects and maximize the signal/noise ratio while minimizing detectable photobleaching. FCS data were acquired for 10–30 s, repeated five times per location. Data were rejected if they showed artifacts due to cell mobility (large intensity variations). The remaining data were averaged and fit with a reaction-diffusion model (24). This was repeated at two to three locations per nucleus, and at least six averaged curves were analyzed per sample. See the Supporting Material for calibration/model details.
TICS
TICS is a variant of FCS in which temporal correlations are computed and averaged from multiple pixels in an image sequence rather than from a single diffraction-limited spot (27). TICS experiments were performed on a Zeiss LSM 5 LIVE DuoScan confocal microscope using the same conditions as for FRAP, except the pinhole was set to 1 Airy unit (0.94 μm) and the laser power was adjusted by changing the AOTF from 6% to 12%. A line with arbitrary length and single pixel width (210 nm) was imaged repeatedly at 1000–5000 Hz for ∼100 s. This was repeated on at least five cells per laser power on at least 2 days. Intensity data from each pixel were analyzed separately (see Fig. S1). Observational photobleaching was corrected for by dividing out a double-exponential fit to produce data that fluctuate about a constant mean. Data were rejected if they showed artifacts due to cell mobility (large intensity variations) and/or aberrant photobleaching (not described by a double-exponential). The temporal autocorrelation of corrected data from each pixel was calculated and randomly binned into sets of 10 for averaging and fitting with a reaction-diffusion model. See the Supporting Material for calibration/model details.
Results
FRAP and FCS estimates of GR binding residence time differ by an order of magnitude
To directly compare FRAP and FCS binding measurements, we used both techniques to quantify the diffusive and binding dynamics of GFP-GR stably expressed in mouse adenocarcinoma cells (25). We used a new spatiotemporal FRAP method that we recently developed (26), which generates radial intensity profiles of the bleach spot as a function of time. This method provides for more stringent fitting, since a radial profile rather than a single point (the average intensity) is fit at each time point. The new spatio-temporal FRAP yielded estimates for the diffusion coefficient D = 3.4 ± 1.0 μm2/s, bound fraction B = 0.31 ± 0.15 and binding residence time tr = 2.7 ± 0.73 s consistent with our earlier work using average intensity fits (10) (Fig. 1, A and C). Note that the bound fraction B and binding residence time tr are closely related to the binding association and dissociation rates that we reported earlier ( and , respectively). Here we report fits using B and tr because these parameters are biologically more meaningful.
Figure 1.
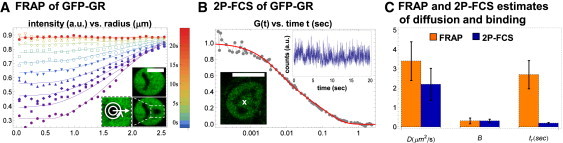
Order-of-magnitude discrepancy between FRAP and 2P-FCS. (A) FRAP was performed in cells stably expressing GFP-GR. The bleach spot profile in postbleach frames was determined by radial averaging in concentric rings centered on the bleach spot (inset, white bar = 10 μm). Spatial profiles at select times are shown (color-coded according to the legend) along with a fit (solid lines) to a reaction-diffusion model that yielded a diffusion coefficient D = 3.26 μm2/s, bound fraction B = 0.39, and binding residence time tr = 2.6 s. (B) 2P-FCS was performed in the same cells as FRAP (lower inset, white bar = 10 μm). Compared with FRAP, the expression of GFP-GR was reduced to enhance the relative size of fluctuations. Photon counts in the 2P excitation volume (white x) fluctuate about a constant mean throughout the measurement (upper inset, rebinned for illustration purposes), indicating no apparent photobleaching. The temporal autocorrelation G(t) of these data (joined gray points) was averaged with that of analogous data to produce the displayed curve. A fit (solid red line) to the same reaction-diffusion model used for FRAP yielded D = 2.46 μm2/s, B = 0.30, and tr = 0.16 s. (C) A comparison between the FRAP and 2P-FCS estimates. Although estimates of B and tr agree, estimates of tr differ by ∼15×.
We then performed an analogous 2P-FCS measurement to independently estimate D, B, and tr for GFP-GR (Fig. 1 B). Using the same binding model as for FRAP, we obtained FCS estimates for the diffusion constant (2.2 ± 0.83 μm2/s) and bound fraction (0.31 ± 0.09) that agreed with the FRAP estimates, but the FCS residence time estimate (0.19 ± 0.04 s) was an order of magnitude shorter than the FRAP estimate (2.7 ± 0.73 s; Fig. 1 C). This discrepancy is not due to poor sensitivity of either procedure, as predicted curves for both FRAP and FCS are noticeably shifted by order-of-magnitude changes in residence times (Fig. S2).
One possible explanation for the discrepancy is an instrumental error in either our FRAP or FCS setup. This seems unlikely, however, since both our FRAP and FCS data are consistent with the literature. Specifically, our FRAP diffusion and binding estimates for another transcription factor, p53 (10), whose dynamics we find to be indistinguishable from GR, agree with estimates from another group (7). Likewise, our FCS data are consistent with data from a previous study on GFP-GR in which the GFP-GR FCS data were fit with a two-component diffusion model, yielding Dfast = 8.7 ± 0.08 μm2/s and Dslow = 0.25 ± 0.09 μm2/s (16). We prefer a reaction-diffusion model for fitting GFP-GR data because GR is a known DNA-binding protein and Dslow would correspond to an implausibly large molecular complex (∼14 GD based on the measured diffusion constant of unconjugated GFP). Nevertheless, when we fit our FCS data to the same two-component diffusion model used in the previous study, we obtained very similar estimates (Dfast = 5.9 ± 1.7 μm2/s, Dslow = 0.36 ± 0.06 μm2/s; Fig. S3). This demonstrates that the two studies are in reasonable agreement.
Thus it appears that the discrepancy between FRAP and FCS is not an instrumental artifact. We evaluate other possible explanations below.
Fluorescence concentration differences between FRAP and FCS
As is commonly done, we acquired our FRAP measurements in relatively bright cells to obtain a good signal/noise ratio, and performed the FCS measurements in cells that were on average threefold dimmer to produce large fluctuations for the autocorrelation function. Because the GFP-GR concentration was higher in FRAP, we would expect more GR-binding sites to be occupied under these conditions. The additional sites would presumably be of lower affinity, leading to a shorter average residence time under the FRAP experimental conditions. As reported above, however, we observed the opposite, namely, a longer residence time from FRAP, potentially discounting this explanation.
To more directly test concentration effects, we repeated the FRAP and FCS measurements of GFP-GR, but now under reverse concentration conditions. This produced new FRAP estimates in dimmer cells and new FCS estimates in brighter cells that were statistically indistinguishable from the original estimates (Fig. 2). We conclude that the difference in the GFP-GR concentrations originally used for the FRAP and FCS measurements is not likely responsible for the large discrepancy in estimated GFP-GR residence times.
Figure 2.
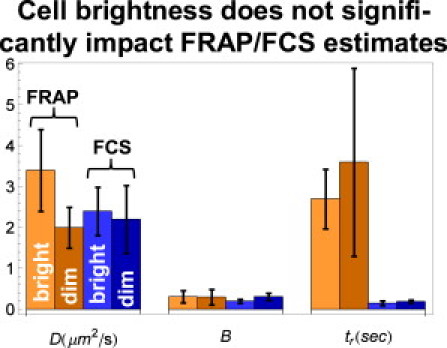
Evaluating the impact of GFP-GR expression levels on FRAP/FCS. When FRAP was repeated in dim cells prepared in the same way as for 2P-FCS, estimates of the diffusion coefficient D, bound fraction B, and binding residence times tr remained statistically unchanged compared to FRAP in bright cells (lighter left two bars in each set of four). Likewise, when 2P-FCS was repeated in bright cells prepared in the same way as for FRAP, estimates of D, B, and tr also remained statistically unchanged compared to 2P-FCS in dim cells (darker right two bars in each set of four). This suggests that the discrepancy between FRAP and 2P-FCS estimates of tr is independent of GFP-GR expression levels.
Spatial heterogeneity: global versus local measurements
FRAP involves a much larger measurement zone than FCS. The volume of our FRAP bleach zone was ∼30 μm3, whereas the volume of our FCS focal spot was ∼0.6 μm3. Because the heterogeneity of the nucleus may change at different length scales, it is conceivable that a local measurement of binding obtained from FCS could be significantly different from a more global measurement of binding as obtained by FRAP.
Our initial FCS measurements are in fact averages of local measurements over many cells. To see whether there was any substantive variability either from cell to cell or from one region to another region in the same cell, we looked at the variance of our FCS estimates. We found that the variance from region to region in the same cell was not significantly different from the variance from one cell to the next (Fig. 3). These results suggest that for GFP-GR there are no large changes in diffusion and binding behavior that depend on the local environment or the individual cell state at the length scales accessible to FRAP and FCS.
Figure 3.
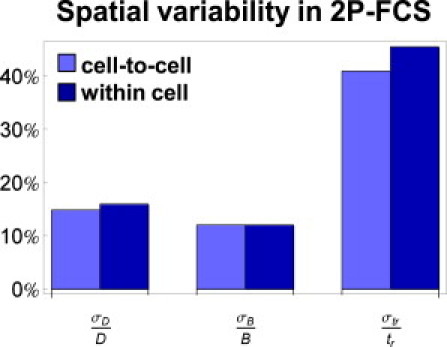
Evaluating the impact of spatial heterogeneity on FRAP/FCS. 2P-FCS was performed at multiple positions in multiple cells stably expressing GFP-GR. The relative variability in the estimates of the diffusion coefficient σD/D, bound fraction σB/B, and binding residence time σtr/tr was the same for sets of FCS experiments performed within a single cell compared to sets performed in separate cells, suggesting that the estimates represent global averages that should be consistent with FRAP.
Calibration of FCS focal volume
Several recent experiments suggested that some of the standard dyes used to calibrate the size of the FCS focal volume may diffuse faster than previously thought (28,29). To see how our estimates depended on the FCS focal volume size, we fit our FCS data using two different focal volume sizes: one based on an older estimate and one based on a newer estimate for the diffusion constant of Alexa 488. We found this had only a very modest effect on the estimates yielding a ∼25% change in the diffusion constant, and virtually no change in the bound fractions and residence times (Fig. S4). Thus, errors in estimation of the FCS focal volume cannot be responsible for the discrepancy in residence times that we observed.
Cryptic photobleaching in 2P-FCS
It has been shown that photobleaching in FCS tends to shorten the measured diffusion time τD (30–33) because molecules that are photobleached while in the focal volume will appear to spend less time there. Such photobleaching can be difficult to detect because it corresponds to a steady state in which bleached molecules in the focal volume are replenished by unbleached molecules from the rest of the nucleus (32). This yields an average intensity in the focal volume that remains constant, and so we refer to the photobleaching that occurs there as “cryptic”. Cryptic photobleaching could therefore yield a shortened binding residence time in FCS relative to FRAP, consistent with our observations.
As a first test for cryptic photobleaching, we performed 2P-FCS on fixed GFP-GR cells using the same imaging conditions employed for live cells. The fixed cells showed a decrease in fluorescence intensity within the first few seconds (Fig. 4 A), suggesting that GFP-GR molecules with a binding residence time on the order of seconds (as the FRAP estimates would suggest) could undergo photobleaching under our imaging conditions.
Figure 4.
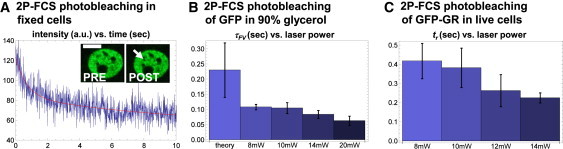
Evidence for cryptic photobleaching in 2P-FCS. (A) To mimic photobleaching of bound molecules in live cells, 2P-FCS experiments were performed under identical conditions in fixed cells. Significant photobleaching (an exponential decay in the FCS intensity) was evident in the first few seconds. The postexperiment image in the inset reveals a newly created bleach spot (white arrow) where the laser was positioned (white bar = 10 μm). (B) 2P-FCS was performed on unconjugated GFP freely diffusing in PBS mixed with 90% glycerol. As the laser power increased from 8 mW to 20 mW, the fitted focal volume residence time τFV decreased and was always less than predicted by theory (see Supporting Material), consistent with photobleaching. (C) 2P-FCS was repeated on GFP-GR in live cells. As the laser power increased from 8 mW to 14 mW, the binding residence time tr decreased, again consistent with photobleaching.
Next, we measured the focal volume residence time τFV of unconjugated GFP in solutions with and without glycerol. Note that τD traditionally measures the time to move laterally across the focal volume, whereas τFV measures the residence time in the three-dimensional (3D) volume. As such, τFV is directly related to the probability of photobleaching (see Supporting Material). In 90% glycerol, our measured τFV for GFP was significantly shorter than expected theoretically (measured τFV = 0.11 ± 0.03 s vs. theoretical τFV = 0.23 ± 0.09 s). Furthermore, our measured τFV decreased further as we increased the laser power (Fig. 4 B). (Since fluorescence saturation would cause the opposite trend, namely an increasing residence time with increasing laser power (34), these experiments suggest that photobleaching is the dominant effect). In contrast, when we measured τFV in glycerol-free phosphate-buffered saline (PBS), where the residence time should be much shorter (theoretical τFV = 0.001 ± 0.0001 s), we saw no difference between the measured and theoretical values at all laser powers tested (Fig. S5). Taken together, these results argue that under our conditions, cryptic photobleaching can occur for molecules with sufficiently long residence times.
Finally, we performed analogous experiments on GFP-GR over a range of laser powers. Fits to our reaction-diffusion model revealed a decreasing binding residence time with increasing laser power, indicating that estimates for GFP-GR binding could be corrupted by cryptic photobleaching (Fig. 4 C). Presumably, one could obtain an accurate estimate for the true binding residence time at laser powers low enough that the binding residence time estimates should eventually stabilize. Unfortunately, we were not able to reach this plateau because laser powers lower than 8 mW yielded autocorrelation functions that were too noisy.
Cryptic photobleaching in 1P-FCS
To assess whether cryptic photobleaching could occur in 1P-FCS, we again measured the diffusion of unconjugated GFP in 90% glycerol. As with 2P-FCS, this yielded estimates for τFV that increased with lower laser powers. However, unlike 2P-FCS, these values eventually plateaued at the lowest laser powers, yielding an estimated value that was within error of the theoretical value (∼0.06 ± 0.02; see Fig. 5 B). These results show that cryptic photobleaching can arise in 1P-FCS (since the average focal volume intensity was constant at the higher laser powers even though the residence time estimates were wrong), but the effect is less severe than in 2P-FCS (since the residence time estimates at the lowest laser powers plateaued at the correct value). When we repeated these 1P measurements with GFP-GR (Fig. 5 A), we were unable to lower the laser power sufficiently to reach a plateau in the estimated residence times (Fig. 5 C). As for 2P-FCS, an inadequate signal/noise ratio was the limiting factor. We conclude that with sufficiently long residence times, cryptic photobleaching can also be a problem for 1P-FCS.
Figure 5.
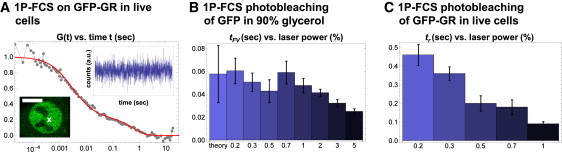
Evidence for cryptic photobleaching in 1P-FCS. (A) 1P-FCS experiments were performed in cells expressing GFP-GR. Photon counts in the 1P excitation volume (white x) fluctuate about a constant mean throughout the measurement (upper inset, data rebinned for illustration purposes), indicating no apparent photobleaching. The temporal autocorrelation G(t) of these data (joined gray points) was averaged with that of analogous data to produce the displayed curve. A fit (smooth solid line) to the same reaction-diffusion model used for FRAP and 2P-FCS yielded D = 3.1 μm2/s, B = 0.23, and tr = 0.63 s. (B) 1P-FCS was performed on unconjugated GFP freely diffusing in PBS mixed with 90% glycerol. Only laser powers that yielded a constant count rate were used (by adjusting the AOTF from 0.2% to 5%), but at higher laser powers τFV was always lower than theory predicted, consistent with cryptic photobleaching. At the lower powers, however, theory and experiment agreed, suggesting that cryptic photobleaching was minimal. (C) 1P-FCS was performed on GFP-GR in live cells. As the laser power increased, the binding residence time tr decreased, again consistent with photobleaching. As with 2P-FCS, a plateau in the estimated binding residence times tr could not be established, due to an insufficient signal/noise ratio at lower laser powers.
Reducing cryptic photobleaching using TICS
As an alternate approach to obtain estimates of GFP-GR residence times, we performed TICS, a form of FCS in which temporal correlations are measured across an entire image rather than at a single pixel (27). Although this produces more global photobleaching than 1P- or 2P-FCS, the photobleaching is less cryptic because it extends across the entire imaged region and thus limits the exchange between bleached and unbleached molecules. Photobleaching can therefore be detected and partially corrected for even at relatively low laser powers.
To acquire TICS data, we used a line-scanning confocal microscope (35). Although TICS generally has reduced temporal resolution compared to standard FCS, we were able to acquire TICS data at sufficient temporal resolution (4000 Hz) to detect GFP-GR dynamics.
We again measured the diffusion times of unconjugated GFP in 90% glycerol. In contrast to the 1P- and 2P-FCS measurements, this produced an obvious loss of fluorescent intensity over time at all laser powers, but with a sufficient signal/noise ratio. As earlier studies have done (36,37), we used the fluorescent decay to correct the acquired intensity data and then fit it with the conventional diffusion model (Fig. S1 shows an example in cells). This produced the expected diffusion time for GFP in the focal volume (Fig. S6), indicating that our TICS implementation together with the photobleaching correction can yield accurate estimates for molecules that reside for longer times in the focal volume.
We then applied TICS with the photobleaching correction to GFP-GR to obtain new estimates for D = 1.7 ± 0.4 μm2/s, B = 0.28 ± 0.12 and tr = 1.3 ± 0.53 s (Fig. 6). Of note, the binding residence time increased by a factor of 7 compared to the original 2P-FCS estimates. In addition, when we changed the laser powers by adjusting the AOTF between 5% and 20%, the estimates remained constant up to 15% laser throughput (Fig. 6 b), at which point the residence times began to shorten. This suggests that at some point, the correction for photobleaching fails in our TICS setup, but the residence time estimates are consistent up to that point.
Figure 6.
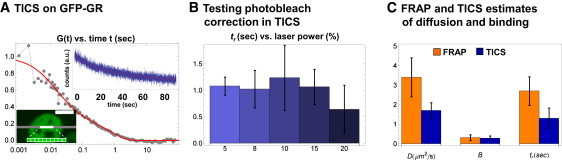
TICS on GFP-GR. (A) TICS experiments were performed in cells expressing GFP-GR. Decaying photon counts (upper inset) in each pixel within the excitation line (centered blown-up region, lower inset) can be corrected with a double-exponential (solid smooth line, upper inset). The calculated autocorrelation G(t) (joined gray points) for GFP-GR is well fit by a reaction-diffusion model (smooth solid line) with diffusion coefficient D = 1.64 μm2/s, bound fraction B = 0.24, and binding residence time tr = 0.85 s. (B) When fits are performed at different laser powers (varied by adjusting the AOTF), estimates of tr remain constant until 15% laser throughput, after which they begin to decrease and the photobleach correction fails. (C) A comparison between the FRAP and TICS estimates shows near agreement for all parameters.
The above observations suggested that 1P- and 2P-FCS significantly underestimated the binding residence time of GFP-GR. To see whether there would still be an effect for shorter binding residence times, we performed TICS on GFP-VBP-B-ZIP, whose binding residence time was estimated at 0.053 ± 0.019 s by 2P-FCS in our previous study (24). Similarly to GFP-GR, TICS produced a binding residence time for VBP-B-ZIP that was five times longer than the original 2P estimate (Fig. S7), suggesting that binding residence times as short as a few tenths of a second can still be affected by photobleaching in standard FCS.
Impact of the intentional photobleach in FRAP
We also investigated another potential problem that could alter our estimates, namely, the high-intensity photobleach used in FRAP. If this photobleach disrupts cellular structure or transiently changes the local temperature or viscosity, it could have an effect on GFP-GR binding. For example, a high-intensity bleach pulse might induce DNA damage (38), leading to altered binding kinetics in a transcription factor such as GFP-GR. Photo-induced unbinding has also been reported (39).
To evaluate the impact of the photobleach, we performed FRAP experiments with different photobleach intensities (100%, 50%, 25%, 15% of laser power). The diffusion and binding estimates obtained from these different FRAP experiments were identical within error (Fig. 7 A). The lack of a trend in these estimates argues that the photobleach does not disrupt the molecular dynamics, although it is possible that all of the intensities tested far surpass the threshold for producing detrimental effects. Unfortunately, lower photobleach intensities cannot be evaluated because smaller bleach depths become difficult to fit.
Figure 7.
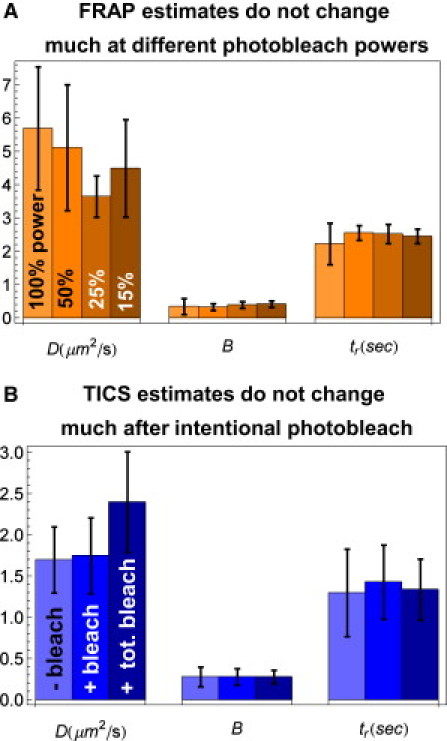
Testing the impact of the intentional FRAP photobleach. (A) When FRAP is performed using different laser powers for the intentional photobleach, estimates of the diffusion coefficient D, bound fraction B, and binding residence time tr do not change significantly. (B) TICS was repeated in regions where cells expressing GFP-GR had been exposed to an intentional photobleach. Two photobleaching strategies were employed. First, the intentional photobleach was localized to a circular region of diameter 2.5 μm using 100% laser power, as in a typical FRAP experiment (+ bleach). TICS was then performed 1 min postbleach to allow for fluorescence equilibration. Second, the intentional photobleach covered the entire cell using 50% laser power (+ total bleach). TICS was then performed 3–5 s postbleach. In both cases, estimates of the diffusion coefficient D, bound fraction B, and binding residence time tr did not change significantly compared to estimates in cells that were not exposed to an intentional photobleach (− bleach).
As an alternate test, we performed TICS at the site of a photobleach after fluorescence had recovered there. The resultant estimates for D, B, and tr for GFP-GR were statistically indistinguishable from comparable TICS estimates obtained without the photobleach (Fig. 7 B). These data argue that the photobleach does not alter the molecular dynamics, at least not beyond the time frame (∼1 min) required for the fluorescence to equilibrate after the photobleach. However, it is possible that the photobleach could induce transient fluctuations in the temperature, viscosity, or reactive oxygen species that might dissipate within the 1 min lag time between the photobleach and the TICS measurement.
To reduce this lag time, we partially photobleached the entire cell using 50% laser power. This obviated the need for an imaging pause to allow for fluorescence equilibration, although in practice the conversion from photobleach to TICS imaging mode required 3–5 s. With this significantly shortened lag time after the photobleach, we were still unable to detect any significant changes in the TICS estimates (Fig. 7 B). Thus, if the photobleach induces transient fluctuations that alter binding, they must dissipate within 3–5 s. More generally, the results from the whole-cell photobleach argue against any local detrimental changes that rapidly diffuse away from the bleach site, since the photobleach will produce equivalent damage across the entire cell.
Discussion
Among the many advances made in the field of fluorescence microscopy, the quantification of molecular binding in live cells has become increasingly common and important. FRAP and FCS have emerged as powerful techniques for this purpose, but the accuracy of measurements obtained with these methods has been difficult to assess. Here, we used both techniques to independently measure the dynamics of the transcription factor GFP-GR and ultimately cross-validate estimates of diffusion and binding times.
We initially found good agreement between FRAP and FCS estimates of GFP-GR diffusion times and bound fractions, but the estimated binding residence times differed by more than an order of magnitude. We then evaluated five different possible causes of this discrepancy, and found that only one of these factors appeared to be responsible. Correcting for this problem using TICS led to a sevenfold increase in the FCS estimated binding residence times, bringing them almost within error of the FRAP estimates. This represents substantial progress toward the goal of achieving a gold standard for in vivo binding measurements, but further cross-validation of these estimates by other approaches is now critical. We discuss these points in detail below.
Concentration, spatial heterogeneity, FCS focal volume calibration, and intentional FRAP photobleach had little impact on the GFP-GR estimates
We found that GFP-GR binding rates were not significantly influenced by the expression levels of the protein, at least over the threefold range tested. We also could not find any evidence that there was significant variability in GFP-GR binding from cell to cell or at different locations in the cell nucleus (although we avoided measurements within nucleoli, which are largely devoid of GFP-GR). In addition, our FCS binding measurements were not very sensitive to adjustments in the calibration of the FCS focal volume. In sum, it seems clear that none of these differences can account for the discrepancy we measured between FRAP and FCS estimates of GFP-GR residence times.
We also obtained some evidence that the intentional photobleach in FRAP was not responsible for the discrepancy in measured residence times. We found that different photobleach intensities did not alter our FRAP estimates, and further that our TICS estimates were not altered by an intentional photobleach, even when that measurement was made within a few seconds of the photobleach. These tests do not exclude the possibility that the photobleach has transient effects that can dissipate over an entire cell within a few seconds of the photobleach. However, the current data suggest that either the intentional FRAP photobleach is innocuous for our system or an additional, as yet unidentified compensating factor in the FRAP or TICS procedures fortuitously produces agreement. Our combined FRAP/TICS assay should prove useful for testing the toxicity of the intentional FRAP photobleach more generally, particularly in cases where cellular damage might be expected to alter binding, such as might occur for DNA repair proteins.
Cryptic photobleaching in FCS led to artifactually shortened GFP-GR residence times
Of the factors that we explicitly evaluated, only cryptic photobleaching (32) showed a significant effect on the estimates. This refers to photobleaching that cannot be seen as a drop in count rate during the FCS measurement interval, but instead must be detected by a decrease in focal volume residence times with increasing laser power.
We found that cryptic photobleaching only appeared with sufficiently long residence times arising from either slow diffusion or long binding. Thus, we could accurately measure the rapid diffusion times of unconjugated GFP in PBS, but we consistently underestimated the longer diffusion times of GFP in a more viscous 90% glycerol solution. Under our experimental conditions, focal volume residence times as short as 0.25 s were sufficient to induce some cryptic photobleaching, leading to an underestimation of the residence time by a factor of 2 (for GFP diffusing in 90% glycerol) to 5 (for binding of GFP-VBP-ZIP). For longer residence times, such as the binding of GFP-GR, the underestimation progressively worsened (by a factor of 7), presumably due to the increasing probability that a molecule in the focal volume would photobleach before it exited.
We also found that, like 2P-FCS, 1P-FCS is susceptible to cryptic photobleaching. The effect did not appear to be as severe as in 2P-FCS, since we could accurately measure diffusion of unconjugated GFP in 90% glycerol, at least at the lowest laser powers tested. Nevertheless, as in 2P-FCS, measurement of GFP-GR binding produced the same underestimates. In both cases, the signal/noise ratio was the limiting factor that prevented a plateau in estimates at lower laser powers.
Although cryptic photobleaching is not likely to be a problem for the great majority of FCS studies, which traditionally have focused on the measurement of rapid diffusion, our data suggest that the measurement of slower processes corresponding to focal volume residence times as short as 0.25 s may be problematic. This is likely to be an issue primarily for GFP-tagged proteins that bind to immobile cellular structures. Thus, the correction for photobleaching becomes essential when the goal is to predict binding residence times.
To minimize cryptic photobleaching in FCS, we used TICS, but other FCS variants would also be suitable for measuring moderately long residence times. Raster image correlation spectroscopy (36) and FCS performed with a spinning disk confocal microscope (37) already include a correction for photobleaching, so these methods will probably also yield more accurate estimates for longer residence times. An alternate approach that avoids the need for a photobleaching correction altogether may be point-scanning FCS (40). In this method, pixel dwell times are short enough to avoid substantial photobleaching, providing a potentially more direct approach to measure longer residence times. Intermittent excitation and/or the replacement of GFP with more photostable fluorescent proteins should similarly reduce photobleaching (here we focused only on GFP because of its widespread use). With a greater awareness of the potential for cryptic photobleaching, future studies should help elucidate which FCS approaches are best suited to avoid or correct for this phenomenon.
Toward a gold standard in live-cell binding measurements
By accounting for the photobleaching of GFP-GR molecules that reside for longer times in the FCS measurement volume, we were able to obtain diffusion and binding estimates that are close to those obtained from FRAP. Considering that FRAP estimates of transcription factor binding times only recently differed by four orders of magnitude (10), this cross-validation is reassuring and represents real progress toward achieving a gold standard for in vivo binding measurements.
Although they are close, the FCS estimates for GFP-GR are not quite within error of the FRAP estimates. In particular, although most of the alarming order-of-magnitude discrepancy in the binding residence times was eliminated by our photobleach correction with TICS, the estimated diffusion coefficients diverged slightly in the process. Both the FRAP and FCS protocols contain a number of approximations that could alter diffusion and binding estimates. For FRAP (4) these include neglecting reversible photobleaching and the detailed shape and finite time of the intentional photobleach. For FCS these include the 3D geometry of the PSF (34,41), sample movement that limits the length of quality measurement intervals, and the photobleaching correction procedure that we used here for TICS. In addition, the common underlying model may be wrong (for example, diffusion may be anomalous). High-resolution techniques such as SMT (42) and stimulated emission depletion microscopy (43) should help resolve this issue, although since both techniques require relatively high laser powers (our rough calculations suggest that SMT and stimulated emission depletion respectively require 10× and 100× higher laser power than standard imaging), photobleaching may still be problematic. Ultimately, a true gold standard for live-cell binding will only be achieved when multiple orthogonal approaches converge on the same estimates.
Acknowledgments
We thank Dr. Xufeng Wu for assistance with the 1P-FCS, Dr. Tatiana Karpova for imaging guidance, and Dr. Davide Mazza and Dr. Dan Sisan for helpful comments.
This research was supported in part by the intramural program of the National Institutes of Health, National Cancer Institute, Center for Cancer Research, and the National Heart, Lung, and Blood Institute.
Footnotes
Ariel Michelman-Ribeiro's present address is Semiconductor Electronics Division, Electronics and Electrical Engineering Laboratory, National Institute of Standards and Technology, Gaithersburg, MD.
Supporting Material
References
- 1.Houtsmuller A.B. Fluorescence recovery after photobleaching: application to nuclear proteins. Adv. Biochem. Eng. Biotechnol. 2005;95:177–199. doi: 10.1007/b102214. [DOI] [PubMed] [Google Scholar]
- 2.Sprague B.L., McNally J.G. FRAP analysis of binding: proper and fitting. Trends Cell Biol. 2005;15:84–91. doi: 10.1016/j.tcb.2004.12.001. [DOI] [PubMed] [Google Scholar]
- 3.Beaudouin J., Mora-Bermúdez F., Ellenberg J. Dissecting the contribution of diffusion and interactions to the mobility of nuclear proteins. Biophys. J. 2006;90:1878–1894. doi: 10.1529/biophysj.105.071241. [DOI] [PMC free article] [PubMed] [Google Scholar]
- 4.Mueller F., Mazza D., McNally J.G. FRAP and kinetic modeling in the analysis of nuclear protein dynamics: what do we really know? Curr. Opin. Cell Biol. 2010;22:403–411. doi: 10.1016/j.ceb.2010.03.002. [DOI] [PMC free article] [PubMed] [Google Scholar]
- 5.Trembecka D.O., Kuzak M., Dobrucki J.W. Conditions for using FRAP as a quantitative technique—influence of the bleaching protocol. Cytometry A. 2010;77:366–370. doi: 10.1002/cyto.a.20866. [DOI] [PubMed] [Google Scholar]
- 6.Farla P., Hersmus R., Houtsmuller A.B. The androgen receptor ligand-binding domain stabilizes DNA binding in living cells. J. Struct. Biol. 2004;147:50–61. doi: 10.1016/j.jsb.2004.01.002. [DOI] [PubMed] [Google Scholar]
- 7.Hinow P., Rogers C.E., DiBenedetto E. The DNA binding activity of p53 displays reaction-diffusion kinetics. Biophys. J. 2006;91:330–342. doi: 10.1529/biophysj.105.078303. [DOI] [PMC free article] [PubMed] [Google Scholar]
- 8.Phair R.D., Scaffidi P., Misteli T. Global nature of dynamic protein-chromatin interactions in vivo: three-dimensional genome scanning and dynamic interaction networks of chromatin proteins. Mol. Cell. Biol. 2004;24:6393–6402. doi: 10.1128/MCB.24.14.6393-6402.2004. [DOI] [PMC free article] [PubMed] [Google Scholar]
- 9.Sprague B.L., Pego R.L., McNally J.G. Analysis of binding reactions by fluorescence recovery after photobleaching. Biophys. J. 2004;86:3473–3495. doi: 10.1529/biophysj.103.026765. [DOI] [PMC free article] [PubMed] [Google Scholar]
- 10.Mueller F., Wach P., McNally J.G. Evidence for a common mode of transcription factor interaction with chromatin as revealed by improved quantitative fluorescence recovery after photobleaching. Biophys. J. 2008;94:3323–3339. doi: 10.1529/biophysj.107.123182. [DOI] [PMC free article] [PubMed] [Google Scholar]
- 11.Magde D., Webb W.W., Elson E. Thermodynamic fluctuations in a reacting system—measurement by fluorescence correlation spectroscopy. Phys. Rev. Lett. 1972;29:705. [Google Scholar]
- 12.Elson E.L. Fluorescence correlation spectroscopy measures molecular transport in cells. Traffic. 2001;2:789–796. doi: 10.1034/j.1600-0854.2001.21107.x. [DOI] [PubMed] [Google Scholar]
- 13.Renz M., Langowski J. Dynamics of the CapG actin-binding protein in the cell nucleus studied by FRAP and FCS. Chromosome Res. 2008;16:427–437. doi: 10.1007/s10577-008-1234-6. [DOI] [PubMed] [Google Scholar]
- 14.Rigler R., Pramanik A., Wahren J. Specific binding of proinsulin C-peptide to human cell membranes. Proc. Natl. Acad. Sci. USA. 1999;96:13318–13323. doi: 10.1073/pnas.96.23.13318. [DOI] [PMC free article] [PubMed] [Google Scholar]
- 15.Schwille P., Bieschke J., Oehlenschläger F. Kinetic investigations by fluorescence correlation spectroscopy: the analytical and diagnostic potential of diffusion studies. Biophys. Chem. 1997;66:211–228. doi: 10.1016/s0301-4622(97)00061-6. [DOI] [PubMed] [Google Scholar]
- 16.Mikuni S., Tamura M., Kinjo M. Analysis of intranuclear binding process of glucocorticoid receptor using fluorescence correlation spectroscopy. FEBS Lett. 2007;581:389–393. doi: 10.1016/j.febslet.2006.12.038. [DOI] [PubMed] [Google Scholar]
- 17.Merkle D., Zheng D., Schwille P. Cellular dynamics of Ku: characterization and purification of Ku-eGFP. ChemBioChem. 2008;9:1251–1259. doi: 10.1002/cbic.200700750. [DOI] [PubMed] [Google Scholar]
- 18.Maeder C.I., Hink M.A., Knop M. Spatial regulation of Fus3 MAP kinase activity through a reaction-diffusion mechanism in yeast pheromone signalling. Nat. Cell Biol. 2007;9:1319–1326. doi: 10.1038/ncb1652. [DOI] [PubMed] [Google Scholar]
- 19.Müller K.P., Erdel F., Rippe K. Multiscale analysis of dynamics and interactions of heterochromatin protein 1 by fluorescence fluctuation microscopy. Biophys. J. 2009;97:2876–2885. doi: 10.1016/j.bpj.2009.08.057. [DOI] [PMC free article] [PubMed] [Google Scholar]
- 20.Petersen N.O., Elson E.L. Measurements of diffusion and chemical kinetics by fluorescence photobleaching recovery and fluorescence correlation spectroscopy. Methods Enzymol. 1986;130:454–484. doi: 10.1016/0076-6879(86)30021-1. [DOI] [PubMed] [Google Scholar]
- 21.Schmiedeberg L., Weisshart K., Hemmerich P. High- and low-mobility populations of HP1 in heterochromatin of mammalian cells. Mol. Biol. Cell. 2004;15:2819–2833. doi: 10.1091/mbc.E03-11-0827. [DOI] [PMC free article] [PubMed] [Google Scholar]
- 22.Guo L., Har J.Y., Wohland T. Molecular diffusion measurement in lipid bilayers over wide concentration ranges: a comparative study. ChemPhysChem. 2008;9:721–728. doi: 10.1002/cphc.200700611. [DOI] [PubMed] [Google Scholar]
- 23.Grünwald D., Hoekstra A., Kubitscheck U. Direct observation of single protein molecules in aqueous solution. ChemPhysChem. 2006;7:812–815. doi: 10.1002/cphc.200500632. [DOI] [PubMed] [Google Scholar]
- 24.Michelman-Ribeiro A., Mazza D., McNally J.G. Direct measurement of association and dissociation rates of DNA binding in live cells by fluorescence correlation spectroscopy. Biophys. J. 2009;97:337–346. doi: 10.1016/j.bpj.2009.04.027. [DOI] [PMC free article] [PubMed] [Google Scholar]
- 25.McNally J.G., Müller W.G., Hager G.L. The glucocorticoid receptor: rapid exchange with regulatory sites in living cells. Science. 2000;287:1262–1265. doi: 10.1126/science.287.5456.1262. [DOI] [PubMed] [Google Scholar]
- 26.Stasevich T.J., Mueller F., McNally J.G. Dissecting the binding mechanism of the linker histone in live cells: an integrated FRAP analysis. EMBO J. 2010;29:1225–1234. doi: 10.1038/emboj.2010.24. [DOI] [PMC free article] [PubMed] [Google Scholar]
- 27.Kolin D.L., Wiseman P.W. Advances in image correlation spectroscopy: measuring number densities, aggregation states, and dynamics of fluorescently labeled macromolecules in cells. Cell Biochem. Biophys. 2007;49:141–164. doi: 10.1007/s12013-007-9000-5. [DOI] [PubMed] [Google Scholar]
- 28.Petrásek Z., Schwille P. Precise measurement of diffusion coefficients using scanning fluorescence correlation spectroscopy. Biophys. J. 2008;94:1437–1448. doi: 10.1529/biophysj.107.108811. [DOI] [PMC free article] [PubMed] [Google Scholar]
- 29.Gendron P.O., Avaltroni F., Wilkinson K.J. Diffusion coefficients of several rhodamine derivatives as determined by pulsed field gradient-nuclear magnetic resonance and fluorescence correlation spectroscopy. J. Fluoresc. 2008;18:1093–1101. doi: 10.1007/s10895-008-0357-7. [DOI] [PubMed] [Google Scholar]
- 30.Dittrich P.S., Schwille P. Photobleaching and stabilization of fluorophores used for single-molecule analysis with one- and two-photon excitation. Appl. Phys. B. 2001;73:829–837. [Google Scholar]
- 31.Eggeling C., Widengren J., Seidel C.A.M. Photobleaching of fluorescent dyes under conditions used for single-molecule detection: Evidence of two-step photolysis. Anal. Chem. 1998;70:2651–2659. doi: 10.1021/ac980027p. [DOI] [PubMed] [Google Scholar]
- 32.Petrásek Z., Schwille P. Photobleaching in two-photon scanning fluorescence correlation spectroscopy. ChemPhysChem. 2008;9:147–158. doi: 10.1002/cphc.200700579. [DOI] [PubMed] [Google Scholar]
- 33.Widengren J., Rigler R. Mechanisms of photobleaching investigated by fluorescence correlation spectroscopy. Bioimaging. 1996;4:149–157. [Google Scholar]
- 34.Nagy A., Wu J.R., Berland K.M. Observation volumes and γ-factors in two-photon fluorescence fluctuation spectroscopy. Biophys. J. 2005;89:2077–2090. doi: 10.1529/biophysj.104.052779. [DOI] [PMC free article] [PubMed] [Google Scholar]
- 35.Heuvelman G., Erdel F., Rippe K. Analysis of protein mobilities and interactions in living cells by multifocal fluorescence fluctuation microscopy. Eur. Biophys. J. 2009;38:813–828. doi: 10.1007/s00249-009-0499-9. [DOI] [PubMed] [Google Scholar]
- 36.Digman M.A., Brown C.M., Gratton E. Paxillin dynamics measured during adhesion assembly and disassembly by correlation spectroscopy. Biophys. J. 2008;94:2819–2831. doi: 10.1529/biophysj.107.104984. [DOI] [PMC free article] [PubMed] [Google Scholar]
- 37.Sisan D.R., Arevalo R., Urbach J.S. Spatially resolved fluorescence correlation spectroscopy using a spinning disk confocal microscope. Biophys. J. 2006;91:4241–4252. doi: 10.1529/biophysj.106.084251. [DOI] [PMC free article] [PubMed] [Google Scholar]
- 38.Dobrucki J.W., Feret D., Noatynska A. Scattering of exciting light by live cells in fluorescence confocal imaging: phototoxic effects and relevance for FRAP studies. Biophys. J. 2007;93:1778–1786. doi: 10.1529/biophysj.106.096636. [DOI] [PMC free article] [PubMed] [Google Scholar]
- 39.Heinze K.G., Costantino S., Wiseman P.W. Beyond photobleaching, laser illumination unbinds fluorescent proteins. J. Phys. Chem. B. 2009;113:5225–5233. doi: 10.1021/jp8060152. [DOI] [PubMed] [Google Scholar]
- 40.Ries J., Schwille P. Studying slow membrane dynamics with continuous wave scanning fluorescence correlation spectroscopy. Biophys. J. 2006;91:1915–1924. doi: 10.1529/biophysj.106.082297. [DOI] [PMC free article] [PubMed] [Google Scholar]
- 41.Hess S.T., Webb W.W. Focal volume optics and experimental artifacts in confocal fluorescence correlation spectroscopy. Biophys. J. 2002;83:2300–2317. doi: 10.1016/S0006-3495(02)73990-8. [DOI] [PMC free article] [PubMed] [Google Scholar]
- 42.Grünwald D., Martin R.M., Cardoso M.C. Probing intranuclear environments at the single-molecule level. Biophys. J. 2008;94:2847–2858. doi: 10.1529/biophysj.107.115014. [DOI] [PMC free article] [PubMed] [Google Scholar]
- 43.Eggeling C., Ringemann C., Hell S.W. Direct observation of the nanoscale dynamics of membrane lipids in a living cell. Nature. 2009;457:1159–1162. doi: 10.1038/nature07596. [DOI] [PubMed] [Google Scholar]
Associated Data
This section collects any data citations, data availability statements, or supplementary materials included in this article.