

Abstract
Otoferlin, a C2-domain-containing Ca2+ binding protein, is required for synaptic exocytosis in auditory hair cells. However, its exact role remains essentially unknown. Intriguingly enough, no balance defect has been observed in otoferlin-deficient (Otof−/−) mice. Here, we show that the vestibular nerve compound action potentials evoked during transient linear acceleration ramps in Otof−/− mice display higher threshold, lower amplitude, and increased latency compared with wild-type mice. Using patch-clamp capacitance measurement in intact utricles, we show that type I and type II hair cells display a remarkable linear transfer function between Ca2+ entry, flowing through voltage-activated Ca2+ channels, and exocytosis. This linear Ca2+ dependence was observed when changing the Ca2+ channel open probability or the Ca2+ flux per channel during various test potentials. In Otof−/− hair cells, exocytosis displays slower kinetics, reduced Ca2+ sensitivity, and nonlinear Ca2+ dependence, despite morphologically normal synapses and normal Ca2+ currents. We conclude that otoferlin is essential for a high-affinity Ca2+ sensor function that allows efficient and linear encoding of low-intensity stimuli at the vestibular hair cell synapse.
Introduction
In cochlear hair cells, synaptic transmission involves a highly coordinated process of multivesicular release that is triggered by Ca2+ ions flowing through nearby clustered L-type Ca2+ channels containing the Cav1.3 (α1D) subunit (Glowatzki and Fuchs, 2002; Brandt et al., 2005). Remarkably, a linear relationship is found between the hair cell Ca2+ current and synaptic vesicle exocytosis (Johnson et al., 2005; Schnee et al., 2005; Beurg et al., 2008). Also, the synaptic transfer function relating presynaptic Ca2+ current and postsynaptic afferent activity operates in a very efficient linear regimen (Keen and Hudspeth, 2006; Goutman and Glowatzki, 2007). This linear synaptic transfer function enables sensory information from small graded receptors potentials to be transferred with minimal distortion across the synapse, as in photoreceptors (Thoreson, 2007).
It has been suggested that otoferlin, a large transmembrane vesicular Ca2+ binding protein with six C2 domains operates as the main Ca2+ sensor for neurotransmitter release at auditory hair cell ribbon synapses (Yasunaga et al., 1999; Roux et al., 2006). Otoferlin-null (Otof−/−) mice have a very severe hearing impairment as a result of the failure of Ca2+-evoked exocytosis in cochlear hair cells (Roux et al., 2006; Beurg et al., 2008). Otoferlin localizes to ribbon-associated vesicles and interacts, in a Ca2+-dependent manner, with the SNARE (SNAP receptor) complex proteins syntaxin-1 and SNAP25 (synaptosome-associated protein of 25 kDa) in vitro. Moreover, the C2D domain of otoferlin can bind to the Cav1.3 subunit of the calcium channel in vitro (Ramakrishnan et al., 2009).
Synaptic vesicle exocytosis in mammalian vestibular hair cells has, however, not been explored. Like cochlear hair cells, vestibular hair cells express L-type Ca2+ channels containing the Cav1.3 subunit (Bao et al., 2003; Dou et al., 2004) and otoferlin (Yasunaga et al., 1999; Roux et al., 2006; Schug et al., 2006). This protein could thus operate as a Ca2+ sensor for neurotransmitter release in vestibular hair cells too. Despite the fact that Otof−/− mice have no apparent vestibular dysfunction in gross behavior tests (Roux et al., 2006; Schwander et al., 2007), a subtle defect at vestibular hair cell synapses may have been overlooked.
The mammalian vestibular sensory organs are generally described as low-frequency analyzers of head motion from a few hertz down to stationary position (head tilt), yet the vestibular hair cell synapses work with a temporal precision in the millisecond range. Notably, the latency of onset of head motion to onset of eye movement in the vestibular ocular reflex is below 10 ms (Huterer and Cullen, 2002). Vestibular nerve fibers show a remarkable linear relationship between the action potential discharge rate and the velocity of head rotation (Goldberg and Fernandez, 1971; Hullar and Minor, 1999). These characteristics of linearity and temporal precision, which are similar to those found in auditory hair cells, prompted us to characterize the Ca2+ dependence and kinetics of synaptic exocytosis in mouse vestibular hair cells and study the possible role of otoferlin in these properties.
Materials and Methods
Gravity receptor function: vestibular-evoked potentials
The use of mice herein was approved by the Institutional Animal Care and Use Committee at East Carolina University. Mice were anesthetized by intraperitoneal injections of a ketamine (75 mg/kg) and xylazine (8 mg/kg) mixture. Core body temperature was maintained at 37.0 ± 0.2°C using a homeothermic heating blanket system (FHC Inc.).
Vestibular-evoked potential (VsEP) recordings were based on methods published by Jones et al. (1999, 2006). These methods were modified for the present study to use a noninvasive coupling system for securing the head to the mechanical shaker. Stimuli were delivered to the head using a voltage-controlled mechanical shaker. The head was coupled to a custom platform with a custom head clip. The head clip was a lightweight plastic spring hair clip with tines modified to encircle the head anterior to the pinnae. The spring clip was screwed to the custom platform mounted to the mechanical shaker. Stainless steel wire was placed subcutaneously at the nuchal crest to serve as the non-inverting electrode. Needle electrodes were placed posterior to the right pinna and at the ventral neck for inverting and ground electrodes, respectively. Traditional signal averaging was used to resolve responses in electrophysiological recordings. Ongoing electroencephalographic activity was amplified (200,000×), filtered (300–3000 Hz, −6 dB amplitude points), and digitized (1024 points, 10 μs/point). A total of 256 primary responses were averaged for each VsEP response waveform. All responses were replicated.
Linear acceleration pulses, 2 ms duration, were presented to the cranium in the naso-occipital axis using two stimulus polarities, normal and inverted. Stimuli were presented at a rate of 17 pulses/s. Stimulus amplitude ranged from +6 to −18 dB, re: 1.0 g/ms (where 1 g = 9.8 m/s2) adjusted in 3 dB steps. A broadband forward masker (50–50,000 Hz, 97 dB sound pressure level) was presented during VsEP measurements to verify the absence of cochlear responses. Recordings began at the maximum stimulus intensity (i.e., +6 dB, re: 1.0 g/ms) with and without acoustic masking, and then intensity was dropped to −18 dB and raised in 3 dB steps to complete an intensity profile. The first three positive and negative response peaks were scored. The first response peak (i.e., P1 and N1) was used for analyses because this peak represents compound neural activity from the peripheral vestibular nerve (Nazareth and Jones, 1998). Response peak latency for P1 (measured in milliseconds), peak-to-peak amplitude for P1–N1 (measured in microvolts), and thresholds (measured in decibels, re: 1.0 g/ms) were quantified. Linear regression was used to obtain the latency–intensity and amplitude–intensity slopes for each animal on the unweighted raw data. Descriptive statistics were generated for each genotype. Variability is reported as SD, unless otherwise stated. Independent samples t test was used to compare P1 latency, P1–N1 amplitude, VsEP thresholds, and slopes between genotypes.
Mice were obtained by interbreeding of Otof+/− heterozygote mice. Tail DNA genotyping was done by PCR (REDExtract-N-Amp tissue PCR kit; Sigma) using primers 5′-CACTTGCTTTGTCTCATCTCC-3′ and 5′-GTCACTTCTTCTGGGTATTTC-3′. The following PCR products were generated: a single 1.23 kbp product for wild-type (Otof+/+) mice, a single 507 bp product for knock-out homozygote (Otof−/−) mice, and both PCR products for Otof+/− mice (Roux et al., 2006). VsEPs were studied in 2-month-old Otof+/+, Otof+/−, and Otof−/− mice (n = 5, n = 11, and n = 9, respectively). No significant differences (latency − threshold) were found between Otof+/+ and Otof+/− mice (data not shown).
Recordings from the mouse vestibular utricle
Organ preparation.
The study on exocytosis was performed on 36 mice (12 Otof+/+, 8 Otof+/−, and 16 Otof−/−), ages postnatal day 4 (P4) to P9 issued from 12 different litters. Recordings of firing activity on type I calyx endings were performed on a total of 14 P17–P30 mice issued from four different litters (nine Otof+/+ and five Otof−/−). Neonatal mice were obtained by interbreeding of heterozygotes mice Otof+/−. Recordings and analysis were performed before knowing the mice genotype. All experiments were performed in accordance with Inserm and Pasteur Institute welfare guidelines. Care was taken to minimize animal pain. Mice were deeply anesthetized when necessary, with a rodent mixture [ketamine at 50 mg/kg (PanPharma) and Rompun at 5 mg/kg (Bayer Pharma)].
Experiments were performed on freshly dissected utricular organs from which otoconia were carefully removed from the upper surface of the sensory epithelium after a light enzymatic digestion with proteinase XXIV (50 μg/ml for 5 min; Sigma). The extraction from the temporal bone and the dissecting step of the utricle were performed in a cold (5–10°C) perilymph-like solution [in mm: 135 NaCl, 5.8 KCl, 1.3 CaCl2, 0.9 MgCl2, 0.7 NaH2PO4, 5.6 d-glucose, 2 Na-pyruvate, and 10 Na-HEPES, pH 7.4 (osmolality near 300 mmol/kg)]. The dissected sensory organ was then fixed flat, with sterocilia bundles facing up, under a network of dental floss strands anchored at the bottom of the experimental perfusion chamber (PC-H chamber from Siskiyou). The recording chamber was filled with 2 ml of perilymph [supplemented with 1 μm TTX (Sigma), 10 mm tetraethylammonium (TEA)-Cl, and 100 nm apamin (Latoxan); during ICa and ΔCm recordings], and the organ was continuously perfused at room temperature (22–24°C) at a rate of 100 μl/min using a Masterflex LS pump (Cole Parmer Instrument Company). The sensory hair cells were viewed through a 40× LWD water-immersion objective (numerical aperture 0.8) on an Olympus BX51WI microscope.
Electrophysiology.
Ruptured-patch whole-cell recordings were obtained using 3–4 MΩ electrodes pulled from borosilicate glass capillaries (1B150F-4; WPI) on a Sachs-Flaming Microelectropuller (model PC-84; Sutter Instruments). The tip of the recording patch pipettes were carefully fire polished with a microforge (MF-830; Narishige) to improve seal resistance stability and coated with ski wax (SWIX) to minimize pipette capacitance. The internal pipette solution contained the following (in mm): 150 CsCl, 1 MgCl2, 5 TEA-Cl, 1 EGTA, 5 Na2ATP, 0.5 Na2GTP, and 5 Cs-HEPES, pH 7.4 (osmolality near 300 mmol/kg). A liquid junction potential of ∼2 mV (not corrected in our recordings) was measured between the internal pipette solution and the external solution.
Real-time changes in membrane capacitance (ΔCm) were made using the “track-in” circuitry of the Optopatch amplifier (Cairn Research) as described previously by Johnson et al. (2002). A 2.5 kHz sine wave of 18–20 mV was applied to the cells from a holding potential of −80 mV. The amplifier output of membrane current, membrane capacitance, and series resistance were acquired and analyzed with a Digidata 1320A interface and pClamp 10 software (Molecular Devices). Cm signals were low-pass filtered at 80 Hz. ΔCm responses were measured 50 ms after the end of the depolarizing pulse and averaged over a period of 100–300 ms.
Type I and type II hair cells were essentially recorded from the central part of the utricle near the striola zone. Passive membrane properties and access resistance of hair cells were assessed using the membrane test function in Clampex (pClamp 10). No significant differences in Cm and series resistance (Rs) were observed between wild-type [type I: Rs = 11.46 ± 1.25 MΩ with Cm = 4.11 ± 0.13 pF (n = 45); type II: RS = 11.22 MΩ ± 1.27 with Cm = 3.91 ± 0.14 pF (n = 16)] and Otof−/− [type I: Rs = 11.07 ± 0.60 MΩ with Cm = 4.24 ± 0.24 pF (n = 23); type II: RS = 11.23 ± 0.81 MΩ with Cm = 4.29 ± 0.16 pF (n = 19)] hair cells. Hair cells that did not present stable Rs during experimental recordings were discarded.
For the recordings of spontaneous postsynaptic firing activity (action potentials), cell-attached loose patch recordings (Rseal = 15–100 MΩ) from type I hair cell calyces were done in normal 1.3 mm Ca2+ perilymph by using 5–6 MΩ electrodes pulled from similar glass capillaries. The amplifier was set in either the current- or voltage-clamp mode and held at the zero current potential, with no current injection, with low pass-filter set at 10 kHz. For spontaneous EPSCs recordings, cell-attached tight seals (Rseal = 4.4 ± 0.6 GΩ) were performed on type I hair cell calyces under voltage clamp at −80 mV in the presence of 1 μm TTX. We used Mini Analysis Program 6.03 (Synaptosoft) to detect and analyze the peaks of spontaneous miniature synaptic currents. Peak events were detected automatically using an amplitude threshold, two times the average root mean square noise (∼5 pA). It is to be noted that our settings of the program analysis, i.e., threshold and period to search (5 ms), resulted in the treatment of most multiphasic events as single peaks. To block spontaneous activity, the preparation was perfused with 50 μm NBQX for at least 10–15 min (Tocris Bioscience).
Identification of type I and type II hair cells.
Under differential contrast microscopy, by focusing up and down into the preparation, type I hair cells were recognized with surrounding single or multiple calyces. Furthermore, type I hair cells could also be identified from type II hair cells in our electrophysiological recordings by the expression of gKL, a specific conductance partially permeable to Cs+ ions and activated near resting potentials (Rüsch et al., 1998; Bao et al., 2003). Hair cells presenting a slowly activating outward Cs+ conductance at positive potentials were considered to be of type I, whereas other cells were considered of type II. Although our recordings were essentially made in the striola area of the utricle in which faster maturation occurs, it is still possible that some of the hair cells termed type II may correspond to undifferentiated type I hair cells that are not yet expressing gKL and have incomplete calyces at P4–P9 (Rüsch et al., 1998). In our experimental conditions, using an intracellular recording solution containing 150 mm CsCl, the activation time and amplitude of gKL was low enough to allow the recording of the voltage-activated Ca2+ currents (ICa) in type I hair cells.
Curve fitting and statistical analysis.
Curve fitting and statistical analysis were done using Origin software (OriginLab) and GraphPad Software. The criterion for statistical significance was chosen to be p < 0.05 and evaluated with F tests and Student's t test or two-way ANOVA. Variability is reported as ±SEM, unless otherwise stated. Because recordings from Otof+/+ and Otof+/− vestibular hair cells did not show significant difference in ICa and ΔCm, these data were pooled in the same group, referred to as “wild-type.”
Immunohistofluorescence
Inner ear tissue preparation and immunohistochemistry for the light microscope were performed as reported previously (Roux et al., 2006) on 7- and 30-d-old mice. Inner ear sections (10 μm) were washed three times in PBS, preincubated in PBS solution supplemented with 20% of normal goat serum for 1 h, and incubated with a mixture of a polyclonal antibody directed against otoferlin (1:500) and a monoclonal anti-β-tubulin III antibody (1:200; Sigma) overnight at 4°C. After three washes in PBS, sections were incubated for 1 h with F(ab)′2 fragment of goat anti-rabbit IgG antibody conjugated with Alexa488 fluorescein (Interchim) or goat anti-mouse IgG antibody conjugated with cyanine 3 fluorophore (Jackson ImmunoResearch) diluted at 1:500 in PBS. Sections were then washed three times in PBS and finally covered by one drop of Fluorsave medium (Biochem Laboratories).
For ribbon quantification, utricular whole-mount preparations fixed with 4% paraformaldehyde (PFA) in PBS were permeabilized with 0.3% Triton X-100 in PBS containing 20% normal goat serum for 1 h at room temperature. The primary antibodies against myosin VIIA, CtBP2, and GluR2–GluR3 were used at dilutions of 1:100, 1:500, and 1:200, respectively. Microphotographs were made using a confocal laser scanning microscope LSM510 Meta (Carl Zeiss, Pasteur Institute, Imageople).
Electron microscopy
Inner ears from 6-d-old mice were fixed as described previously (Roux et al., 2006). The vestibular end organs were microdissected out individually and were processed by the progressive temperature-lowering technique. Ultrathin sections (70 nm) were cut with a Leica Ultracut S microtome and transferred to Formvar-coated single-slot grids. Immunogold labeling was performed as described previously (Roux et al., 2006). The sections were incubated overnight with otoferlin or antibodies diluted to 1:200, washed, and then incubated for 2 h with 10 nm gold-conjugated goat anti-mouse or goat anti-rabbit antibodies (1:50; Tebu). The sections were then stained with uranyl acetate and lead citrate and examined under a JEOL 1200EX electron microscope. For morphological analyses, inner ears were perfused with 4% PFA and 2% glutaraldehyde in PBS, pH 7.4, and immersed in the fixative solution for 2 h. They were then postfixed by overnight incubation in 1% osmium tetraoxide at 4°C, dehydrated in graded acetone concentrations, and embedded in Spurr's low-viscosity epoxy resin hardened at 70°C. Ultrathin sections were transferred to Formvar-coated single-slot grids, stained with uranyl acetate and lead citrate, and examined under a JEOL 1200EX electron microscope) (Pasteur Institute, Imageopole).
Results
Gravity receptor function is affected in otoferlin-deficient mice
Gravity receptor function that arises from the otolithic vestibular organs, utricle and saccule, was analyzed in 2-month-old mutant mice lacking otoferlin (Otof−/−), by recording compound action potentials of the vestibular nerve and central relays (VsEPs) during linear acceleration ramps (Jones et al., 1999; 2006). Typical VsEP waveforms recorded from Otof+/− and Otof−/− mice are shown in Figure 1A. Table 1 lists the means and SDs for thresholds latencies and amplitudes of the first two positive (P1, P2) and negative (N1, N2) peaks of VsEPs.
Figure 1.

Gravity receptor potentials indicate a reduced firing synchrony of Otof−/− vestibular neurons. Eighth nerve vestibular compound action potentials (VsEPs) were recorded from the surface of the mouse skull during transient linear acceleration ramps. A, Representative VsEP waveforms for one Otof+/− mouse (left) and one Otof−/− mouse (right). Stimulus levels are in decibels (re: 1.0 g/ms) and show a decreasing intensity series from +6 to −18 dB. Two traces are shown for each stimulus level to demonstrate reproducibility. Values at the left end of each trace pair represent the P1–N1 amplitude measured for the pair. Conspicuous differences in response peak amplitudes can be seen between the two genotypes. B, C, Response peak latencies and amplitudes at various stimulus levels (means ± SEM). Open symbols represent heterozygotes Otof+/−, and filled symbols represent homozygote knock-out (Otof−/−) mice. In C, the transfer functions of the vestibular nerve responses (response amplitude vs stimulus level in grams per millisecond) were fitted with the following power functions: Y = 0.202 + 0.358X1.09 (Otof+/−, R2 = 0.56) and Y = 0.341 + 0.015X4.11 (Otof−/−, R2 = 0.32).
Table 1.
Means and SDs for VsEP thresholds and response peak latencies and peak-to-peak amplitudes at +6 dB (re: 1.0 g/ms)
| Response parameter | Heterozygotes (+/−), n = 11 | Homozygotes (−/−), n = 9 |
|---|---|---|
| Threshold (dB, re: 1.0 g/ms) | −10.8 ± 3.0 | −7.5 ± 3.7 |
| P1 latency (ms) | 1.37 ± 0.07 | 1.48 ± 0.11 |
| N1 latency (ms) | 1.68 ± 0.08 | 1.79 ± 0.12 |
| P2 latency (ms) | 2.13 ± 0.10 | 2.25 ± 0.12 |
| P1–N1 amplitude (μV) | 0.98 ± 0.30 | 0.60 ± 0.22 |
| P2–N2 amplitude (μV) | 1.05 ± 0.43 | 0.79 ± 0.34 |
The first response peak P1 was used for statistical analyses, because it is produced by the peripheral portion of the vestibular nerve and would be affected by a hair cell synaptic defect. At the maximum stimulus intensity presented (+6 dB, re: 1.0 g/ms), P1 latency was significantly longer (p < 0.05) (Fig. 1B), P1–N1 amplitude was significantly smaller (p < 0.05) (Fig. 1C), and thresholds were significantly higher (p < 0.05) (Table 1) for Otof−/− mice than for Otof+/− mice.
Response peak latency for P1 decreased linearly with increasing stimulus intensity (Fig. 1B). Linear fit of the latency decrease from individual animals gave a similar slope between Otof−/− and Otof+/− mice (21.08 ± 3.85 vs 21.47 ± 4.70 μs/dB, respectively). However, P1 latency was significantly prolonged for all stimuli tested in the Otof−/− mice as shown in the averaged data (Fig. 1B). Prolonged latencies are consistent with a presynaptic defect producing delayed or reduced release of neurotransmitter from the hair cells. In heterozygote or wild-type mice, P1–N1 response amplitudes showed a near linear relationship with stimulus intensity. The amplitude–intensity slope (0.05 ± 0.02 μV/dB) is consistent with values reported previously in other rodents (Jones et al., 1999; 2006). In contrast, in Otof−/− mice, the synaptic transfer function between P1–N1 response amplitudes and stimulus amplitude was significantly reduced (0.03 ± 0.02 μV/dB; p < 0.05). Response amplitudes pooled across animals for each genotype could be fitted by a power function with N = 1.09 and N = 4.11 for Otof+/− and Otof−/−, respectively (Fig. 1C).
Overall, these results suggest that otoferlin knock-out mice have functional deficits of the peripheral gravity receptors. Notably, a previous study of deaf5/deaf5 mice carrying a missense mutation in Otof did not observe VsEP defects (Longo-Guess et al., 2007). However, response parameters (latency and amplitude) were not quantified. Moreover, a missense mutation that substitutes an isoleucine for an asparagine in the C2B domain of the protein may have a different phenotype from the Otof knock-out mice examined herein.
Spontaneous synaptic activity is not affected in utricular hair cells lacking otoferlin
In the vestibular organs, two types of hair cells are described according to their synaptic terminal: type I and type II hair cells (for review, see Goldberg, 1991; Eatock et al., 2008). Type I hair cells are enveloped by a single calyx nerve ending, and type II hair cells receive several bouton endings (see Fig. 9). We took advantage of the large calyx endings surrounding type I hair cells to examine, in the cell-attached patch-clamp configuration, whether the pattern of spontaneous transmitter release is affected in the absence of otoferlin. Recordings were performed in intact utricles from P17–P27 mice in vitro. In Otof−/− mice, spontaneous firing activity was recorded, with a pattern of spikes (ranging from 8 to 30 Hz in frequency) similar to that of the wild-type mice (Fig. 2A,B). Indeed, the mean firing frequency and averaged coefficient of variation, an index of firing regularity, were not statistically different between mutant (Otof−/−, n = 8) and wild-type (Otof+/+, n = 13) mice (Fig. 2C,D). The firing activity was blocked by the AMPA receptor antagonist NBQX (50 μm; n = 3), indicating that it was driven by presynaptic glutamate release activating postsynaptic ionotropic glutamate receptors likely containing GluR2 and/or GluR3 AMPA receptor subunits (supplemental Fig. S2, available at www.jneurosci.org as supplemental material). The contribution of unconventional synaptic mechanisms (Goldberg, 1996), such as direct depolarization attributable to K+ accumulation in the cleft of the calyx nerve endings, seems therefore limited in our in vitro conditions yet cannot be excluded in vivo. It is noteworthy that the block by the AMPA receptor antagonist proceeded very slowly and only after a period of 10–15 min perfusion, as reported in afferent fibers of the semicircular canal ampullar crista (Lee et al., 2005), which could reflect a poor access of the drug into the tight synaptic cleft of the calyx.
Figure 9.
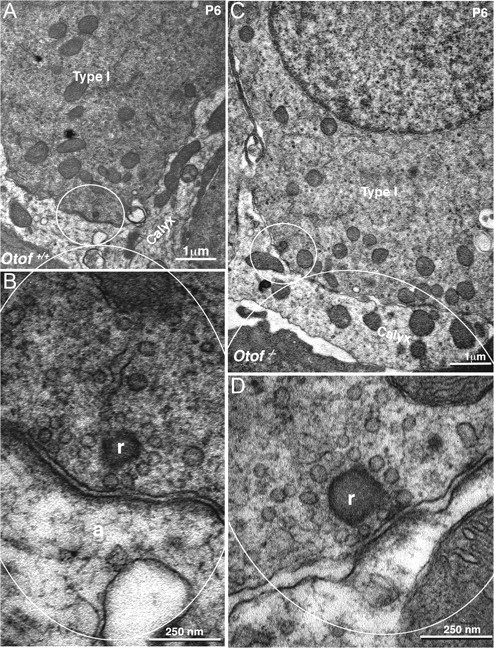
Synaptic ultrastructure is normal in Otof−/− type I hair cells. A, C, Low-power transmission electron micrograph of type I hair cells from an Otof+/+ (A) and Otof−/− (C) P6 mouse utricles. Type I hair cells are identified by their surrounding calyx of the afferent neuron. B, D, Higher-magnification micrographs of a ribbon-containing area from Otof+/+ (B) and Otof−/− (D) type I hair cells. The ribbons (r) are facing a mitochondria-containing postsynaptic structure, the calyx afferent ending (a). Vesicles can be seen that surround the ribbon in both wild-type and mutant cells.
Figure 2.

Postsynaptic recordings at the synaptic calyx ending of type I hair cells. A–D, Spontaneous action potential firing is unaffected in Otof−/− mice. Spontaneous firing activity was recorded in the intact mouse utricle (P17–P30) placed in artificial perilymph in vitro at 22°C. Typical recordings from an Otof+/+ calyx (A) and an Otof−/− calyx (B) showing a spontaneous discharge rate of 12 and 14 spikes/s, respectively. The perfusion of 50 μm NBQX blocked the firing activity (A, right). Interspike intervals (ISI; in C) and coefficient of variation (CV; SD of interspike interval/mean spike interval; D) are not significantly different between Otof+/+ calyces (n = 13) and Otof−/− calyces (n = 8). E–J, Spontaneous EPSCs are normal in Otof−/− mice. Spontaneous EPSCs were recorded in the intact mouse utricle (P17–P30) placed in artificial perilymph in vitro in the presence of 1 μm TTX. Typical recordings in an Otof +/+ calyx (E) and an Otof−/− calyx (F) are shown. EPSC amplitude distributions (G, H) and interevent interval histograms (I, J) were not significantly different.
Spontaneous EPSCs were recorded at the calyx endings in the presence of TTX, which blocks action potential firing. No significant difference in the amplitude and frequency of EPSCs was found between wild-type (21 ± 9 pA; n = 11) and Otof−/− (22 ± 9 pA; n = 12) mice (Fig. 2E,F). Both monophasic and multiphasic EPSCs that are suggestive of multivesicular release (Glowatzki and Fuchs, 2002) were observed in wild-type and mutant calyx endings (Fig. 2G,H). Similar kinetics were observed in mutant and wild-type mice (mean rise time, 0.91 ± 0.17 vs 1.08 ± 0.08 ms; mean time constant decay, 4.9 ± 1.8 vs 6.1 ± 1.3 ms, respectively; not statistically different at p > 0.05 in both cases). The amplitude histograms of EPSCs exhibited a skewed distribution with several discernable peaks, suggesting a multiquantal distribution and the possibility of coordinate release. A process of multivesicular release with perfect coordination would result in large-amplitude EPSCs. However, we cannot exclude that the multiphasic and large events could also arise from an overlapping activity of several ribbons or synapses. The single large afferent calyx fiber of type I hair cells receive inputs from several ribbons (release sites) and can also be dimorphic, i.e., connected to another hair cell with a calyx or a bouton ending. EPSCs amplitude distributions and interevent interval histograms were unchanged in Otof−/− calyx endings (Fig. 2G–J). Therefore, the absence of otoferlin does not seem to affect spontaneous neurotransmitter release and the expression of functional postsynaptic glutamate receptors at vestibular hair cell synapses.
Ca2+-dependent exocytosis is reduced in utricular hair cells lacking otoferlin
Fusion of vesicles to the plasma membrane (exocytosis) was probed in hair cells of intact utricular organs by monitoring Cm in the whole-cell patch-clamp configuration using a lock-in amplifier. All experiments were performed on utricles dissected from P4–P9 mice, an age at which vestibular organs are functional and hair cells have nearly acquired their mature voltage-gated conductances (Rüsch et al., 1998). We used P4–P9 mice here because longer and more stable whole-cell patch recordings could be obtained at this age. Cm responses were evoked by depolarizing voltage steps that are known to activate L-type Ca2+currents (ICa) in rodent vestibular hair cells (Bao et al., 2003; Almanza et al., 2003; Dou et al., 2004). To isolate ICa from other currents in the following experiments, we added 1 μm TTX, 10 mm TEA, and 100 nm apamin to the extracellular solution and used a cesium chloride intracellular solution to block most of the outward potassium currents.
Exocytosis in type I hair cells displays faster kinetics and more efficient Ca2+ dependence than in type II hair cells
Type I and type II hair cells from wild-type mice displayed rapidly activating, non-inactivating, Ca2+ currents (ICa) in response to depolarizing voltage steps (Figs. 3, 4). In both cell types, analysis of the current–voltage relationship indicated that ICa activates near −40 mV and reaches a maximum near −10 mV (Fig. 4D,H). Concomitant to ICa activation, a Cm increase (ΔCm) was recorded in 95% of the wild-type hair cells tested (n = 45 for type I and n = 16 for type II hair cells), the amplitude of which varied with depolarizing step level and duration, as shown previously for cochlear hair cells (Johnson et al., 2005; Beurg et al., 2008). The voltage-activation curve of ΔCm displayed a bell shape that followed the ICa activation curve (Fig. 4C,D), consistent with ΔCm being activated consecutive to Ca2+ influx.
Figure 3.

Fast Ca2+-dependent exocytosis is impaired in Otof−/− type I hair cells. Changes in membrane capacitance (ΔCm) were recorded during voltage activation of Ca2+ current (ICa) in P4–P9 intact utricles bathed in artificial perilymph (1.3 mm Ca2+) in vitro. In A are shown two differential interference contrast images of the intact utricle epithelium from which type I hair cells could be identified by their surrounding calyx. Most of the recorded cells were viewed from their apical surface as shown in the left. However, near the holding strand (black line above at right), which maintains and creases the utricle epithelium, the sensory hair cells could sometimes be seen from their side (right). Scale bar, 10 μm. A 25 ms voltage step (from −80 to −20 mV) activated ICa and a ΔCm response in wild-type type I hair cells (B). Although similar stimulation produced a normal ICa in Otof−/− mice, the ΔCm response was absent (C). The series resistance (Rs) was verified to be stable during the recordings.
Figure 4.

Ca2+-dependent exocytosis in type I (A–D) and type II hair cells (E–G). Example of ICa voltage activation (bottom trace) triggering a concomitant jump in membrane capacitance (ΔCm) in a wild-type type I hair cell (A). The cell was held at −80 mV and stepped for 500 ms to −10 mV. Utricles were bathed in artificial perilymph with 5 mm [Ca2+]ext. Stimulated under similar condition, whereas ICa was essentially unchanged, Otof−/− type I hair cells display a primarily reduced ΔCm response (B). Voltage-activation curve of ICa (D) and corresponding ΔCm responses (C) in wild-type (open black circle; n = 14) and Otof−/− (red filled circle; n = 13) type I hair cells. Each voltage step was separated by 1 min to allow recovery. Note the large inhibition of the ΔCm in Otof−/− mice, whereas ICa was essentially unaffected. Εxample of ICa and ΔCm responses in a wild-type (E) and Otof−/− (F) type II hair cell recorded in similar conditions than for type I hair cells. Voltage-activation curved of ICa (H) and corresponding ΔCm (G) in wild-type (black open circle; n = 9) and in Otof−/− (red filled circles; n = 17). Note that ΔCm were not significantly affected in Otof−/− type II hair cells at ICa peak. However, at −40 and −30 mV, near the activation voltage threshold of ICa, ΔCm were significantly lower in mutant mice (asterisks). This indicated a slight decrease in Ca2+ efficiency of exocytosis in type II hair cells.
In type I hair cells, a 25 ms depolarization from −80 to −10 mV triggered an inward current (ICa) with a mean amplitude of 6.6 ± 1.4 pA (n = 8) and a concomitant Cm jump averaging 5.5. ± 0.6 fF in a perilymph-like extracellular solution containing 1.3 mm Ca2+ (Fig. 3B). Rising [Ca2+]ext to 5 mm resulted in an increased ICa amplitude with peak values of 29.0 ± 3.1 pA (n = 14) at −10 mV (Fig. 4D). In the same conditions in 5 mm [Ca2+]ext, type II hair cells had a significant larger ICa of 58.2 ± 5.0 pA (n = 9) (Fig. 4E,H). Normalized to their respective membrane surface areas (Cm), type I and type II hair cells showed a maximum Ca2+ current density of 7.9 and 14.9 pA/pF, respectively. The ΔCm responses, for a 500 ms depolarization, were 17.5 ± 2.4 and 21.1 ± 5.8 fF in type I and type II hair cells, respectively (Fig. 4C,G). Therefore, the Ca2+ efficiency of exocytosis (ΔCm/ICa) is higher in type I hair cells (0.60 fF/pA) than in type II hair cells (0.36 fF/pA).
Both ICa and ΔCm were reduced when adding 50 μm nifedipine (reduction by 72 ± 6 and 93 ± 3%, respectively; n = 4). These characteristics of ICa in type I and type II utricular hair cells are in good agreement with those described in the ampullar crista (Bao et al., 2003; Almanza et al., 2003; Dou et al., 2004). Together, our results suggest that vestibular hair cell exocytosis is activated by Ca2+ influx flowing through voltage-activated L-type Ca2+ channels. Ca2+ currents in vestibular hair cells, as in cochlear hair cells, do not display rapid time inactivation (Bao et al., 2003 and the present study). This unusual feature of Cav1.3 Ca2+ channels has been proposed to depend on a regulation by a calmodulin-like Ca2+ binding protein, CaBP4 (Yang et al., 2006; Grant and Fuchs, 2008). This non-inactivating property of the Ca2+ current is certainly essential for the steadiness of transmitter release during constant stimulation of cochlear and vestibular hair cells.
To characterize the dynamics of vesicle pool recruitment, we used a single depolarizing step (from −80 to −10 mV) with increasing duration from 10 to 3000 ms (in 5 mm extracellular Ca2+ to ease ICa measurement) (Fig. 5). The time-dependent change of Cm could be fitted by the sum of two exponential functions with time constants of 30 and 1031 ms in type I hair cells and 170 and 1291 ms in type II hair cells, respectively (Fig. 5). This may correspond to the existence of two synaptic pools: a readily releasable pool (RRP) that presumably arises from vesicles docked at the active zones, and a secondary releasable pool (SRP) that represents the release of vesicles located further from the Ca2+ channels. Using a value of 37 aF per vesicle (Lenzi et al., 1999), a single-exponential fit to the first RRP phase (Fig. 5A,B, insets) gave a total release of 270 and 614 vesicles with release rates of 110 ± 8 fF/s (∼2970 vesicles/s) and 65 ± 9 fF/s (∼1756 vesicles/s) in type I and type II hair cells, respectively.
Figure 5.

Kinetics of vesicular release. A, Type I hair cells exocytosis (ΔCm) in responses to voltage steps of increasing duration. Hair cells were stimulated with the same voltage step from −80 to −10 mV in artificial perilymph containing 5 mm [Ca2+]ext. Each step was separated by 1 min. A first phase of exocytosis during short stimuli ranging from 10 to 200 ms recruited an initial small ΔCm component that likely represents the RRP of vesicles docked at the active zones (inset). In wild-type hair cells (open black circles; n = 17), data were best fitted using a single-exponential function with τ = 34 ms and maximum of 9.9 fF. Note that Otof−/− hair cells tested in similar conditions did not show significant ΔCm responses (filled red circle; n = 19). In wild-type hair cells (open black circles; n = 15), the ΔCm variation between stimuli ranging from 10 to 3000 ms could be fitted with the sum of two exponentials (τ1 = 30 ms and τ2 = 1031 ms, with a maximum ΔCm of 37.2 fF). In Otof−/− hair cells (filled red circles; n = 14), data were fitted with a single exponential (τ = 2042 ms). B, In type II hair cells, in similar experimental conditions, ΔCm kinetics in wild-type cells (open black circles; n = 9) could also be fitted by the sum of two exponentials (τ1 = 170 ms and τ2 = 1291 ms). In Otof−/− type II hair cells (filled red circles; n = 14), the initial phase of the RRP (up to 200 ms) was significantly reduced (inset), whereas the SRP was essentially unaffected.
To rule out any significant influence of endocytosis on the rates of exocytosis, the time course of endocytosis was evaluated after a 500 ms pulse depolarization from −80 to −10 mV by monitoring the subsequent Cm reduction (Fig. 6A). Endocytosis could be well approximated by a single-exponential function with an average time constant of 8.6 ± 1.3 s (n = 8). This time constant of endocytosis in vestibular hair cells is similar to values reported previously in auditory hair cells (Moser and Beutner, 2000; Schnee et al., 2005). The slow kinetics of endocytosis suggests that it contributes little to our ΔCm measurements for pulse depolarization durations below 3 s.
Figure 6.

Kinetics of endocytosis (A) and sensitivity of exocytosis to internal Ca2+ buffering (B). A, Example of endocytosis measured in a type I hair cell: an increase in Cm (exocytosis) was triggered by a 500 ms pulse (from −80 to −10 mV in 5 mm [Ca2+]ext), and the time course of Cm decrease was monitored over a period of 20 s. Endocytosis was best fitted using a single exponential with τ = 6.7 s (gray line). B, Exocytosis in type I hair cells was recorded in different intracellular Ca2+ buffering conditions: EGTA at 0.5 mm (n = 15), EGTA at 5 mm (n = 5), and BAPTA at 5 mm (n = 4). ΔCm responses were evoked by a 500 ms pulse (from −80 to −10 mV) in 5 mm [Ca2+]ext.
The RRP and SRP per cell values found here are two to four times smaller than those reported in other hair cell types (Nouvian et al., 2006). This difference is presumably attributable to the small size of mouse utricular hair cells (with a mean surface membrane area corresponding to a Cm value of ∼4 fF; see Materials and Methods) and to the presence of fewer synaptic zones. Indeed, vestibular hair cells are approximately two times smaller than cochlear inner hair cells (mean Cm for inner hair cells of ∼8 pF) (Moser and Beutner, 2000; Johnson et al., 2005) and approximately four times smaller than frog saccular hair cells (mean Cm of 15–16 pF) (Edmonds et al., 2004). If we assume a mean of seven to nine ribbons per vestibular hair cell (see our results below) compared with ∼15–20 in apical inner hair cells (Meyer et al., 2009), we calculated a number of RRP synaptic vesicles per ribbon (SV/rib) of 30–38 in type I hair cells and 68–88 in type II hair cells. These numbers are comparable with those reported in mouse cochlear inner hair cells (24–64 SV/rib) (Johnson et al., 2005; Khimich et al., 2005).
Ca2+-dependent exocytosis is more severely affected in type I than in type II hair cells lacking otoferlin
Tested under similar conditions as wild-type hair cells, all Otof−/− type I hair cells (n = 26) showed a normal ICa (peak amplitude, 5.4 ± 1.9 and 32.5 ± 5.8 pA in 1.3 and 5 mm [Ca2+]ext, respectively) but no significant ΔCm responses (below background threshold of 0.5 fF) when depolarized from −80 to −10 mV for 10 ms up to 200 ms (Fig. 3C). The ΔCm response was markedly reduced to 1.1 ± 0.5 fF (n = 13) during a 500 ms depolarization at the voltage value corresponding to peak ICa (Fig. 4B,C). The first kinetic component of the ΔCm response, corresponding to the RRP, was abolished in both 1.3 mm (Fig. 3C) and 5 mm [Ca2+]ext conditions (Fig. 5A, inset), whereas the second kinetic component of exocytosis, corresponding to the SRP, persisted but with a significant large time constant of 2042 ms (Fig. 5A).
The defective exocytosis in the mutant type I hair cells could not be attributed to changes in the properties of the Ca2+ currents. Indeed, analysis of normalized conductance–voltage curves gave indistinguishable parameters Gmax (maximum conductance), V1/2 (potential giving half-activation), and S (slope) when fitted with a first-order Boltzmann equation, in wild-type (n = 17 cells; in 5 mm [Ca2+]ext; Gmax = 1.04 ± 0.16 nS; V1/2 = −26.34 ± 0.55 mV; S = 7.04 ± 0.50 mV) and Otof−/− (n = 19 cells; in 5 mm [Ca2+]ext; Gmax = 1.21 ± 0.04 nS; V1/2 = −27.46 ± 1.00 mV; S = 7.18 ± 0.91 mV) cells. Furthermore, the time constants of ICa activation were similar in wild-type and Otof−/− hair cells (for a step from −80 to −10 mV; τ = 0.42 ± 0.03 and 0.45 ± 0.05 ms, respectively). Finally, ICa showed similar low inactivation, with a mean reduction of 7.5 ± 2.5 and 6.7 ± 3.3% over a 500 ms voltage step from −80 to −10 mV in wild-type and Otof−/− hair cells, respectively.
Tested under similar conditions, type II hair cells from Otof−/− mice displayed ICa (70.3 ± 8.1 pA) and ΔCm responses (19.8 ± 7.2 fF) that were not significantly different from wild-type II hair cells when stepping the cells from −80 to −10 mV for 500 ms (n = 17) (Fig. 4F–H). However, the Cm–voltage activation curve in mutant mice showed significant lower Cm responses for small depolarizations at −40 and −30 mV, that is when ICa is small (Fig. 4G) (p < 0.05), indicating that the Ca2+-dependent exocytotic process is also affected in type II hair cells lacking otoferlin. The release rate of the RRP component of the Cm response was indeed significantly reduced to a maximum initial release of 34 ± 9 fF/s, a value approximately two times lower than in wild-type cells (Fig. 5B, inset). In contrast, the release rate of the SRP was not significantly affected (Fig. 5B). Again, type II hair cells lacking otoferlin showed normal ICa. Indeed, normalized conductance–voltage curves gave indistinguishable parameters (Gmax, V1/2, and S; p > 0.05) between wild-type (n = 9 cells; in 5 mm [Ca2+]ext; Gmax = 2.17 ± 0.13 nS; V1/2 = −26.79 ± 0.69 mV; S = 6.15 ± 0.61 mV) and Otof−/− (n = 14 cells; in 5 mm [Ca2+]ext; Gmax = 2.59 ± 0.45 nS; V1/2 = −23.49 ± 1.88 mV; S = 5.25 ± 1.62 mV) cells when fitted with a first-order Boltzmann equation. Furthermore, the time constants of ICa activation were similar in wild-type and Otof−/− type II hair cells (−10 mV; τ = 0.54 ± 0.05s and 0.56 ± 0.09 ms, respectively). Finally, ICa showed similar low inactivation, with a reduction of 9.1 ± 2.3 and 9.9 ± 4.0% over a 500 ms step from −80 to −10 mV in wild-type and Otof−/− hair cells, respectively.
The linear Ca2+ dependence of exocytosis is affected in type I and type II hair cells lacking otoferlin
Next, we examined the relationship between Ca2+ entry and RRP exocytosis by depolarizing the vestibular hair cells for different duration, changing [Ca2+]ext or stepping to different test potentials. These different protocols have been designed to probe the organization of the release sites and Ca2+ channels (Ca2+ domains) at the synaptic zones. Exocytosis, driven by nonoverlapping Ca2+ nanodomains (a single channel is thought to be sufficient to activate release of a nearby vesicle), would change linearly when primarily manipulating the number of open channels and nonlinearly when varying the single-channel current as in cochlear inner hair cells (Brandt et al., 2005). In contrast, an organization of synaptic Ca2+domains that involves an overlapping population-based Ca2+ channels such as proposed in frog saccular hair cells (Roberts et al., 1990; Roberts, 1994) predicts that changes in the number of open channels or in the Ca2+ flux per channel would produce exocytosis with a similar linear dependence on Ca2+ (Augustine et al., 2003).
Linear dependence on ICa charge integral during cumulative Ca2+ entry.
The relationship between RRP exocytosis and Ca2+ entry was first evaluated in wild-type type I and type II hair cells by plotting ΔCm response against ICa charge integral (QCa = ICa × t) during a constant depolarizing step from −80 to −10 mV, with increasing time durations (t) from 10 to 200 ms in 5 mm [Ca2+]ext (ICa from cells described in Fig. 5A). This protocol tests the intrinsic Ca2+ sensitivity of the synaptic machinery independently of the respective contributions of the number of open channels and Ca2+ flux per channel. Considering that vesicle fusion (ΔCm) is proportional to the nth power of Ca2+ activity at release sites (Zucker and Fogelson, 1986), data were fitted by the equation ΔCm = g [QCa]N with N = 0.72 ± 0.02 (slope factor, g = 4.56 fF/pC; R2 = 0.97) and N = 0.90 ± 0.02 (g = 1.40 fF/pC; R2 = 0.99) in type I and type II hair cells, respectively, indicating an almost linear relationship between cumulative Ca2+ entry and exocytosis in both cell types and a more efficient process in type I hair cells (Fig. 7A,D). An N value of 0.72 indicates that the fitting curve is somewhat “convex,” which is likely attributable to the fact that, near the final QCa range, exocytosis almost reaches saturation in type I hair cells (Fig. 5A, inset). Our results thus suggest that the amount of exocytosis is a linear function of cumulative Ca2+ entry at the active zone both in type I and type II hair cells. This conclusion is compatible with the Ca2+ “shell domain” model in which diffusion of Ca2+ ions and intracellular Ca2+ buffers near the membrane are not free at the release site, then allowing saturation of the sensor and a linear increase of exocytosis with depolarization duration (Roberts 1994; Kits et al., 1999; Mansvelder and Kits, 2000).
Figure 7.

The synaptic transfer function (ΔCm/ICa) becomes less efficient and nonlinear in vestibular hair cells lacking otoferlin. A, D, Exocytosis as a power function of integrated Ca2+ entry when varying pulse duration (10, 25, 50, 100, and 200 ms) in type I (A) and type II (D) hair cells. Data were fit by the equation ΔCm = g [QCa]N with N = 0.72 ± 0.02 (slope efficiency, g = 4.56 fF/pC) and N = 0.90 ± 0.02 (g = 1.40) in wild-type type I (A, black open circles; n = 17) and type II (D, black open circles; n = 9) hair cells, respectively. In Otof−/− hair cells, data were fit with a nonlinear power function with N = 2.2 ± 0.10 (g = 0.02 ± 0.004) and N = 1.71 ± 0.03 (g = 0.07 ± 0.01) in type I (A) and type II (D; red filled circles; n = 14), respectively. In type I Otof−/− hair cells (A, red line), ΔCm responses are recorded in 5 mm [Ca2+]ext (red symbols; n = 19) and in 10 mm [Ca2+]ext (green symbols; n = 5). B, E, Synaptic transfer function when varying test potentials in type I (B) and type II (E, F) hair cells. ICa and corresponding ΔCm responses were recorded at different membrane potentials (500 ms voltage step from −80 mV in 10 mV increments) in 5 mm [Ca2+]ext. Solid lines are fits to data points according to a power function ΔCm = g [ICa]N with N = 0.83 ± 0.08 (g = 1.10 ± 0.30 fF/pA) and N = 0.85 ± 0.08 (g = 0.66 ± 0.19 fF/pA) in wild-type type I (B, black open circles and blue open circle at 0 mV; n = 14) and type II (E, black open circles from −80 to −10 mV and blue open circles from 0 to +20 mV; n = 8) hair cells, respectively. In Otof−/− hair cells (red filled circles), data were fitted using a nonlinear power function with N = 3.22 ± 0.71 (g = 1.48.10−5 ± 0.90.10−5 fF/pA; n = 13) and N = 2.10 ± 0.20 (g = 0.003 ± 0.001 fF/pA; n = 17) in type I and type II hair cells, respectively. F, Synaptic transfer function in type II hair cells when plotting ΔCm against ICa at positive potentials between −10 to +20 mV (from the same cells shown in E): data were fitted with a power function with N = 0.90 ± 0.16 (g = 0.45 ± 0.28 fF/pA; red line) in Otof−/− type II hair cells that was not significantly different from wild-type with N = 0.80 ± 0.24 (g = 0.79 ± 0.20; blue line). C, Synaptic transfer function in type I hair cells when varying [Ca2+]ext. ICa and corresponding ΔCm responses were obtained from a single 500 ms voltage step from −80 to −10 mV in different extracellular Ca2+ concentrations: 0, 1.3, 5, 10, and 20 mm in Otof−/− hair cells (red filled circles) and 0, 1.3, 5, and 10 mm in wild-type hair cells (black open circles). Each ΔCm and ICa values are means from 5 to 22 hair cells. Solid lines are fits to data points according to a power function with N = 0.97 ± 0.05 (g = 0.95 ± 0.20 fF/pA) and N = 3.38 ± 0.06 (g = 2.80 10−6 ± 0.70 10−6 fF/pA) in wild-type and Otof−/− type I hair cells, respectively.
In Otof−/− utricles, using a similar protocol, RRP exocytosis was completely abolished in type I hair cells (Figs. 5A, 7A, red symbols) and only partially reduced in type II hair cells (Fig. 7D). In Otof−/− type II hair cells, data were best fitted by using a power function with N = 1.71 ± 0.03 and a reduced slope factor g = 0.07 ± 0.01 fF/pC (Fig. 7D). Remarkably, RRP exocytosis in Otof−/− type I hair cells could be partially rescued when increasing [Ca2+]ext from 5 to 10 mm (Fig. 6A, green symbols). Data were then fitted using a power function with N = 2.20 ± 0.10 and a reduced slope factor g = 0.02 ± 0.004 fF/pC (Fig. 7A). These results suggest that either the Ca2+ affinity of the synaptic machinery is markedly decreased or the free diffusion of Ca2+ ions at the release sites is modified in such a way that the sensor is no longer saturated.
Linear dependence on ICa amplitude when varying the number of open channels and the Ca2+ flux per channel.
To further investigate the Ca2+ dependence of exocytosis in type I and type II hair cells, independently of stimulus duration, ΔCm responses were plotted against ICa peak amplitude for a constant 500 ms voltage step at different membrane potentials from −80 mV, in constant 5 mm [Ca2+]ext (Fig. 7B,E,F). To avoid underestimation of Ca2+ entry (QCa) by unblocked outward K+ current at large depolarizing potentials, exocytosis was here plotted against ICa peak amplitude. Data were again fitted by using a power function ΔCm = g [ICa]N, with ICa varying primarily as a function of open Ca2+ channels (number increasing with depolarization up to a maximum at −10 mV). Data were best fitted by a power function with N = 0.83 ± 0.08 (g = 1.10 ± 0.30 fF/pA) and N = 0.85 ± 0.08 (g = 0.66 ± 0.19 fF/pA) in type I and type II hair cells, respectively (Fig. 7B,E), indicating a linear relationship between Ca2+ entry and exocytosis when increasing the number of open Ca2+ channels.
The relationship between ICa and ΔCm was next examined when primarily manipulating the Ca2+ flux per channel. Although this relationship could not be examined at positive potentials in type I hair cells because ICa was obscured above 0 mV by the presence of an outward current (likely Cs+ flowing through gKL) (Rüsch et al., 1998), we found that ΔCm and ICa maintained a similar linear relationship between −10 and 0 mV. At these potentials, the number of open Ca2+ channels is constant and maximum; ICa thus mainly reflects Ca2+ flux per channel that depends on the driving force (Fig. 7B, blue circle). To overcome the problem of the outward current at positive potentials, the relationship between ΔCm and Ca2+ flux per channel was further examined in type I hair cells by using different [Ca2+]ext (0, 1.3, 5, and 10 mm) at constant and maximal voltage activation of Ca2+ channels (−10 mV) from a holding potential of −80 mV, for a 500 ms duration. Data were again approximated using a power function ΔCm = g [ICa]N, with ICa varying only as a function of the Ca2+ flux per channel at constant open channel probability. Using this protocol, the Ca2+ dependence of exocytosis showed again a linear relationship. Indeed, data were best fitted using a power function with N = 0.97 ± 0.05 and a slope factor g = 0.95 ± 0.20 fF/pA (Fig. 7C). Notably, a similar linear relationship was obtained when using shorter pulse durations of 50 or 100 ms (data not shown).
In type II hair cells, the Ca2+ dependence of ΔCm could be studied at positive potentials with no apparent outward contaminating current up to +20 mV. As in type I hair cells, ΔCm showed a linear relationship with ICa both for small depolarizations (the driving force for Ca2+ entry is large, whereas only few channels are opened) (Fig. 7E, black circles) and large depolarizations (the number of open channels is maximum above −10 mV, but the Ca2+ flux per channel decreases as the voltage increases) (Fig. 7E, blue circles).
Together, these results suggest that exocytosis in type I and type II hair cells is proportional to total Ca2+ entry, whatever the number of open channels and the Ca2+ flux per channel. This situation seems not to be compatible with an organization of independent Ca2+ nanodomains as proposed in cochlear inner hair cells, in which a change in the Ca2+ flux per channel is nonlinearly related to the ΔCm response (Brandt et al., 2005). Our data rather indicate a situation similar to the one described in frog saccular hair cells, in which it has been suggested that tens of Ca2+ channels cooperate in a large “Ca2+ domain” at each synaptic active zone (Roberts et al., 1990; Roberts, 1994).
Using a similar test potential, when primarily varying the number of open channels, data points in mutant type I hair cells were best fitted by using a power function with N = 3.22 ± 0.71 and a markedly reduced efficiency (Fig. 7B). When varying the Ca2+ flux per channel in various extracellular Ca2+ concentrations (0, 1.3, and 5 mm; 10 and 20 mm) at constant voltage and duration, Otof−/− type I hair cells also displayed a nonlinear relationship between ICa and ΔCm (N = 3.38 ± 0.06) and a markedly reduced Ca2+ efficiency (Fig. 7C).
In mutant type II hair cells, for small depolarizations between −80 and −10 mV (increasing open channel probability) data were best fitted by using a power function with N = 2.10 ± 0.20 and a markedly reduced efficiency of exocytosis compared with wild-type cells (Fig. 7E). Remarkably, for large depolarizations between −10 and +20 mV, i.e., at constant maximum open channel probability but decreasing Ca2+ flux per channel, the transfer function between ΔCm and ICa showed a linear dependence that was approximated by using a power function with N = 0.90 ± 0.16, which was not significantly different from wild type with N = 0.80 ± 0.24 (Fig. 7F).
These results show that, for small depolarizations, exocytosis in Otof−/− type I and type II hair cells cannot be approximated by a simple linear transfer function of summed Ca2+ entry. In the absence of otoferlin, exocytosis is much less efficient and functions in a cooperative way.
Sensitivity of exocytosis to internal Ca2+ buffering.
The comparative ability of intracellular BAPTA and EGTA to block Ca2+-triggered events is also a way to address the spatial organization of the Ca2+ channels and the Ca2+ sensor (Augustine et al., 2003). The two buffers have a similar equilibrium affinity for Ca2+, but BAPTA displays a 10 times faster rate for Ca2+ binding than EGTA. Therefore, BAPTA is expected to block Ca2+ action within nanodomains, whereas EGTA would only limit intracellular Ca2+ spread in microdomains. An equal BAPTA/EGTA efficacy to block exocytosis would implicate primarily diffused Ca2+ signals such the calyx of Held synapse (Augustine et al., 2003). In wild-type type I hair cells, we found that exocytosis during a 500 ms pulse depolarization from a holding potential of −80 to −10 mV was completely blocked by 5 mm BAPTA (n = 4) but unaffected with 5 mm EGTA (n = 5) (Fig. 6B). Furthermore, tested in similar conditions, 5 mm EGTA did not block exocytosis responses in wild-type and Otof−/− type II hair cells (n = 2; data not shown). These results suggest that the Ca2+ channels are located at a nanometer-sized distance from the release sites in vestibular hair cells.
Vestibular hair cells of Otof−/− mice display morphologically normal ribbon synapses
We examined whether otoferlin is produced by the two types of vestibular hair cells and whether there are synaptic structural defects in hair cells lacking otoferlin that could explain the above-mentioned abnormal exocytosis in these cells. Double-immunolabeling study, using otoferlin and β-tubulin antibodies to label the hair cells and their afferent nerve endings, respectively, showed similar otoferlin distribution in type I and type II hair cells from the P7 mouse utricle (Fig. 8A–C), saccule, and semicircular canals (data not shown). Notably, otoferlin was detected throughout the cytoplasm from the cuticular plate to the basal synaptic region as reported for cochlear hair cells (Roux et al., 2006). Similar distribution has been reported in cochlear hair cells for the SNARE proteins SNAP25 and syntaxin1 (Safieddine and Wenthold, 1999). These findings are consistent with the proposal according to which the apical part of the hair cells is also involved in vesicle resupply of the ribbon synapse during long stimulations (Griesinger et al., 2005).
Figure 8.

Otoferlin expression in the mouse utricle. A–C, Confocal fluorescence microscopy images of a P7 mouse utricle double stained for otoferlin (A) and β-tubulin III (B). Tubulin labels the nerve calyx surrounding type I hair cells. The merged image in C shows otoferlin labeling in a type I hair cell (surrounded by a calyx) and a type II hair cells (no surrounding calyx). D, Transmission electron microscopy showing the two types of hair cells in an adult mouse utricle. E, Postembedding immunogold electron microscopy of a section made in a type I hair cell from a P6 mouse utricle, using an anti-otoferlin antibody. Several gold particles are seen around the ribbon (arrowhead) facing the calyx of the afferent neuron. The inset at the top right shows another otoferlin labeling example in which several gold particles are associated with ribbon vesicles and attached to the presynaptic membrane.
Postembedding immunogold electron microscopy showed that, just like in cochlear hair cells (Roux et al., 2006), otoferlin is located at the synaptic active zone of vestibular hair cells, including synaptic vesicles and the presynaptic plasma membrane (Fig. 8E). In the three ribbon-containing active zones analyzed in type I hair cells from P6 mouse utricles, we found that the gold particles were mainly associated with the presynaptic plasma membrane and the vesicles attached to the ribbon. Gold particles were also observed at extrasynaptic zones on the endoplasmic reticulum and Golgi apparatus of the hair cells (data not shown).
Next, we performed a comparative analysis of the ribbon synapse ultrastructure by electron microscopy in vestibular hair cells of P6 wild-type and mutant mice. In both genotypes, we found that type I and type II hair cells have typical ribbon synapses with a distinct postsynaptic density and presynaptic thickening that is marked with a ribbon decorated with synaptic vesicles (Fig. 9) (supplemental Fig. S1, available at www.jneurosci.org as supplemental material). Quantification of the size of the active zones did not show any difference between otoferlin-deficient vestibular synapses and their littermate wild-type controls (197 ± 10 nm, n = 25 vs 206 ± 12 nm, n = 31; p > 0.05). The number of vesicles associated to the ribbon anchored at the synaptic active zone was also not significantly different (12 ± 0.7 and 15 ± 1.0 in mutant and controls, respectively; p > 0.05). Two to three vesicles were on average seen docked to the presynaptic plasma membrane below the ribbon, in both wild-type and mutant synapses.
A double-staining experiment using antibodies against CtBP2 and GluR2/3 to label the ribbon and postsynaptic terminal, respectively (Roux et al., 2006), showed similar GluR2/3 expression in Otof−/− and wild-type utricles (supplemental Fig. S2, available at www.jneurosci.org as supplemental material). In addition, double staining using antibodies against myosin VIIA and CtBP2 to label the hair cell soma and the ribbons, respectively, did not show any significant difference in the number of ribbons per hair cell between mutant and wild-type hair cells from the central area of the utricle, regardless of the cell type (9 ± 0.8, n = 63 vs 7 ± 1.7, n = 56, respectively; p > 0.05) (supplemental Fig. S3, available at www.jneurosci.org as supplemental material).
Together, these results suggest that synaptic formation and assembly proceed normally in the vestibular hair cells of Otof−/− mice, as reported for cochlear hair cells (Roux et al., 2006). Furthermore, our observation that the numbers of vesicles tethered to the ribbon and docked to the presynaptic plasma membrane are not different between wild-type and mutant mice indicates that neither the biogenesis nor the docking processes of synaptic vesicles are compromised in the mutants. This is consistent with a previous report involving otoferlin in a step downstream from the docking step of synaptic vesicles to the plasma membrane (Roux et al., 2006).
Discussion
Otoferlin is not essential for spontaneous synaptic activity
The spontaneous postsynaptic firing activity that was recorded at the afferent calyx endings of vestibular hair cells from Otof−/− mice led us to draw two main conclusions. First, normal spontaneous vesicular release is taking place at the hair cell synapse lacking otoferlin, which is consistent with the morphologically normal synapses observed in these mice. Second, otoferlin is not essential for the associated hair cell synaptic vesicle priming or fusion. In addition, residual evoked vestibular potentials and Ca2+-dependent exocytosis were observed in Otof−/− hair cells, indicating that, if otoferlin is a Ca2+ sensor, another one is present in these vestibular mutant hair cells. Such a configuration has already been reported in neuronal synapses and adrenal chromaffin cells in which different Ca2+ sensors may coexist (Xu et al., 2007; Schonn et al., 2008). Because mature hair cells, unlike neurons, do not fire spontaneous action potential, spontaneous transmitter release could involve low voltage-activated Ca2+ channels such as Cav3.1 T-type channels (Nie et al., 2008) that can be readily activated near resting membrane potential. The mechanisms of otoferlin-independent vesicular release that drives spontaneous activity in vestibular hair cells remain be elucidated.
Type I hair cells display exocytosis with faster kinetics and higher Ca2+ sensitivity than type II hair cells
To further explore the cause of the defective VsEPs transfer function in Otof−/− mice, we set up to investigate for the first time the mechanisms of Ca2+-dependent exocytosis in mammalian vestibular hair cells. We first established that type I hair cells in wild-type mice display L-type Ca2+ currents activating a fast (RRP) and slow (SRP) phase of exocytosis resembling those previously described in mammalian cochlear hair cells (Moser and Beutner 2000; Johnson et al., 2005; Beurg et al., 2008) and lower vertebrate hair cells (Parsons et al., 1994; Edmonds et al., 2004; Schnee et al., 2005). We found that the RRP exocytosis of type I hair cells displayed activation kinetics (τ = 34 ms) comparable with that of cochlear hair cells (τ = 53 ms) but a lower release rate of 110 versus 459 fF/s (Johnson et al., 2005). However, the release rates become similar when normalized to the number of synaptic ribbons, which is approximately two to four times higher in cochlear inner hair cells than in vestibular hair cells (Roux et al., 2006; Johnson et al., 2008). Together, our results indicate that Ca2+-dependent exocytosis of type I hair cells shares similar characteristics with mature cochlear hair cells in terms of kinetics, Ca2+ sensitivity, and linear Ca2+ dependence.
Exocytosis in type II hair cells displayed slower kinetics and reduced Ca2+ efficiency compared with type I hair cells. Differences in exocytosis have also been found in the photoreceptors of the retina, with cones showing 10-fold faster kinetics than rods (Rabl et al., 2005), but also between immature and mature cochlear hair cells (Johnson et al., 2005) and between low- and high-frequency gerbil cochlear hair cells (Johnson et al., 2008). Many different factors can influence synaptic exocytosis, such as the presence of different Ca2+ mobile buffers and differences in the intrinsic Ca2+ affinity of the Ca2+ sensor itself (Thoreson, 2007). The implication of several Ca2+-sensing mechanisms, the combination of which could specify the different kinetics of type I and type II vestibular hair cells as reported in the calyx of Held synapse and in adrenal chromaffin cells (Sun et al., 2007; Schonn et al., 2008), should be considered in future studies.
The role of otoferlin in the linear Ca2+ dependence of exocytosis in vestibular hair cells
We found that exocytosis in wild-type vestibular hair cells displays a remarkable linear Ca2+ dependence when changing Ca2+ entry, by either varying the extracellular Ca2+ concentration, while stepping to different test potentials, or depolarizing the cell for different durations. A similar linear relationship between exocytosis and Ca2+ entry has been obtained in mature cochlear inner hair cells (Moser and Beutner, 2000; Johnson et al., 2005, 2008; Beurg et al., 2008) and in hair cells from the turtle auditory papilla (Schnee et al., 2005).
Experiments with flash photolysis of intracellular caged Ca2+, which directly probe the intrinsic affinity of the Ca2+ sensor (independently of Ca2+ channels), have shown that cochlear inner hair cell exocytosis displays a fifth-order Ca2+cooperativity in the low micromolar range of Ca2+ concentrations and becomes almost linear above 10 μm (Beutner et al., 2001). How is it possible that the Ca2+ sensor has an intrinsic cooperative Ca2+ dependence, whereas exocytosis translates into a linear relation with Ca2+ entry during depolarization? The most likely explanation is that, during voltage activation of Ca2+ channels, the Ca2+ concentration at the release sites instantaneously saturates the Ca2+ sensor. The use of Ca2+-activated K+ channels has indeed indicated that the Ca2+ concentration instantaneously rises as much as several hundred micromolar at the active zone of frog saccular hair cells during depolarization (Roberts et al., 1990). In cochlear inner hair cells, the Ca2+ dependence of exocytosis or transmitter release has been shown to be linear when varying the number of open Ca2+ channels and to be highly cooperative when changing the single-channel current (Brandt et al., 2005; Goutman and Glowatzki, 2007). This behavior is compatible with an organization of independent (nonoverlapping) Ca2+ nanodomains, in which the activity of one or few Ca2+ channels is sufficient to activate release of a nearby vesicle (Zucker and Stockbridge, 1983; Zucker and Fogelson, 1986; Augustine, 1990). In contrast, we found here that exocytosis in vestibular type I and type II hair cells is linearly related to cumulative Ca2+ entry, whatever the respective contributions of the Ca2+ channel open probability and Ca2+ flux per channel, which is suggestive of a microdomain-like organization (Engisch and Nowycky, 1996; Mansvelder and Kits, 2000). However, the high BAPTA efficacy relative to the EGTA to block exocytosis in vestibular hair cells argues for a nanometer-sized distance between the calcium sensor and the Ca2+ channels. Moreover, the active zone of vestibular hair cells has an “intrinsic nanometric size” with a diameter of ∼200 nm, which might contain as many as 60 Ca2+ channels (our estimation). In goldfish or frog saccular hair cells, freeze-fracture electron-microscopy observations of the synaptic active zone have shown the presence of orderly parallel arrays of particles (Hama, 1980; Roberts et al., 1990; Roberts, 1994). These arrays of particles have been suggested to reflect the organization of structures that align ∼90 Ca2+ channels below the ribbon and where between the rows of particles are possibly located, within <50 nm, the vesicle attachment sites for synaptic release. Roberts (1994) suggested that such an organization in arrays would bring Ca2+ channels close together and allow Ca2+ activity from different channels to overlap to reach micromolar concentrations at the release sites. Our results, suggesting a cumulative effect of individual Ca2+ currents on exocytosis, are compatible with such a spatial organization of the Ca2+ channels and release site at the synaptic zone of mammalian vestibular hair cells.
The mutant hair cells showed a reduced exocytosis with a nonlinear Ca2+ dependence that is likely related to the intrinsic cooperativity of the synaptic machinery. In Otof−/− type II hair cells, the early rapid phase of exocytosis was less efficient and nonlinearly related to Ca2+ when we varied the number of open Ca2+ channels during small depolarizations, whereas the response became linear when only varying the Ca2+ flux per channel at maximum open channel probability. The “hysteresis” in the curve relating exocytosis to Ca2+ influx is compatible with a cooperative recruitment of Ca2+ domains at small depolarizations in the absence of otoferlin. The results suggest that otoferlin, which can interact with L-type Cav1.3 Ca2+ channels and SNARE proteins (Roux et al., 2006; Ramakrishnan et al., 2009), works as a high-affinity Ca2+ sensor that allows linearity at low Ca2+ level. The possibility that several calcium-sensing mechanisms underlie the synaptic exocytosis of vestibular hair cells should also be considered. These mechanisms may involve a high-affinity Ca2+-sensing machinery that involves otoferlin (QCa below 5 pC) and a nonlinear low-affinity calcium-sensing machinery (QCa above 5 pC). Alternatively, otoferlin may not be the final sensor but be required for the formation of a sensitive, readily saturated, Ca2+-sensing synaptic machinery.
Physiological significance of a linear synaptic transfer at the first synapse in the vestibular pathway
A linear Ca2+ dependence of transmitter release at the first synapse in the vestibular pathway is certainly essential for an efficient and precise transmission, without distortion, of small sensory signals into the brainstem circuitry of the vestibular ocular reflex. Interestingly, the first central synapse of the vestibular system also displays a remarkable linear relationship between the rate of stimulation of the vestibular afferents and the synaptic charge transfer in postsynaptic vestibular nucleus neurons (Bagnall et al., 2008). The lack of short-term dynamics, facilitation or depression, at these central synapses seems an important feature to ensure linearity. Our findings suggest that the remarkable characteristics of the vestibular system, its temporal precision, sensitivity, and wide dynamic range, first rely on a linear transmission at the hair cell synapse, with otoferlin being critical for exocytosis to achieve a highly sensitive linear Ca2+ dependence.
Footnotes
This work was supported by National Institutes of Health Grant ROI DCOD6443 (S.M.J.), European Commission FP6 Integrated Project EuroHear Grant LSHG-CT-2004-512063 (C.P.), Agence Nationale de la Recherche Grant ANR-07-Neuro-036-01 (S.S.), and the Fondation Voir et Entendre (D.D.). We thank Emilie Hoang Dinh, Yohan Bouleau, Bruce Mock, and Isabelle Roux for their assistance in some of the experiments, Tim Jones and Maryline Beurg for helpful discussion, and Jean-Pierre Hardelin for critical reading of this manuscript. We thank Pierre Costet for raising the mouse colony at Bordeaux 2 university.
References
- Almanza A, Vega R, Soto E. Ca2+ current in type I hair cells isolated from the semicircular canal crista ampullaris of the rat. Brain Res. 2003;994:175–180. doi: 10.1016/j.brainres.2003.09.033. [DOI] [PubMed] [Google Scholar]
- Augustine GJ. Regulation of transmitter release at the squid giant synapse by presynaptic delayed rectifier potassium current. J Physiol. 1990;431:343–364. doi: 10.1113/jphysiol.1990.sp018333. [DOI] [PMC free article] [PubMed] [Google Scholar]
- Augustine GJ, Santamaria F, Tanaka K. Local calcium signaling in neurons. Neuron. 2003;40:331–346. doi: 10.1016/s0896-6273(03)00639-1. [DOI] [PubMed] [Google Scholar]
- Bagnall MW, McElvain LE, Faulstich M, du Lac S. Frequency-independent synaptic transmission supports a linear vestibular behavior. Neuron. 2008;60:343–352. doi: 10.1016/j.neuron.2008.10.002. [DOI] [PMC free article] [PubMed] [Google Scholar]
- Bao H, Wong WH, Goldberg JM, Eatock RA. Voltage-gated calcium channel currents in type I and type II hair cells isolated from the rat crista. J Neurophysiol. 2003;90:155–164. doi: 10.1152/jn.00244.2003. [DOI] [PubMed] [Google Scholar]
- Beurg M, Safieddine S, Roux I, Bouleau Y, Petit C, Dulon D. Calcium- and otoferlin-dependent exocytosis by immature outer hair cells. J Neurosci. 2008;28:1798–1803. doi: 10.1523/JNEUROSCI.4653-07.2008. [DOI] [PMC free article] [PubMed] [Google Scholar]
- Beutner D, Voets T, Neher E, Moser T. Calcium dependence of exocytosis and endocytosis at the cochlear inner hair cell afferent synapse. Neuron. 2001;29:681–690. doi: 10.1016/s0896-6273(01)00243-4. [DOI] [PubMed] [Google Scholar]
- Brandt A, Khimich D, Moser T. Few CaV1.3 channels regulate the exocytosis of a synaptic vesicle at the hair cell ribbon synapse. J Neurosci. 2005;25:11577–11585. doi: 10.1523/JNEUROSCI.3411-05.2005. [DOI] [PMC free article] [PubMed] [Google Scholar]
- Dou H, Vazquez AE, Namkung Y, Chu H, Cardell EL, Nie L, Parson S, Shin HS, Yamoah EN. Null mutation of α1D Ca2+ channel gene results in deafness but no vestibular defect in mice. J Assoc Res Otolaryngol. 2004;5:215–226. doi: 10.1007/s10162-003-4020-3. [DOI] [PMC free article] [PubMed] [Google Scholar]
- Eatock RA, Xue J, Kalluri R. Ion channels in mammalian vestibular afferents may set regularity of firing. J Exp Biol. 2008;211:1764–1774. doi: 10.1242/jeb.017350. [DOI] [PMC free article] [PubMed] [Google Scholar]
- Edmonds BW, Gregory FD, Schweizer FE. Evidence that fast exocytosis can be predominantly mediated by vesicles not docked at active zones in frog saccular hair cells. J Physiol. 2004;560:439–450. doi: 10.1113/jphysiol.2004.066035. [DOI] [PMC free article] [PubMed] [Google Scholar]
- Engisch KL, Nowycky MC. Calcium dependence of large dense-cored vesicle exocytosis evoked by calcium influx in bovine adrenal chromaffin cells. J Neurosci. 1996;16:1359–1369. doi: 10.1523/JNEUROSCI.16-04-01359.1996. [DOI] [PMC free article] [PubMed] [Google Scholar]
- Glowatzki E, Fuchs PA. Transmitter release at the hair cell ribbon synapse. Nat Neurosci. 2002;5:147–154. doi: 10.1038/nn796. [DOI] [PubMed] [Google Scholar]
- Goldberg JM. The vestibular end organs: morphological and physiological diversity of afferents. Curr Opin Neurobiol. 1991;1:229–235. doi: 10.1016/0959-4388(91)90083-j. [DOI] [PubMed] [Google Scholar]
- Goldberg JM. Theoretical analysis of intercellular communication between the vestibular type I hair cell and its calyx ending. J Neurophysiol. 1996;76:1942–1957. doi: 10.1152/jn.1996.76.3.1942. [DOI] [PubMed] [Google Scholar]
- Goldberg JM, Fernandez C. Physiology of peripheral neurons innervating semicircular canals of the squirrel monkey. I. Resting discharge and response to constant angular accelerations. J Neurophysiol. 1971;34:635–660. doi: 10.1152/jn.1971.34.4.635. [DOI] [PubMed] [Google Scholar]
- Goutman JD, Glowatzki E. Time course and calcium dependence of transmitter release at a single ribbon synapse. Proc Natl Acad Sci U S A. 2007;104:16341–16346. doi: 10.1073/pnas.0705756104. [DOI] [PMC free article] [PubMed] [Google Scholar]
- Grant L, Fuchs P. Calcium- and calmodulin-dependent inactivation of calcium channels in inner hair cells of the rat cochlea. J Neurophysiol. 2008;99:2183–2193. doi: 10.1152/jn.01174.2007. [DOI] [PubMed] [Google Scholar]
- Griesinger CB, Richards CD, Ashmore JF. Fast vesicle replenishment allows indefatigable signalling at the first auditory synapse. Nature. 2005;435:212–215. doi: 10.1038/nature03567. [DOI] [PubMed] [Google Scholar]
- Hama K. Fine structure of the afferent synapse and gap junctions on the sensory hair cell in the saccular macula of goldfish: a freeze-fracture study. J Neurocytol. 1980;9:845–860. doi: 10.1007/BF01205023. [DOI] [PubMed] [Google Scholar]
- Hullar TE, Minor LB. High-frequency dynamics of regularly discharging canal afferents provide a linear signal for angular vestibuloocular reflexes. J Neurophysiol. 1999;82:2000–2005. doi: 10.1152/jn.1999.82.4.2000. [DOI] [PubMed] [Google Scholar]
- Huterer M, Cullen KE. Vestibuloocular reflex dynamics during high-frequency and high-acceleration rotations of the head on body in rhesus monkey. J Neurophysiol. 2002;88:13–28. doi: 10.1152/jn.2002.88.1.13. [DOI] [PubMed] [Google Scholar]
- Johnson SL, Thomas MV, Kros CJ. Membrane capacitance measurement using patch clamp with integrated self-balancing lock-in amplifier. Pflugers Arch. 2002;443:653–663. doi: 10.1007/s00424-001-0763-z. [DOI] [PubMed] [Google Scholar]
- Johnson SL, Marcotti W, Kros CJ. Increase in efficiency and reduction in Ca2+ dependence of exocytosis during development of mouse inner hair cells. J Physiol. 2005;563:177–191. doi: 10.1113/jphysiol.2004.074740. [DOI] [PMC free article] [PubMed] [Google Scholar]
- Johnson SL, Forge A, Knipper M, Münkner S, Marcotti W. Tonotopic variation in the calcium dependence of neurotransmitter release and vesicle pool replenishment at mammalian auditory ribbon synapses. J Neurosci. 2008;28:7670–7678. doi: 10.1523/JNEUROSCI.0785-08.2008. [DOI] [PMC free article] [PubMed] [Google Scholar]
- Jones SM, Erway LC, Bergstrom RA, Schimenti JC, Jones TA. Vestibular responses to linear acceleration are absent in otoconia-deficient C57BL/6JEi-het mice. Hear Res. 1999;135:56–60. doi: 10.1016/s0378-5955(99)00090-8. [DOI] [PubMed] [Google Scholar]
- Jones SM, Jones TA, Johnson KR, Yu H, Erway LC, Zheng QY. A comparison of vestibular and auditory phenotypes in inbred mouse strains. Brain Res. 2006;1091:40–46. doi: 10.1016/j.brainres.2006.01.066. [DOI] [PMC free article] [PubMed] [Google Scholar]
- Keen EC, Hudspeth AJ. Transfer characteristics of the hair cells' afferent synapse. Proc Natl Acad Sci U S A. 2006;103:5537–5542. doi: 10.1073/pnas.0601103103. [DOI] [PMC free article] [PubMed] [Google Scholar]
- Khimich D, Nouvian R, Pujol R, Tom Dieck S, Egner A, Gundelfinger ED, Moser T. Hair cell synaptic ribbons are essential for synchronous auditory signalling. Nature. 2005;434:889–894. doi: 10.1038/nature03418. [DOI] [PubMed] [Google Scholar]
- Kits KS, de Vlieger TA, Kooi BW, Mansvelder HD. Diffusion barriers limit the effect of mobile calcium buffers on exocytosis of large dense cored vesicles. Biophys J. 1999;76:1693–1705. doi: 10.1016/S0006-3495(99)77328-5. [DOI] [PMC free article] [PubMed] [Google Scholar]
- Lee HY, Camp AJ, Callister RJ, Brichta AM. Vestibular primary afferent activity in an in vitro preparation of the mouse inner ear. J Neurosci Methods. 2005;145:73–87. doi: 10.1016/j.jneumeth.2004.11.021. [DOI] [PubMed] [Google Scholar]
- Lenzi D, Runyeon JW, Crum J, Ellisman MH, Roberts WM. Synaptic vesicle populations in saccular hair cells reconstructed by electron tomography. J Neurosci. 1999;19:119–132. doi: 10.1523/JNEUROSCI.19-01-00119.1999. [DOI] [PMC free article] [PubMed] [Google Scholar]
- Longo-Guess C, Gagnon LH, Bergstrom DE, Johnson KR. A missense mutation in the conserved C2B domain of otoferlin causes deafness in a new mouse model of DFNB9. Hear Res. 2007;234:21–28. doi: 10.1016/j.heares.2007.09.005. [DOI] [PMC free article] [PubMed] [Google Scholar]
- Mansvelder HD, Kits KS. All classes of calcium channel couple with equal efficiency to exocytosis in rat melanotropes, inducing linear stimulus-secretion coupling. J Physiol. 2000;526:327–339. doi: 10.1111/j.1469-7793.2000.t01-1-00327.x. [DOI] [PMC free article] [PubMed] [Google Scholar]
- Meyer AC, Frank T, Khimich D, Hoch G, Riedel D, Chapochnikov NM, Yarin YM, Harke B, Hell SW, Egner A, Moser T. Tuning of synapse number, structure and function in the cochlea. Nat Neurosci. 2009;12:444–453. doi: 10.1038/nn.2293. [DOI] [PubMed] [Google Scholar]
- Moser T, Beutner D. Kinetics of exocytosis and endocytoiss at the cohlear inner hair cell afferent synapse of the mouse. Proc Natl Acad Sci U S A. 2000;97:883–888. doi: 10.1073/pnas.97.2.883. [DOI] [PMC free article] [PubMed] [Google Scholar]
- Nazareth AM, Jones TA. Peripheral and central components of short latency vestibular evoked potentials. J Vestib Res. 1998;8:233–252. [PubMed] [Google Scholar]
- Nie L, Zhu J, Gratton MA, Liao A, Mu KJ, Nonner W, Richardson GP, Yamoah EN. Molecular identity and functional properties of a novel T-type Ca2+ channel cloned from the sensory epithelia of the mouse inner ear. J Neurophysiol. 2008;100:2287–2299. doi: 10.1152/jn.90707.2008. [DOI] [PMC free article] [PubMed] [Google Scholar]
- Nouvian R, Beutner D, Parsons TD, Moser T. Structure and function of the hair cell ribbon synapse. J Membr Biol. 2006;209:153–165. doi: 10.1007/s00232-005-0854-4. [DOI] [PMC free article] [PubMed] [Google Scholar]
- Parsons TD, Lenzi D, Almers W, Roberts WM. Calcium-triggered exocytosis and endocytosis in an isolated presynaptic cell: capacitance measurements in saccular hair cells. Neuron. 1994;13:875–883. doi: 10.1016/0896-6273(94)90253-4. [DOI] [PubMed] [Google Scholar]
- Rabl K, Cadetti L, Thoreson WB. Kinetics of exocytosis is faster in cones than in rods. J Neurosci. 2005;25:4633–4640. doi: 10.1523/JNEUROSCI.4298-04.2005. [DOI] [PMC free article] [PubMed] [Google Scholar]
- Ramakrishnan NA, Drescher MJ, Barretto RL, Beisel KW, Hatfield JS, Drescher DG. Direct interaction of otferlin with syntaxin 1A, SNAP-25, and the L-type voltage calcium channel Cav1.3. J Biol Chem. 2009;284:3227–3238. doi: 10.1074/jbc.M803605200. [DOI] [PMC free article] [PubMed] [Google Scholar]
- Roberts WM. Localization of calcium signals by a mobile calcium buffer in frog saccular hair cells. J Neurosci. 1994;14:3246–3262. doi: 10.1523/JNEUROSCI.14-05-03246.1994. [DOI] [PMC free article] [PubMed] [Google Scholar]
- Roberts WM, Jacobs RA, Hudspeth AJ. Colocalization of ion channels involved in frequency selectivity and synaptic transmission at presynaptic active zones of hair cells. J Neurosci. 1990;10:3664–3684. doi: 10.1523/JNEUROSCI.10-11-03664.1990. [DOI] [PMC free article] [PubMed] [Google Scholar]
- Roux I, Safieddine S, Nouvian R, Grati M, Simmler MC, Bahloul A, Perfettini I, Le Gall M, Rostaing P, Hamard G, Triller A, Avan P, Moser T, Petit C. Otoferlin, defective in a human deafness form, is essential for exocytosis at the auditory ribbon synapse. Cell. 2006;127:277–289. doi: 10.1016/j.cell.2006.08.040. [DOI] [PubMed] [Google Scholar]
- Rüsch A, Lysakowski A, Eatock RA. Postnatal development of type I and type II hair cells in the mouse utricle: acquisition of voltage-gated conductances and differentiated morphology. J Neurosci. 1998;18:7487–7501. doi: 10.1523/JNEUROSCI.18-18-07487.1998. [DOI] [PMC free article] [PubMed] [Google Scholar]
- Safieddine S, Wenthold RJ. SNARE complex at the ribbon synapses of cochlear hair cells: analysis of synaptic vesicle- and synaptic membrane-associated proteins. Eur J Neurosci. 1999;11:803–812. doi: 10.1046/j.1460-9568.1999.00487.x. [DOI] [PubMed] [Google Scholar]
- Schnee ME, Lawton DM, Furness DN, Benke TA, Ricci AJ. Auditory hair cell-afferent fiber synapses are specialized to operate at their best frequencies. Neuron. 2005;47:243–254. doi: 10.1016/j.neuron.2005.06.004. [DOI] [PubMed] [Google Scholar]
- Schonn JS, Maximov A, Lao Y, Südhof TC, Sørensen JB. Synaptotagmin-1 and -7 are functionally overlapping Ca2+ sensors for exocytosis in adrenal chromaffin cells. Proc Natl Acad Sci U S A. 2008;105:3998–4003. doi: 10.1073/pnas.0712373105. [DOI] [PMC free article] [PubMed] [Google Scholar]
- Schug N, Braig C, Zimmermann U, Engel J, Winter H, Ruth P, Blin N, Pfister M, Kalbacher H, Knipper M. Differential expression of otoferlin in brain, vestibular system, immature and mature cochea of the rat. Eur J Neurosci. 2006;24:3372–3380. doi: 10.1111/j.1460-9568.2006.05225.x. [DOI] [PubMed] [Google Scholar]
- Schwander M, Sczaniecka A, Grillet N, Bailey JS, Avenarius M, Najmabadi H, Steffy BM, Federe GC, Lagler EA, Banan R, Hice R, Grabowski-Boase L, Keithley EM, Ryan AF, Housley GD, Wiltshire T, Smith RJ, Tarantino LM, Müller U. A forward genetics screen in mice identifies recessive deafness traits and reveals that pejvakin is essential for outer hair cell function. J Neurosci. 2007;27:2163–2175. doi: 10.1523/JNEUROSCI.4975-06.2007. [DOI] [PMC free article] [PubMed] [Google Scholar]
- Sun J, Pang ZP, Qin D, Fahim AT, Adachi R, Südhof TC. A dual-Ca2+-sensor model for neurotransmitter release in a central synapse. Nature. 2007;450:676–682. doi: 10.1038/nature06308. [DOI] [PMC free article] [PubMed] [Google Scholar]
- Thoreson WB. Kinetics of synaptic transmission at ribbon synapses of rods and cones. Mol Neurobiol. 2007;36:205–223. doi: 10.1007/s12035-007-0019-9. [DOI] [PMC free article] [PubMed] [Google Scholar]
- Xu J, Mashimo T, Südhof TC. Synaptotagmin-1, -2, and -9: Ca2+ sensors for fast release that specify distinct presynaptic properties in subsets of neurons. Neuron. 2007;54:567–581. doi: 10.1016/j.neuron.2007.05.004. [DOI] [PubMed] [Google Scholar]
- Yang PS, Alseikhan BA, Hiel H, Grant L, Mori MX, Yang W, Fuchs PA, Yue DT. Switching of Ca2+-dependent inactivation of Cav 1.3 channels by calcium binding proteins of auditory hair cells. J Neurosci. 2006;26:10677–10689. doi: 10.1523/JNEUROSCI.3236-06.2006. [DOI] [PMC free article] [PubMed] [Google Scholar]
- Yasunaga S, Grati M, Cohen-Salmon M, El-Amraoui A, Mustapha M, Salem N, El-Zir E, Loiselet J, Petit C. A mutation in OTOF, encoding otoferlin, a FER-1-like protein, causes DFNB9, a nonsyndromic form of deafness. Nat Genet. 1999;21:363–369. doi: 10.1038/7693. [DOI] [PubMed] [Google Scholar]
- Zucker RS, Fogelson AL. Relationship between transmitter release and presynaptic calcium influx when calcium enters through discrete channels. Proc Natl Acad Sci U S A. 1986;83:3032–3036. doi: 10.1073/pnas.83.9.3032. [DOI] [PMC free article] [PubMed] [Google Scholar]
- Zucker RS, Stockbridge N. Presynaptic calcium diffusion and the time courses of transmitter release and synaptic facilitation at the squid giant synapse. J Neurosci. 1983;3:1263–1269. doi: 10.1523/JNEUROSCI.03-06-01263.1983. [DOI] [PMC free article] [PubMed] [Google Scholar]