Abstract
Elevated homocysteine levels are defined as hyperhomocysteinemia (HHcy), a disorder that is associated with cardiovascular and neurodegenerative diseases as well as with hepatic fibrosis. Recent studies have shown that HHcy promotes hepatic injury by increasing oxidative stress. Although homocysteine induces cell cycle arrest in a variety of different cell types, it is not known whether HHcy has a definitive role in hepatocyte proliferation during liver regeneration. In this report, we investigated the effect of homocysteine on liver regeneration. Our results demonstrated that mice with HHcy exhibited an impairment in liver regeneration after partial hepatectomy, as measured by immunohistochemical staining of proliferation cell nuclear antigen and bromodeoxyuridine incorporation. Impaired proliferation was also correlated with reduced cyclin D1 induction and elevated expression levels of both p53 and p21Cip1. In addition, the phosphorylation of Akt, which plays an essential role in normal regeneration responses, was attenuated during the early phases of liver regeneration in HHcy mice. Our results also indicated that the cAMP/protein kinase A pathway mediated the inhibitory effect of homocysteine on liver regeneration. These findings provide evidence that impairment of liver regeneration by HHcy may result in delayed recovery from liver injury induced by homocysteine itself.
Although hepatocytes are quiescent and rarely replicate in the normal adult liver, they are able to reenter the cell cycle and proliferate after liver damage caused by ischemia, chemical compounds, or hepatitis.1 In rodents, the original liver mass is restored approximately 7 to 10 days after 70% partial hepatectomy (PH), with a peak in DNA synthesis at approximately 40 to 44 hours.2 Impaired liver regeneration can be an important clinical complication of the pathogenesis of liver failure, cirrhosis, severe steatosis, and primary liver cancer.1,3 Accumulated evidence has demonstrated that liver regeneration is impaired in a number of animal models of fatty liver disease.4,5,6,7
Homocysteine is formed as an intermediate in sulfur amino acid metabolism. Elevated levels of circulating homocysteine, a condition known as hyperhomocysteinemia (HHcy), are correlated with cardiovascular, neurodegenerative diseases, and hepatic fibrosis.8,9,10,11 One of the mechanisms underlying homocysteine-mediated organ dysfunction results from induction of cell cycle arrest, apoptosis, and cell injury.12,13,14 Liver plays a central role in homocysteine metabolism. Impaired liver function has been associated with elevated plasma levels of homocysteine. For instance, elevation of homocysteine due to an insult in homocysteine metabolism is observed in patients with hepatic steatosis, cirrhosis, and chronic alcohol consumption.15,16 On the other hand, homocysteine has been shown to enhance hepatic lipid metabolism via the transcription factor, sterol regulatory element-binding protein-1.17,18,19 Patients with HHcy due to methylenetetrahydrofolate reductase C677T polymorphism develop hepatic steatosis and fibrosis.20 In addition, two recent studies have demonstrated that HHcy in cystathionine β-synthase-deficient mice and mice fed with methionine promotes oxidative stress, leading to liver injury.11,21
Because HHcy induces hepatic steatosis, we hypothesized that it could impair the regenerative response to liver injury. To test this hypothesis, we investigated the effect of homocysteine on liver regeneration. Our results reveal that homocysteine impairs hepatocyte proliferation after PH.
Materials and Methods
Induction of HHcy
Adult BALB/c mice were obtained from Baiyao Pharmacological Co. (Kunming, China). The animals were fed one of two diets: i) control diet (LM-485 chow, Harlan Teklad, Madison, WI) or ii) high-methionine diet (LM-485 chow with drinking water supplemented with 2% l-methionine). Mice were sacrificed after 3 months on the diets. The protocol of the experiments was approved by the Animal Care and Use Committee of Yunnan University. Homocysteine levels in plasma of mice were determined by using an enzyme-linked immunosorbent assay (ELISA) kit (Axis-Shield, Kimbolton, Cambridgeshire, UK).
Murine Hepatectomy
All mice underwent PH by removal of 70% of total liver mass (left lateral, left median, and right median lobes) under sodium pentobarbital anesthesia (75 μg/g b.wt.). PH was performed by a single investigator (J.C.). At the end of the surgical operation, animals were allowed to recover on a heating pad and later were returned to cages and fed ad libitum. Sham operation mice received sham surgery in which the liver was gently manipulated but not resected. At the indicated time, mice were sacrificed, and liver tissues were harvested. To test the effect of p53 on liver regeneration, mice were injected with 2.2 mg/kg of pifithrin-α (Biomol, Plymouth Meeting, PA) intraperitoneally 2 hours before PH. After the first dose was given, mice were injected with 2.2 mg/kg of pifithrin-α every 24 hours. A part of the liver was immediately removed and quickly frozen in liquid nitrogen. The remaining part of the liver was fixed in formalin, dehydrated in graded ethylic alcohol, and embedded in paraffin. All slides were evaluated at random with sections stained with H&E or oil red O. Surgically removed liver lobes and the regenerating livers were collected and weighed. The relative percentage of the corresponding original liver mass was calculated.
Immunohistochemistry
DNA synthesis was measured by immunohistochemistry for proliferating cell nuclear antigen (PCNA) staining and bromodeoxyuridine (BrdU) incorporation on paraffin sections. For PCNA staining, a mouse anti-PCNA antibody (Santa Cruz Biotechnology, Santa Cruz, CA) was used. For BrdU staining, mice were injected with 100 mg/kg BrdU (Amersham Biosciences, Piscataway, NJ) intraperitoneally 2 hours before tissue harvesting. BrdU incorporation was detected by a mouse anti-BrdU antibody (Ab3) (Thermo Scientific, Fremont, CA). A hepatocyte-labeling index (percentage of positive nuclei) was determined by counting 2000 nuclei in 10 high-power fields (×40) per mouse.
Quantitative Real-Time RT-PCR Analysis
Total RNA from liver tissues was isolated using TRIzol reagent (Invitrogen, Carlsbad, CA). Random-primed cDNAs were generated by reverse transcription of total RNA samples with SuperScript II (Invitrogen). A real-time PCR analysis was performed with the ABI Prism 7000 Sequence Detection system (Applied Biosystems, Foster City, CA) using SYBR Premix Ex Tag (Takara, Dalian, China). All results were standardized to the levels of actin. The primers used for PCR were as follows22: epidermal growth factor (EGF) receptor, 5′-CCGCCTGCTTCAAGAGAGAG-3′ (forward) and 5′-TGTGCCAAATGCTCCCGAA-3′ (reverse); hepatocyte growth factor (HGF) receptor, 5′-GTGAACATGAAGTATCAGCTCCC-3′ (forward) and 5′-GTAGTTTGTGGCTCCGAGAT-3′ (reverse); HGF, 5′-CTGCTTCATGTCGCCATCC-3′ (forward) and 5′-TGGGTCTTCCTTGGTAAGAGTAG-3′ (reverse); and actin, 5′-AGTGTGACGTTGACATCCGTA-3′ (forward) and 5′-GCCAGAGCAGTAATCTCCTTCT-3′ (reverse).
Measurement of Cytokines, Transaminases, and cAMP
Plasma levels of tumor necrosis factor (TNF-α) and interleukin-6 (IL-6) in mice were determined by ELISA kits (R&D Systems, Shanghai, China). The assays were performed according to the manufacturer’s protocols. The activities of alanine aminotransferase (ALT) and aspartate aminotransferase (AST) were determined using a standard clinical automatic analyzer (Hitachi 7060). cAMP levels in the liver were determined using an ELISA kit (R&D Systems).
Cell Culture and Homocysteine Treatment
Mouse hepatocytes were prepared and characterized as described previously.23 Hepatocytes were plated in serum-free Williams’ E medium (Gibco, Gaithersburg, MD) as described previously,24 including insulin (20 mU/ml, Sigma-Aldrich, St. Louis, MO) and EGF (10 ng/ml, Sigma-Aldrich). After attachment, the cells were cultured with Dulbecco’s modified Eagle’s medium (Gibco) without serum overnight.
[3H]Thymidine Incorporation Assay
After attachment in 24-well tissue culture plates, mouse hepatocytes were incubated with 250 μmol/L homocysteine or methionine along with EGF (20 ng/ml) and HGF (R&D Systems, Minneapolis, MN) (20 ng/ml) for 6, 18, 42, and 66 hours, respectively. Then 50 μl of serum-free medium containing [3H]thymidine (1 μCi/ml) (Atom High-Tech Co., Beijing, China) were added to the cells for a further 6 hours before the [3H]thymidine incorporation assay as described previously.25
Western Blotting
After liver samples were homogenized in liquid nitrogen, the homogenate was lysed on ice for 30 minutes in lysis buffer (BioTeKe, Beijing, China). The lysates (25 μg) of total protein were loaded per well and separated on a 10% SDS-polyacrylamide gel. Proteins were then transferred to polyvinylidene difluoride. Primary antibodies were anti-Akt, anti-phospho-Akt (Ser473), anti-p57kip2, anti-cAMP response element-binding protein (CREB), anti-phospho-CREB (Ser133), p53, and anti-actin antibodies (Sigma-Aldrich), anti-p21Cip1, anti-p27kip1, anti-cyclin A, anti-cyclin E, anti-cyclin B, and anti-cyclin D1antibodies (Santa Cruz Biotechnology). The secondary antibody was a peroxidase-coupled anti-rabbit or mouse IgG (Amersham Biosciences). The membrane was exposed to ECL Hyperfilm (Amersham Biosciences), and the film was developed.
Statistical Analysis
Data from experiments are expressed as means ± SD. Statistical differences between the groups were analyzed using one-way analysis of variance, followed by a Student-Newman-Keuls test. Values of P < 0.05 were considered statistically significant.
Results
Hyperhomocysteinemia Suppresses Liver Regeneration after Partial Hepatectomy
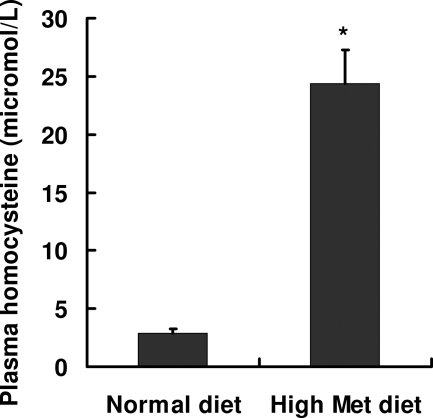
Moderate hyperhomocysteinemia can be induced by increasing the total methionine in mice.26 In this study, mice were fed a diet with drinking water supplemented with 2% l-methionine. After 3 months on the diet, mice demonstrated an approximately eightfold increase in plasma levels of homocysteine compared with control mice fed a normal diet (24.4 ± 2.9 versus 2.9 ± 0.4 μmol/L, respectively) (Figure 1).
Figure 1.
Induction of hyperhomocysteinemia in mice. BALB/c mice were fed one of two diets: i) control diet (LM-485 chow) or ii) high-methionine diet (LM-485 chow with drinking water supplemented with 2% l-methionine) (Met). Mice were sacrificed after 3 months on the diets. Levels of plasma homocysteine were determined using the ELISA method. Data are presented as the mean ± SD (n = 10 in each group). *P < 0.05 versus normal diet.
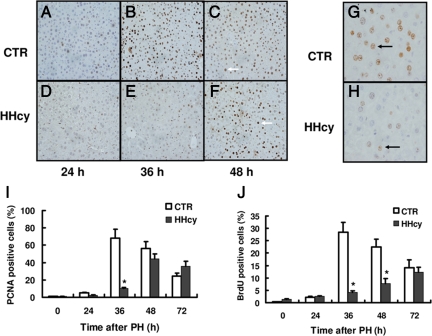
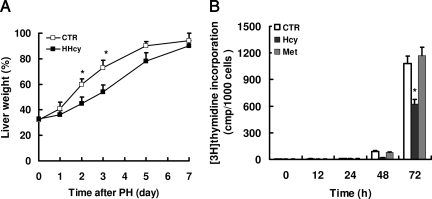
To determine whether HHcy would affect hepatocyte replication during liver regeneration, we performed a standard 70% PH in mice. DNA synthesis was measured by immunohistochemical staining of proliferation marker PCNA. A quantitative time course of PCNA staining revealed a significant delay of hepatocellular proliferation in mice with HHcy after PH (Figure 2, A–F). The peak of PCNA staining was reached after 36 hours of PH in normal mice and after 48 hours in HHcy mice, respectively. Maximal levels of PCNA staining in HHcy mice (at 48 hours) were 44% and were significantly lower than the maximal levels of PCNA staining observed in normal mice (68%) (Figure 2I). To further confirm these results, we determined DNA replication by BrdU incorporation into nuclear DNA. Consistently, mice with HHcy showed a marked decrease in DNA synthesis in hepatocytes, compared with normal mice at 36 hours after PH (Figure 2, G and H). At 36 hours after PH, the levels of BrdU incorporation were 28% in livers from normal mice compared with 4.2% in livers from HHcy mice (Figure 2J). No statistical difference was observed in the relative percentage of the corresponding original liver mass between normal and HHcy mice on day 7 after PH (Figure 3A). However, there was a significant difference at days 2 and 3, when this ratio in HHcy mice transiently lagged behind that of normal mice. Taken together, these results demonstrate that HHcy impairs hepatocellular proliferation after PH.
Figure 2.
PCNA expression and BrdU incorporation. Quantitative analysis and representative images of PCNA-expressing hepatocytes and incorporation of BrdU at various times after PH in livers of normal and HHcy mice. A–F: Representative examples of PCNA immunohistochemistry in normal and HHcy mice. Arrows indicate positive nuclei. G and H: Representative examples of BrdU immunohistochemistry in normal and HHcy mice at 36 hours after PH. Arrows indicate positive nuclei. I: Percentage of PCNA-positive nuclei (n = 7 per group at each time point). J: Percentage of BrdU-positive nuclei (n = 7 per group at each time point). A–F are lower-power images; G and H are higher-power images. The percentage of positive nuclei was determined by counting 2000 nuclei. *P < 0.05 versus control (CTR).
Figure 3.
Homocysteine impairs liver mass regeneration and inhibits proliferation of hepatocytes in vitro. A: Mice were sacrificed at various times after PH. Regenerating livers were collected and weighed. Regeneration of liver mass was calculated as the percentage of the average liver mass of mice that did not undergo surgery as control (CTR). *P < 0.05 versus HHcy (n = 7 per group at each time point). B: Primary cultured hepatocytes were incubated with 250 μmol/L homocysteine (Hcy) or methionine (Met). The cell proliferation was assessed by [3H]thymidine incorporation into DNA after treatment with homocysteine at various times. These results are means ± SD of five experiments. *P < 0.05 versus control (The concentration of homocysteine or methionine Met is zero.)
To assess the direct effect of homocysteine on hepatocyte proliferation in vitro, DNA synthesis was assessed by determining [3H]thymidine uptake. We found that treatment with homocysteine markedly inhibited this incorporation in mouse hepatocytes: 250 μmol/L homocysteine resulted in a 42% decrease in [3H]thymidine incorporation in hepatocytes after 72 hours (Figure 3B). In contrast, methionine did not significantly affect hepatic proliferation, indicating that this effect was selective for homocysteine.
HHcy Induces Liver Injury and Mild Steatosis But Does Not Alter the Production of IL-6 and TNF-α after PH
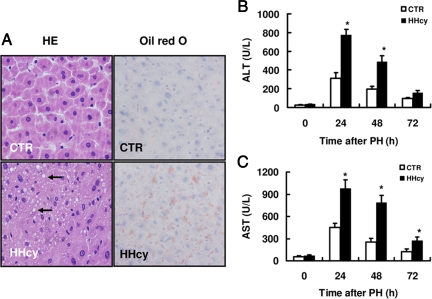
In this study, an accumulation of micro fat droplets was observed only in livers of HHcy mice and not in livers of normal mice (Figure 4A). Little or no necrotic areas in livers were observed in either HHcy or normal mice. HHcy mice did not exhibit increased hepatocellular BrdU incorporation in quiescent livers, which is the hallmark of hepatic injury (data not shown). Furthermore, the basal levels of plasma ALT and AST in HHcy mice were similar to those in normal mice. However, the plasma levels of ALT and AST in HHcy mice were significantly higher than those in normal mice at 24 and 48 hours after PH (Figure 4, B and C). These data suggest that HHcy causes hepatic injury after PH.
Figure 4.
Mild steatosis and liver injury in mice with HHcy. A: H&E staining of liver sections from unoperated mice did not reveal changes in liver tissue structure. However, livers of HHcy mice by H&E and oil red O stains show persisting fat accumulation (indicated by arrow). Liver damage was assessed by measuring plasma levels of ALT (B) and AST (C) in sera from mice after partial hepatectomy. Results are expressed as the mean ± SD (n = 5 per group at each time point). *P < 0.05 versus control (CTR).
Given that the initiation of liver regeneration depends on cytokines such as IL-6 and TNFα, we tested the effect of HHcy on the production of the cytokines 2 to 12 hours after PH. We found that the serum levels of IL-6 and TNF-α after PH were similar in mice of both groups (data not shown). The process of liver regeneration also requires growth factors. We thus determined the expression of EGF and HGF receptors as well as of HGF in liver after partial hepatectomy. We found that the expression of EGF and HGF receptors as well as HGF in liver between 2 and 12 hours after PH has no significant difference between mice with HHcy and normal mice (data not shown). These results excluded the possibility that the effect of HHcy on liver regeneration is due to blocking the production of cytokines and down-regulating growth factor receptors.
HHcy Reduces Levels of Cyclin D1 and Increases Levels of p53 and p21Cip1
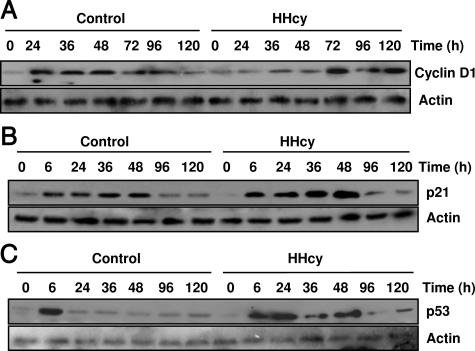
Because HHcy inhibited hepatocyte proliferation after PH, we examined the effect of HHcy on the expression of genes involved in cell cycle progression after PH. In livers of normal mice, cyclin D1 protein expression was up-regulated 24 hours after PH and continued to accumulate to high levels between 36 and 48 hours after PH in livers of normal mice (Figure 5A). In contrast, the induction of cyclin D1 protein expression was delayed in livers of mice with HHcy. Only low levels of cyclin D1 protein could be detected in livers of HHcy mice between 24 and 48 hours after PH. However, by 72 hours after PH, the expression of cyclin D1 began to increase in HHcy mice. The other cell cycle regulators, such as cyclin E, cyclin B1, cyclin A, were not altered during liver regeneration in normal and HHcy mice (data not shown).
Figure 5.
Western blot analysis of cyclin D1, p53, and p21Cip1 in livers of normal and HHcy mice. Mice were sacrificed at various times after PH. Liver removed at the time of PH was used as the baseline (zero time). Cyclin D1 (A), p53 (B), and p21Cip1 (C) were measured using Western blotting analysis (n = 5 per group at each time point). Representative Western blots are shown.
It has been shown that inhibition of p53 by antisense oligonucleotides in the regenerating liver results in enhanced mitosis and elevated PCNA expression.27 Overexpression of p21cip1, a Cdk inhibitor, impairs mouse liver regeneration.28 In this study, we found that both p53 and p21cip1 protein levels in livers were induced in the two groups at 6 hours after PH (Figure 5, B and C). p53 protein levels in normal mice declined to the basal level 24 hours after PH. In contrast, HHcy mice displayed a sustained increase in p53 protein levels between 24 to 48 hours after PH. The protein levels of p21cip1 in HHcy mice were markedly higher than those in normal mice over a course of 48 hours. The expression of p27kip1 and p57kip2, two other CDK inhibitors, was similar between HHcy and normal mice during liver regeneration (data not shown). Taken together, these data suggest that defective cell cycle progression in the liver of mice with HHcy after PH is due to abnormal regulation of genes involved in the cell cycle.
Inhibition of Akt Phosphorylation Is Associated with Elevated Levels of cAMP and CREB Phosphorylation in the Livers of HHcy Mice
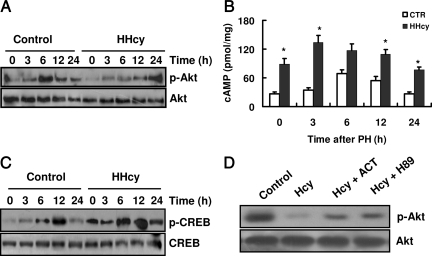
Activation of Akt is a critical cell survival signal during the regenerative process.29 The inhibition of Akt phosphorylation leads to impaired liver regeneration.30 We thus determined the phosphorylation of Akt in the liver. The phosphorylation of Akt (Ser473), which results in its activation, was markedly induced within 6 and 12 hours after PH in normal mice. However, levels of phosphorylated Akt were only elevated at 24 hours after PH in HHcy mice (Figure 6A).
Figure 6.
HHcy reduces phosphorylation of Akt (p-Act) in liver via the cAMP/CREB pathway. Mice were sacrificed at various times after PH. Liver removed at the time of PH was used as the baseline (zero time). A: Total proteins were extracted from livers and analyzed by Western blotting with antibodies against p-Akt (Ser473) (n = 5 per group at each time point). Representative Western blots are shown. B: Hepatic cAMP levels were measured using ELISA. Results are expressed as the mean ± SD (n = 5 per group at each time point). *P < 0.05 versus control (CTR). C: The levels of phosphorylated CREB (p-CREB) were measured using Western blotting analysis (n = 5 per group at each time point). Representative Western blots are shown. D: Primary cultured hepatocytes were preincubated with 5 μmol/L H89 or 100 μmol/L adenylyl cyclase toxin (ACT) for 30 minutes. After incubation with homocysteine for 3 hours, total proteins were extracted from livers and analyzed by Western blotting with antibodies against p-Akt (Ser473) (n = 4). Representative Western blots are shown.
Previous studies have demonstrated that homocysteine enhances the activity of protein kinase A (PKA) and the phosphorylation of CREB in livers and hippocampal slices, respectively.31,32 In this study, we observed that the levels of cAMP were markedly higher in quiescent livers of HHcy mice compared with those in quiescent livers of normal mice (Figure 6B). In normal mice, a significant increase in hepatic cAMP levels occurred at 6 and 12 hours after PH (Figure 6B). However, the cAMP levels were maintained at high levels after PH compared with those in normal mice. Because CREB is a downstream target of PKA, we also determined the effect of HHcy on the phosphorylation of CREB in liver. As shown in Figure 6C, the phosphorylation levels of CREB in quiescent and regenerating livers were significantly higher in HHcy mice than those in normal mice. These data suggest that the cAMP/PKA pathway is abnormally activated in HHcy mice.
It has been shown that cAMP inhibits the phosphorylation of Akt in a variety of cells.33,34 To investigate whether the cAMP/PKA signaling pathway is involved in homocysteine-mediated Akt dephosphorylation, primary mouse hepatocytes were cultured in the presence of mitogens (EGF and insulin). We found that treatment with homocysteine (100 μmol/L) significantly reduced the phosphorylation of Akt in hepatocytes (Figure 6D). Pretreatment with 100 μmol/L adenylyl cyclase toxin (a specific inhibitor of adenylyl cyclase) or 5 μmol/L H89 (a specific inhibitor of protein kinase A) effectively attenuated the inhibitory effect of homocysteine on the phosphorylation of Akt (Figure 6D).
Up-Regulation of p21Cip1 by Homocysteine Is p53-Dependent
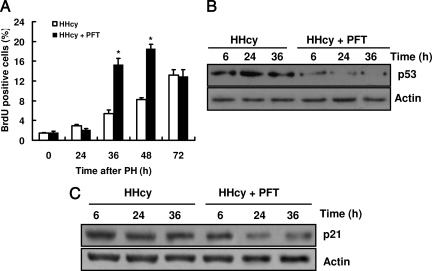
To study the roles of p53 and p21Cip1 in liver regeneration in HHcy mice, we used pifithrin-α, a p53 inhibitor, to treat mice. We found that pifithrin-α treatment did not affect DNA synthesis measured by BrdU incorporation into nuclear DNA after PH in control mice (data not shown). In contrast, pifithrin-α treatment resulted in an increase in DNA synthesis after PH in HHcy mice (Figure 7A). Furthermore, pifithrin-α significantly suppressed the protein levels of p53 after PH in the liver of HHcy mice (Figure 7B). The protein levels of p21Cip1 were also reduced by pifithrin-α treatment after PH in HHcy mice (Figure 7C). These data suggest that up-regulation of p21Cip1 by homocysteine is p53-dependent.
Figure 7.
Inhibition of p53 stimulates liver regeneration and suppresses the expression of p21cip1 in HHcy mice. Mice were injected with 2.2 mg/kg pifithrin-α (PFT) and sacrificed at various times after PH. A: Liver removed at the time of PH was used as the baseline (zero time).The percentage of BrdU-positive nuclei is shown (n = 5 per group at each time point). *P < 0.05 versus HHcy. B: Livers were removed 6, 24, and 36 hours after PH. The expression of p53 was measured using Western blotting analysis (n = 5 per group at each time point). C: The expression of p21Cip1 was measured using Western blotting analysis (n = 5 per group at each time point). Representative Western blots are shown.
Discussion
Liver regeneration is the common mechanism whereby patients recover from hepatic injury. Recent studies have shown that HHcy induces liver injury by oxidative stress.11,21 However, little is known about how proliferating hepatocytes respond to HHcy. In this study, we demonstrated that homocysteine inhibited hepatocyte proliferation in the regenerating liver. The elevated levels of aminotransferases in HHcy mice after PH indicated a vulnerability of livers with HHcy to surgical insult. Thus, inhibition of liver regeneration by HHcy may result in retarded recovery of liver injury induced by homocysteine itself.
In our experiments, a moderate elevation of plasma homocysteine (eightfold increase) was observed in HHcy mice. These mice developed only mild steatosis. In contrast, CBS−/− mice, which have a mean homocysteine level 30- to 50-fold higher than that of normal mice, exhibit severe steatosis.11,18 It has been shown that severe steatosis impairs liver regeneration.4,5,6,7 Steatotic livers show dysregulation of pro- and antiapoptotic proteins and significant changes in cell metabolism, such as increased lipid peroxidation and a reduced ability to produce adenosine triphosphate. However, it is still unknown whether mild steatosis affects liver regeneration. Previous studies from Cho et al35,36 have demonstrated that mild hepatic steatosis is not a major risk factor for hepatectomy. Thus, these authors conclude that hepatectomy in donors with mild steatosis can be performed with low morbidity. A recent study has also confirmed that the hepatic regeneration and proliferative response in mild steatotic rats were no different from those in controls.37 However, mild steatosis impairs functional recovery and increases hepatocellular damage after hepatectomy. Further studies are required to clarify whether mild steatosis plays a role in impaired liver regeneration in HHcy.
It has been well established that the phosphatidylinositol 3-kinase/Akt signaling pathway, which is downstream of growth factor receptors, is important in promoting cell survival and proliferation.29,38 In our experiments, the phosphorylation of Akt was markedly reduced in livers of mice with HHcy after PH. Suhara et al39 have reported that homocysteine significantly inhibits Akt activity in endothelial cells. Although these authors did not study the mechanism underlying homocysteine-mediated inactivation of Akt, these results suggest that the Akt signaling is a novel target for homocysteine-induced endothelial cytotoxicity. Recent studies demonstrated that this pathway is critical for liver regeneration.40,41 For instance, blockade of phosphatidylinositol 3-kinase by wortmannin or small interfering RNA results in a significant reduction in hepatocyte proliferation after PH.40 The reduced activation of Akt has also been suggested to contribute to the delayed liver regeneration in Nrf2 knockout mice.41 These data suggest that HHcy-mediated dephosphorylation of Akt is a potential mechanism of the inhibition of liver regeneration.
cAMP-mediated signaling pathways have been implicated in the regulation of liver regeneration.42,43,44 For instance, knockout of cAMP-responsive promoter element modulator leads to a delay in hepatocyte proliferation during liver regeneration.43 The production of cAMP, which is biphasic, is tightly regulated during liver regeneration after PH. Hepatic cAMP rapidly accumulates 6 hours after PH and returns toward basal levels by 24 hours.42 The levels of cAMP gradually increase during the next 48 hours after PH. Experiments in vitro with primary hepatocytes have demonstrated that a transient elevation of cAMP stimulates DNA synthesis by EGF, whereas sustained elevations of cAMP inhibit this process.42,45 Elevated cAMP levels in HHcy mice have been reported previously31 and are confirmed by our observation. Thus, abnormal cAMP production by homocysteine probably disturbs the signaling pathways involved in liver regeneration. Previous studies indicated that cAMP can either stimulate33,34,46,47 or inhibit Akt activity.33,34,47 It has been suggested that Epac and PKA, both cAMP downstream molecules, mediate different effects, eg, PKA inhibits Akt activation, whereas Epac may act as a positive modulator of Akt in response to cAMP.47 However, a recent study demonstrated that a synergistic action of Epac and PKA is responsible for cAMP-mediated inhibition of Akt in a manner that depends on the GTP-binding protein Rap1b and the phosphatase PP2A.34 In this study, we found that both H89 and adenylyl cyclase toxin significantly suppressed homocysteine-induced dephosphorylation of Akt in cultured hepatocytes. These data suggest that the cAMP/PKA pathway is involved in the inhibition of Akt phosphorylation in HHcy mice.
There are two key steps in liver regeneration: withdrawal of hepatocytes from quiescence (priming), which is controlled by cytokines such as TNF-α and IL-6, and the progression in the G1 phase of the cell cycle, which is controlled by growth factors (eg, EGF and HGF) and cyclin D1.48 In the present study, our data indicate that the production of cytokines and expression of growth factor receptors are not impaired in mice with HHcy. Generally, cyclin D1 regulates G1 to S phase cell cycle progression, and its expression is induced by 24 hours after PH during normal liver regeneration.49 We found that the protein expression of cyclin D1 was reduced and delayed in HHcy mice. Reduced and delayed expression of cyclin D1 has been reported in livers of ob/ob mice and mice lacking methionine adenosyltransferase or epidermal growth factor receptor.5,48,50 This finding is consistent with arrest of hepatocytes in these mice in the G1 phase of the cell cycle. In contrast, bax inhibitor-1 deficiency accelerates liver regeneration after PH, which is associated with an increase in cyclin D1 protein levels.51 Akt can enhance expression of cyclin D1 through enhancing translation and inhibiting protein degradation.52 Thus, the reduced expression of cyclin D1 is probably due to a decrease in Akt phosphorylation in HHcy mice.
Our results indicated that the protein levels of p53 and p21Cip1 in the livers of HHcy mice were significantly higher than those in livers of normal mice after PH. The mechanism underlying homocysteine-mediated up-regulation of p53 is not clear. It has been reported that Akt phosphorylates MDM2, enhancing MDM2-mediated degradation of p53 by ubiquitination.53 This finding may provide a ready explanation of our observation that homocysteine up-regulates protein levels of p53. A previous study has demonstrated that mice lacking c-Jun in the liver display increased protein levels of p21Cip1 and impaired liver regeneration after PH.1 Moreover, inactivation of p53 in mice lacking c-Jun abolished hepatocyte cell cycle block and increased p21Cip1 protein expression. Transgenic mice overexpressing p21Cip1 specifically in liver display impaired liver regeneration after PH.28 In addition, p21Cip1 up-regulation is correlated with reduced DNA replication in Foxm1b- or Atm-deficient (−/−) mice during liver regeneration.54,55 In contrast, p21Cip1 knockout mice display accelerated hepatocyte proliferation after PH because of an increase in the expression of the G1 phase of the cell cycle.56 In this study, we found that pifithrin-α suppressed homocysteine-induced expression of p21Cip1 in HHcy mice. Therefore, homocysteine up-regulates p21Cip1 through a pathway that involves p53.
In summary, our study demonstrates that HHcy impairs liver regeneration after PH, accompanied by reduced expression of cyclin D1 and phosphorylation of Akt as well as up-regulation of p53 and p21Cip1. The cAMP/PKA pathway may mediate the inhibitory effect of homocysteine on liver regeneration. These results may enhance our understanding of the direct link between HHcy and hepatic dysfunction.
Acknowledgments
We are grateful to Dr. Yu-Chen Xie (The Second People’s Hospital of Yunnan, China) for her technical help with immunochemistry.
Footnotes
Address reprint requests to Cheng-Gang Zou, Ph.D., Laboratory for Conservation and Utilization of Bio-Resources, Yunnan University, Kunming, Yunnan 650091, China. E-mail: chgzou@ynu.edu.cn.
Supported in part by the National Natural Science Foundation of China (grant 30560036) and Yunnan Department of Science and Technology (grant 2009CI045) to C.-G.Z.
W.-H.L. and Y.-S.Z. contributed equally to this work.
None of the authors disclosed any relevant financial relationships.
References
- Stepniak E, Ricci R, Eferl R, Sumara G, Sumara I, Rath M, Hui L, Wagner EF. c-Jun/AP-1 controls liver regeneration by repressing p53/p21 and p38 MAPK activity. Genes Dev. 2006;20:2306–2314. doi: 10.1101/gad.390506. [DOI] [PMC free article] [PubMed] [Google Scholar]
- Fausto N. Liver regeneration. J Hepatol. 2000;32(1 Suppl):19–31. doi: 10.1016/s0168-8278(00)80412-2. [DOI] [PubMed] [Google Scholar]
- Veteläinen R, van Vliet AK, van Gulik TM. Severe steatosis increases hepatocellular injury and impairs liver regeneration in a rat model of partial hepatectomy. Ann Surg. 2007;245:44–50. doi: 10.1097/01.sla.0000225253.84501.0e. [DOI] [PMC free article] [PubMed] [Google Scholar]
- Selzner M, Clavien PA. Failure of regeneration of the steatotic rat liver: disruption at two different levels in the regeneration pathway. Hepatology. 2000;31:35–42. doi: 10.1002/hep.510310108. [DOI] [PubMed] [Google Scholar]
- Yang SQ, Lin HZ, Mandal AK, Huang J, Diehl AM. Disrupted signaling and inhibited regeneration in obese mice with fatty livers: implications for nonalcoholic fatty liver disease pathophysiology. Hepatology. 2001;34:694–706. doi: 10.1053/jhep.2001.28054. [DOI] [PubMed] [Google Scholar]
- DeAngelis RA, Markiewski MM, Taub R, Lambris JD. A high-fat diet impairs liver regeneration in C57BL/6 mice through overexpression of the NF-κB inhibitor. IκBα. Hepatology. 2005;42:1148–1157. doi: 10.1002/hep.20879. [DOI] [PubMed] [Google Scholar]
- Rudnick DA. Trimming the fat from liver regeneration. Hepatology. 2005;42:1001–1003. doi: 10.1002/hep.20931. [DOI] [PubMed] [Google Scholar]
- Thambyrajah J, Townend JN. Homocysteine and atherothrombosis—mechanisms for injury. Eur Heart J. 2000;21:967–974. doi: 10.1053/euhj.1999.1914. [DOI] [PubMed] [Google Scholar]
- Seshadri S, Beiser A, Selhub J, Jacques PF, Rosenberg IH, D'Agostino RB, Wilson PW, Wolf PA. Plasma homocysteine as a risk factor for dementia and Alzheimer’s disease. N Engl J Med. 2002;346:476–483. doi: 10.1056/NEJMoa011613. [DOI] [PubMed] [Google Scholar]
- Zou CG, Banerjee R. Homocysteine and redox signaling. Antioxid Redox Signal. 2005;7:547–559. doi: 10.1089/ars.2005.7.547. [DOI] [PubMed] [Google Scholar]
- Robert K, Nehme J, Bourdon E, Pivert G, Friguet B, Delcayre C, Delabar JM, Janel N. Cystathionine β synthase deficiency promotes oxidative stress, fibrosis, and steatosis in mice liver. Gastroenterology. 2005;128:1405–1415. doi: 10.1053/j.gastro.2005.02.034. [DOI] [PubMed] [Google Scholar]
- Kruman II, Culmsee C, Chan SL, Kruman Y, Guo Z, Penix L, Mattson MP. Homocysteine elicits a DNA damage response in neurons that promotes apoptosis and hypersensitivity to excitotoxicity. J Neurosci. 2000;20:6920–6926. doi: 10.1523/JNEUROSCI.20-18-06920.2000. [DOI] [PMC free article] [PubMed] [Google Scholar]
- Xu D, Neville R, Finkel T. Homocysteine accelerates endothelial cell senescence. FEBS Lett. 2000;470:20–24. doi: 10.1016/s0014-5793(00)01278-3. [DOI] [PubMed] [Google Scholar]
- Zhang C, Cai Y, Adachi MT, Oshiro S, Aso T, Kaufman RJ, Kitajima S. Homocysteine induces programmed cell death in human vascular endothelial cells through activation of the unfolded protein response. J Biol Chem. 2001;276:35867–35874. doi: 10.1074/jbc.M100747200. [DOI] [PubMed] [Google Scholar]
- Avila MA, Berasain C, Torres L, Martin-Duce A, Corrales FJ, Yang H, Prieto J, Lu SC, Caballeria J, Rodes J, Mato JM. Reduced mRNA abundance of the main enzymes involved in methionine metabolism in human liver cirrhosis and hepatocellular carcinoma. J Hepatol. 2000;33:907–914. doi: 10.1016/s0168-8278(00)80122-1. [DOI] [PubMed] [Google Scholar]
- Sakuta H, Suzuki T. Alcohol consumption and plasma homocysteine. Alcohol. 2005;37:73–77. doi: 10.1016/j.alcohol.2005.12.005. [DOI] [PubMed] [Google Scholar]
- Chen Z, Karaplis AC, Ackerman SL, Pogribny IP, Melnyk S, Lussier-Cacan S, Chen MF, Pai A, John SW, Smith RS, Bottiglieri T, Bagley P, Selhub J, Rudnicki MA, James SJ, Rozen R. Mice deficient in methylenetetrahydrofolate reductase exhibit hyperhomocysteinemia and decreased methylation capacity, with neuropathology and aortic lipid deposition. Hum Mol Genet. 2001;10:433–443. doi: 10.1093/hmg/10.5.433. [DOI] [PubMed] [Google Scholar]
- Werstuck GH, Lentz SR, Dayal S, Hossain GS, Sood SK, Shi YY, Zhou J, Maeda N, Krisans SK, Malinow MR, Austin RC. Homocysteine-induced endoplasmic reticulum stress causes dysregulation of the cholesterol and triglyceride biosynthetic pathways. J Clin Invest. 2001;107:1263–1273. doi: 10.1172/JCI11596. [DOI] [PMC free article] [PubMed] [Google Scholar]
- Namekata K, Enokido Y, Ishii I, Nagai Y, Harada T, Kimura H. Abnormal lipid metabolism in cystathionine β-synthase-deficient mice, an animal model for hyperhomocysteinemia. J Biol Chem. 2004;279:52961–52969. doi: 10.1074/jbc.M406820200. [DOI] [PubMed] [Google Scholar]
- Adinolfi LE, Ingrosso D, Cesaro G, Cimmino A, D'Anto M, Capasso R, Zappia V, Ruggiero G. Hyperhomocysteinemia and the MTHFR C677T polymorphism promote steatosis and fibrosis in chronic hepatitis C patients. Hepatology. 2005;41:995–1003. doi: 10.1002/hep.20664. [DOI] [PubMed] [Google Scholar]
- Woo CW, Prathapasinghe GA, Siow YL, O K. Hyperhomocysteinemia induces liver injury in rat: Protective effect of folic acid supplementation. Biochim Biophys Acta. 2006;1762:656–665. doi: 10.1016/j.bbadis.2006.05.012. [DOI] [PubMed] [Google Scholar]
- Spandidos A, Wang X, Wang H, Seed B. PrimerBank: a resource of human and mouse PCR primer pairs for gene expression detection and quantification. Nucleic Acids Res. 2010;38:D792–D799. doi: 10.1093/nar/gkp1005. [DOI] [PMC free article] [PubMed] [Google Scholar]
- Vitvitsky V, Dayal S, Stabler S, Zhou Y, Wang H, Lentz SR, Banerjee R. Perturbations in homocysteine-linked redox homeostasis in a murine model for hyperhomocysteinemia. Am J Physiol Regul Integr Comp Physiol. 2004;287:R39–R46. doi: 10.1152/ajpregu.00036.2004. [DOI] [PubMed] [Google Scholar]
- Hansen LK, Albrecht JH. Regulation of the hepatocyte cell cycle by type I collagen matrix: role of cyclin D1. J Cell Sci. 1999;112(Pt 17):2971–2981. doi: 10.1242/jcs.112.17.2971. [DOI] [PubMed] [Google Scholar]
- Zou CG, Gao SY, Zhao YS, Li SD, Cao XZ, Zhang Y, Zhang KQ. Homocysteine enhances cell proliferation in hepatic myofibroblastic stellate cells. J Mol Med. 2009;87:75–84. doi: 10.1007/s00109-008-0407-2. [DOI] [PubMed] [Google Scholar]
- Dayal S, Lentz SR. Murine models of hyperhomocysteinemia and their vascular phenotypes. Arterioscler Thromb Vasc Biol. 2008;28:1596–1605. doi: 10.1161/ATVBAHA.108.166421. [DOI] [PMC free article] [PubMed] [Google Scholar]
- Arora V, Knapp DC, Smith BL, Statdfield ML, Stein DA, Reddy MT, Weller DD, Iversen PL. c-Myc antisense limits rat liver regeneration and indicates role for c-Myc in regulating cytochrome P-450 3A activity. J Pharmacol Exp Ther. 2000;292:921–928. [PubMed] [Google Scholar]
- Wu H, Wade M, Krall L, Grisham J, Xiong Y, Van Dyke T. Targeted in vivo expression of the cyclin-dependent kinase inhibitor p21 halts hepatocyte cell-cycle progression, postnatal liver development and regeneration. Genes Dev. 1996;10:245–260. doi: 10.1101/gad.10.3.245. [DOI] [PubMed] [Google Scholar]
- Hong F, Nguyen VA, Shen X, Kunos G, Gao B. Rapid activation of protein kinase B/Akt has a key role in antiapoptotic signaling during liver regeneration. Biochem Biophys Res Commun. 2000;279:974–979. doi: 10.1006/bbrc.2000.4044. [DOI] [PubMed] [Google Scholar]
- Pang M, de la Monte SM, Longato L, Tong M, He J, Chaudhry R, Duan K, Ouh J, Wands JR. PPARδ agonist attenuates alcohol-induced hepatic insulin resistance and improves liver injury and repair. J Hepatol. 2009;50:1192–1201. doi: 10.1016/j.jhep.2009.01.021. [DOI] [PMC free article] [PubMed] [Google Scholar]
- Woo CW, Siow YL, O K. Homocysteine activates cAMP-response element binding protein in HepG2 through cAMP/PKA signaling pathway. Arterioscler Thromb Vasc Biol. 2006;26:1043–1050. doi: 10.1161/01.ATV.0000214981.58499.32. [DOI] [PubMed] [Google Scholar]
- Robert K, Pages C, Ledru A, Delabar J, Caboche J, Janel N. Regulation of extracellular signal-regulated kinase by homocysteine in hippocampus. Neuroscience. 2005;133:925–935. doi: 10.1016/j.neuroscience.2005.03.034. [DOI] [PubMed] [Google Scholar]
- Kim S, Jee K, Kim D, Koh H, Chung J. Cyclic AMP inhibits Akt activity by blocking the membrane localization of PDK1. J Biol Chem. 2001;276:12864–12870. doi: 10.1074/jbc.M001492200. [DOI] [PubMed] [Google Scholar]
- Hong K, Lou L, Gupta S, Ribeiro-Neto F, Altschuler DL. A novel Epac-Rap-PP2A signaling module controls cAMP-dependent Akt regulation. J Biol Chem. 2008;283:23129–23138. doi: 10.1074/jbc.M800478200. [DOI] [PMC free article] [PubMed] [Google Scholar]
- Cho JY, Suh KS, Kwon CH, Yi NJ, Cho SY, Jang JJ, Kim SH, Lee KU. The hepatic regeneration power of mild steatotic grafts is not impaired in living-donor liver transplantation. Liver Transpl. 2005;11:210–217. doi: 10.1002/lt.20340. [DOI] [PubMed] [Google Scholar]
- Cho JY, Suh KS, Kwon CH, Yi NJ, Lee KU. Mild hepatic steatosis is not a major risk factor for hepatectomy and regenerative power is not impaired. Surgery. 2006;139:508–515. doi: 10.1016/j.surg.2005.09.007. [DOI] [PubMed] [Google Scholar]
- Vetelainen R, Bennink RJ, van Vliet AK, van Gulik TM. Mild steatosis impairs functional recovery after liver resection in an experimental model. Br J Surg. 2007;94:1002–1008. doi: 10.1002/bjs.5672. [DOI] [PubMed] [Google Scholar]
- Cantley LC, Neel BG. New insights into tumor suppression: PTEN suppresses tumor formation by restraining the phosphoinositide 3-kinase/AKT pathway. Proc Natl Acad Sci USA. 1999;96:4240–4245. doi: 10.1073/pnas.96.8.4240. [DOI] [PMC free article] [PubMed] [Google Scholar]
- Suhara T, Fukuo K, Yasuda O, Tsubakimoto M, Takemura Y, Kawamoto H, Yokoi T, Mogi M, Kaimoto T, Ogihara T. Homocysteine enhances endothelial apoptosis via upregulation of Fas-mediated pathways. Hypertension. 2004;43:1208–1213. doi: 10.1161/01.HYP.0000127914.94292.76. [DOI] [PubMed] [Google Scholar]
- Jackson LN, Larson SD, Silva SR, Rychahou PG, Chen LA, Qiu S, Rajaraman S, Evers BM. PI3K/Akt activation is critical for early hepatic regeneration after partial hepatectomy. Am J Physiol Gastrointest Liver Physiol. 2008;294:G1401–G1410. doi: 10.1152/ajpgi.00062.2008. [DOI] [PMC free article] [PubMed] [Google Scholar]
- Beyer TA, Xu W, Teupser D, auf dem Keller U, Bugnon P, Hildt E, Thiery J, Kan YW, Werner S. Impaired liver regeneration in Nrf2 knockout mice: role of ROS-mediated insulin/IGF-1 resistance. EMBO J. 2008;27:212–223. doi: 10.1038/sj.emboj.7601950. [DOI] [PMC free article] [PubMed] [Google Scholar]
- Diehl AM, Yang SQ, Wolfgang D, Wand G. Differential expression of guanine nucleotide-binding proteins enhances cAMP synthesis in regenerating rat liver. J Clin Invest. 1992;89:1706–1712. doi: 10.1172/JCI115771. [DOI] [PMC free article] [PubMed] [Google Scholar]
- Servillo G, Della Fazia MA, Sassone-Corsi P. Transcription factor CREM coordinates the timing of hepatocyte proliferation in the regenerating liver. Genes Dev. 1998;12:3639–3643. doi: 10.1101/gad.12.23.3639. [DOI] [PMC free article] [PubMed] [Google Scholar]
- Servillo G, Della Fazia MA, Sassone-Corsi P. Coupling cAMP signaling to transcription in the liver: pivotal role of CREB and CREM. Exp Cell Res. 2002;275:143–154. doi: 10.1006/excr.2002.5491. [DOI] [PubMed] [Google Scholar]
- McGowan JA, Strain AJ, Bucher NL. DNA synthesis in primary cultures of adult rat hepatocytes in a defined medium: effects of epidermal growth factor, insulin, glucagon, and cyclic-AMP. J Cell Physiol. 1981;108:353–363. doi: 10.1002/jcp.1041080309. [DOI] [PubMed] [Google Scholar]
- Bommakanti RK, Vinayak S, Simonds WF. Dual regulation of Akt/protein kinase B by heterotrimeric G protein subunits. J Biol Chem. 2000;275:38870–38876. doi: 10.1074/jbc.M007403200. [DOI] [PubMed] [Google Scholar]
- Mei FC, Qiao J, Tsygankova OM, Meinkoth JL, Quilliam LA, Cheng X. Differential signaling of cyclic AMP: opposing effects of exchange protein directly activated by cyclic AMP and cAMP-dependent protein kinase on protein kinase B activation. J Biol Chem. 2002;277:11497–11504. doi: 10.1074/jbc.M110856200. [DOI] [PubMed] [Google Scholar]
- Chen L, Zeng Y, Yang H, Lee TD, French SW, Corrales FJ, Garcia-Trevijano ER, Avila MA, Mato JM, Lu SC. Impaired liver regeneration in mice lacking methionine adenosyltransferase 1A. FASEB J. 2004;18:914–916. doi: 10.1096/fj.03-1204fje. [DOI] [PubMed] [Google Scholar]
- Rickheim DG, Nelsen CJ, Fassett JT, Timchenko NA, Hansen LK, Albrecht JH. Differential regulation of cyclins D1 and D3 in hepatocyte proliferation. Hepatology. 2002;36:30–38. doi: 10.1053/jhep.2002.33996. [DOI] [PubMed] [Google Scholar]
- Natarajan A, Wagner B, Sibilia M. The EGF receptor is required for efficient liver regeneration. Proc Natl Acad Sci USA. 2007;104:17081–17086. doi: 10.1073/pnas.0704126104. [DOI] [PMC free article] [PubMed] [Google Scholar]
- Bailly-Maitre B, Bard-Chapeau E, Luciano F, Droin N, Bruey JM, Faustin B, Kress C, Zapata JM, Reed JC. Mice lacking bi-1 gene show accelerated liver regeneration. Cancer Res. 2007;67:1442–1450. doi: 10.1158/0008-5472.CAN-06-0850. [DOI] [PubMed] [Google Scholar]
- Muise-Helmericks RC, Grimes HL, Bellacosa A, Malstrom SE, Tsichlis PN, Rosen N. Cyclin D expression is controlled post-transcriptionally via a phosphatidylinositol 3-kinase/Akt-dependent pathway. J Biol Chem. 1998;273:29864–29872. doi: 10.1074/jbc.273.45.29864. [DOI] [PubMed] [Google Scholar]
- Ogawara Y, Kishishita S, Obata T, Isazawa Y, Suzuki T, Tanaka K, Masuyama N, Gotoh Y. Akt enhances Mdm2-mediated ubiquitination and degradation of p53. J Biol Chem. 2002;277:21843–21850. doi: 10.1074/jbc.M109745200. [DOI] [PubMed] [Google Scholar]
- Wang X, Kiyokawa H, Dennewitz MB, Costa RH. The Forkhead Box m1b transcription factor is essential for hepatocyte DNA replication and mitosis during mouse liver regeneration. Proc Natl Acad Sci USA. 2002;99:16881–16886. doi: 10.1073/pnas.252570299. [DOI] [PMC free article] [PubMed] [Google Scholar]
- Lu S, Shen KC, Wang Y, Brooks SC, Wang YA. Impaired hepatocyte survival and liver regeneration in Atm-deficient mice. Hum Mol Genet. 2005;14:3019–3025. doi: 10.1093/hmg/ddi333. [DOI] [PubMed] [Google Scholar]
- Albrecht JH, Poon RY, Ahonen CL, Rieland BM, Deng C, Crary GS. Involvement of p21 and p27 in the regulation of CDK activity and cell cycle progression in the regenerating liver. Oncogene. 1998;16:2141–2150. doi: 10.1038/sj.onc.1201728. [DOI] [PubMed] [Google Scholar]


