Abstract
Bacterial artificial chromosome (BAC)-based transgene can be expressed bicistronically with the target gene or fused to its translation start codon. To compare the transgene expression efficiencies of these two methods, mice were created that expressed green fluorescent protein (GFP) from the genomic locus of nucleostemin using the bicistronic (NSiGFP) or the ATG-fusion approach (NSmGFP). Three lines with 1, 2, and 4 copies of the NSiGFP transgene, and two lines with one copy of the NSmGFP transgene were generated. Of the three NSiGFP lines, only the 4-copy line can match the NSmGFP lines in their GFP protein expression levels. Analyses of the GFP and nucleostemin RNA transcript levels exclude IRES inefficiency and suggest premature termination of the bicistronic message as the cause for low GFP expression in the NSiGFP mice. This work provides important information for designing BAC transgenics when the transgene expression level is crucial.
Keywords: bacterial artificial chromosome, bicistronic, GFP, nucleostemin, transgenic
Transgenic mouse technology is a powerful way to genetically label or ablate a selective cell type, or to alter the expression level of the target gene in vivo. The success of this approach depends on whether a promoter sequence is available for directing the expression of the transgene in the same way as the target gene. Choosing the right promoter sequence to drive the transgene expression often requires a tremendous effort in characterizing the promoter structures and determining their expression capability in vivo. This difficulty is best overcome by the knock-in strategy, which is time- and cost-consuming and requires expertise in handling mouse ES cells. Here, the BAC transgenic technique offers a reasonable solution to circumvent the drawbacks of both the conventional and the knock-in approach (Yang et al., 1997).
Because BAC clones contain large genomic fragments, all regulatory elements necessary for controlling the expression of the target gene are likely to be contained within a single BAC, and the transgene expression is less influenced by the insertion site than the conventional transgene is (Giraldo and Montoliu, 2001). Unlike the knock-in approach, the BAC transgenic approach does not require the lengthy process of germline transmission and cross-breeding, and may even produce a stronger than knock-in expression of the transgene in mice with multiple copies of the transgene. Because of these benefits, the BAC transgenic technology has been increasingly applied to characterize the transcriptional regulation of gene expression (Reizis and Leder, 2001; Yu et al., 1999), label specific cell types (Chi et al., 2003), confirm the functionality of genetic mutations by in vivo complementation (Antoch et al., 1997; Probst et al., 1998), and reveal novel genetic functions (Heintz, 2000; Yang et al., 1999). Despite its expression fidelity and convenience, several issues are associated with this approach. The BAC transgene usually includes a few hundred kilobases and genes other than the target gene. Consequently, the interpretation of the phenotypes may be confounded by overexpression phenotypes of those functionally unrelated neighboring genes. Finally, it is difficult to rule out small deletion or rearrangement in the entire BAC transgene.
BAC-based transgene can be expressed with the target gene as a bicistronic message or fused to its translation start codon. While both methods preserve the original exon-intronic structures of the target gene, the bicistronic method permits the target gene to be expressed from the transgene, whereas the ATG-fusion approach abolishes its expression from the transgene. Other than the target gene overexpression effect, there are no available data comparing these two methods regarding their transgene expression efficiencies. Here, we choose a GTP-binding nucleolar protein nucleostemin as the target molecule to address this question. Nucleostemin is preferentially expressed in stem cells, cancer cells, and adult testis (Baddoo et al., 2003; Tsai and McKay, 2002). It is essential for early embryogenesis and capable of binding telomeric repeat-binding factor 1 (Zhu et al., 2006) through a nucleolus-nucleoplasmic shuttling mechanism (Meng et al., 2006; Tsai and McKay, 2005).
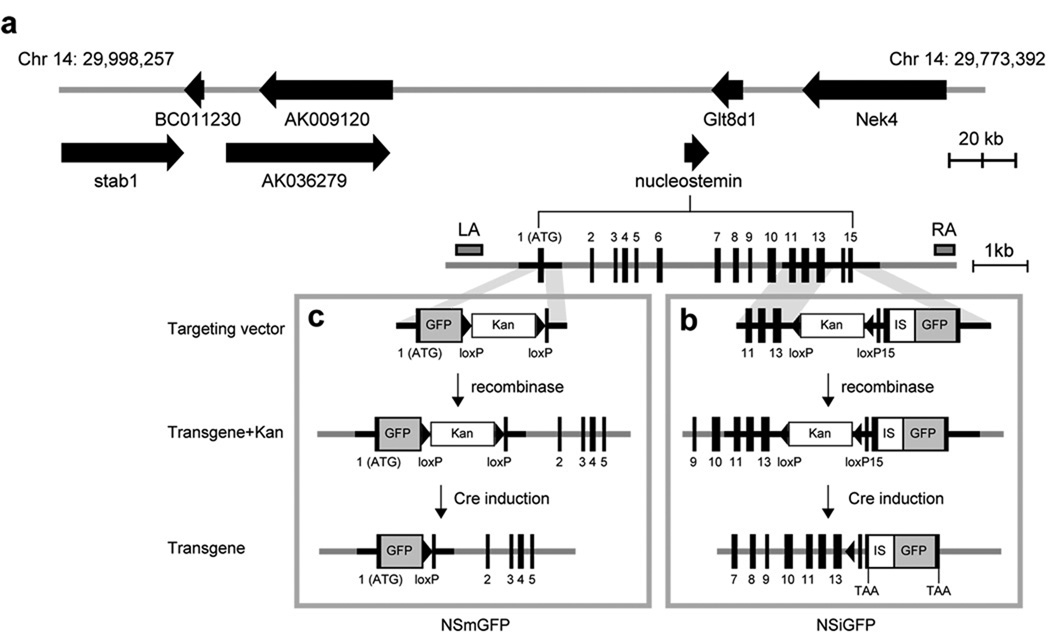
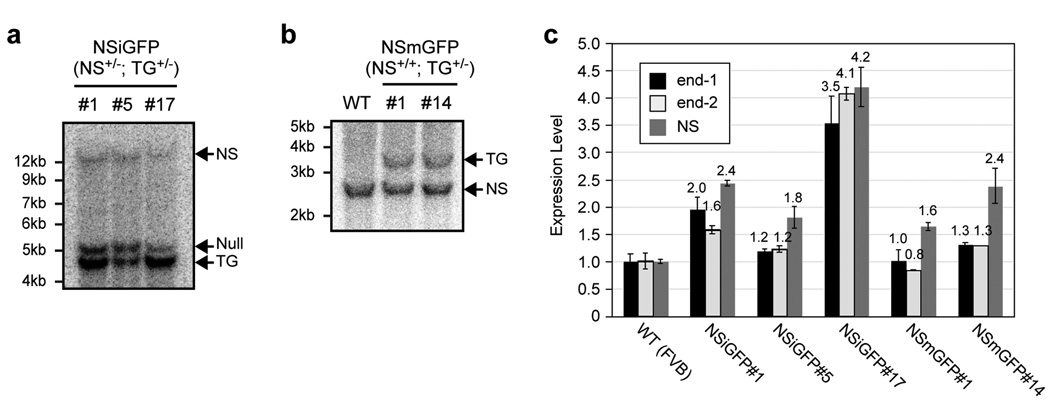
Mouse nucleostemin is localized on chromosome 14 (25,551,396-25,558,021). BAC clones of C57BL/6J origin were identified from the USCS database. The RP23-102M6 clone was chosen to build the transgenic construct because of its long genomic sequences 5’ and 3’ to the nucleostemin locus (Fig. 1a). In the NSiGFP model, a non-attenuated internal ribosomal entry site-2 (IRES2) of the encephalomyocarditis virus was inserted after the stop codon of nucleostemin, followed by the second transgene GFP (Fig. 1b). To avoid perturbing the splicing of the transgene RNA, the loxP-flanked kanamycin selection cassette (Kan) was placed at a non-conserved site within the 13th intron based on homology comparison between the rodent and human genes. In the NSmGFP model, GFP was fused in-frame to the start codon of nucleostemin, followed by the Kan cassette and the remaining sequence of the 1st exon (Fig. 1c). Modifications of BAC clones were carried out in EL350 cells using the recombineering approach (Lee et al., 2001; Liu et al., 2003). BAC clones were screened by PCR assays and removed of their Kan cassettes by Cre recombination prior to pronucleus injection. The transgene copy numbers of three established NSiGFP lines were determined to be 2 (NSiGFP#1), 1 (NSiGFP#5), and 4 (NSiGFP#17) based on the Southern intensities of the transgenic fragment (TG, 1-copy per genome) to the nucleostemin-null fragment (null, 1-copy per genome) in the (NSiGFP+/−, NS+/−) mice (Fig. 2a). Two NSmGFP lines were established, both of which harbored one copy of the transgene, judged by the intensity ratios between the transgenic fragment (1-copy per genome) and the endogenous nucleostemin fragment (2-copy per genome) (Fig. 2b). The integrity of the BAC transgene was assessed by quantitative PCR (qPCR) that measured the ends of the BAC (end-1 and -2) and the nucleostemin gene (NS) (Fig. 2c). The amount of genomic DNA in each sample was normalized to its RNA polymerase-II. Compared to the wild-type sample, the copy numbers of transgenic end-1 (or end-2) were 2 (1.2), 0.4 (0.4), 5 (6.2), 0 (0), and 0.6 (0.6) in the NSiGFP#1, NSiGFP#5, NSiGFP#17, NSmGFP#1, and NSmGFP#14 lines (Fig. 2c). The transgene copy numbers in the NS coding region determined by qPCR correlate with the Southern blot measurement, except for NSiGFP#17 and NSmGFP#14, which appear to have 6 and 3 copies of the transgene per genome. These results indicate that the BAC transgene is intact in the multi-copy NSiGFP#1 and NSiGFP#17 lines, but is partially eroded at the end in the one-copy NSiGFP#5, NSmGFP#1, and NSmGFP#14 lines.
Figure 1. Generation of BAC transgenic mice using a bicistronic and an ATG-fusion strategy.
(a) A schematic diagram of the RP23-102M6 BAC (chromosome 14: 29,773,392-29,998,257). Arrows mark the coding regions and directions of known genes and hypothetical proteins. Accession numbers: stab1 (NM_138672, stabilin 1); AK009120 (polybromo-1 homologue); nucleostemin (NM_178846); Glt8d1 (NM_029626, glycosyltransferase 8 domain containing 1); Nek4 (AK149584, NIMA (never in mitosis gene a)-related expressed kinase 4). The nucleostemin locus contains 15 coding exons (black boxes). The positions of the left-arm (LA) and right-arm (RA) probes used in Fig. 2a are indicated. (b) In the bicistronic NSiGFP design, an IRES2 (IS)-GFP expression cassette was placed after the stop codon of nucleostemin. The targeting vector contained a loxP-flanked kanamycin selection cassette (Kan) to allow for clone selection in E.coli, a partial 3‘ sequence of nucleostemin before the stop codon, and the IS-GFP cassette, sandwiched by recombineering arms (shaded areas). After recombination in EL350 cells, the Kan cassette was excised by Cre recombinase, creating the NSiGFP transgene. (c) In the ATG-fusion NSmGFP design, GFP is expressed from the start codon of nucleostemin, thereby abolishing the expression of nucleostemin from the transgene.
Figure 2. Measurement of the transgene copy number and integrity in the NSiGFP and NSmGFP lines.
(a) Three NSiGFP lines were established and mated with heterozygous NS+/− mice. Their offspring (NS+/−; NSiGFP+/−) were genotyped by BamHI-digested Southern blots hybridized with the right-arm probe indicated in Fig. 1a, where the nucleostemin transgene (TG), the nucleostemin-null (null), and the endogenous nucleostemin alleles (NS) are represented by the 4.6kb, 5.2kb, and 14.3kb fragments, respectively. Images were scanned and digitally quantified using the ImageJ 1.36b software. The transgene copy number is determined to be 2, 1, and 4 for NSiGFP#1, #5, and #17 lines, based on the intensity ratio between the TG and the null allele. (b) Two NSmGFP lines (#1 and #14) were established. Their transgene copy numbers are both determined to be one based on the intensity ratio between the TG (3.6 kb) and the NS fragments (2.6kb) in the (NS+/+; TG+/−) mice. Southern blots were digested with Bgl2 and hybridized with the left-arm probe. (c) The integrity of the BAC transgene was assessed by qPCR assays using primers that recognized the BAC ends (end-1 and end-2) and the middle portion of the nucleostemin gene (NS). Our data indicates that the end of the transgene is better preserved in the multi-copy lines (NSiGFP#1 and #17) than in the single-copy lines (NSiGFP#5, NSmGFP#1, and NSmGFP#14).
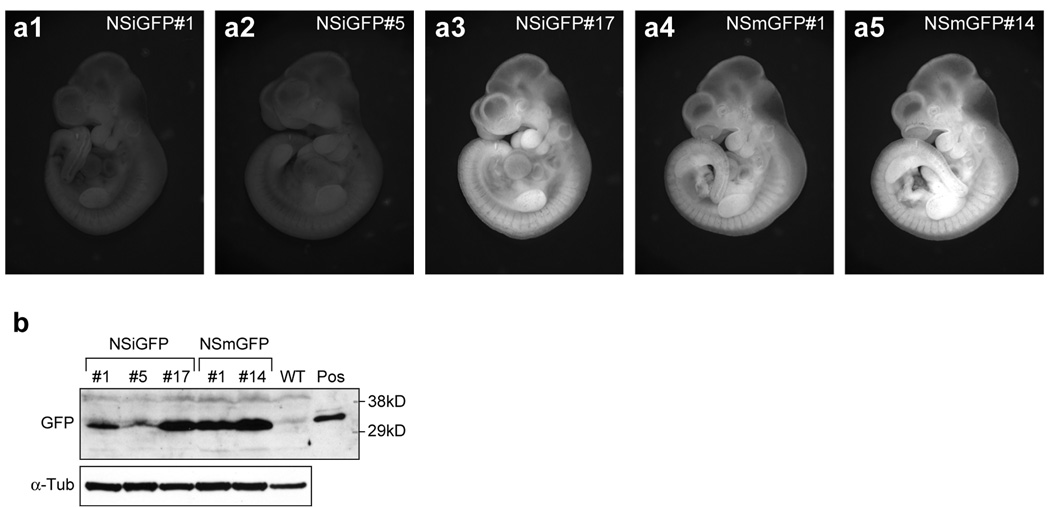
The GFP protein expression levels of the NSiGFP and NSmGFP mice were measured by direct visualization of the GFP signal in live embryos (Fig. 3a). The NSiGFP#17 and NSmGFP#14 embryos at day 10.5 displayed the strongest GFP signal, followed by the NSmGFP#1 embryo. The NSiGFP#1 and NSiGFP#5 embryos had weak GFP signals. The relative amounts of the GFP protein in these five transgenic lines were confirmed quantitatively by western blots (Fig. 3b). We demonstrated that the NSiGFP#17, NSmGFP#1, and NSmGFP#14 embryos expressed the most GFP proteins, followed by the NSiGFP#1 and NSiGFP#5 embryos. Notably, western blot detected more GFP proteins in the NSiGFP#1 embryo than in the NSiGFP#5 embryo, which is consistent with their transgene copy numbers.
Figure 3. The GFP signal is weaker in the NSiGFP embryos than in the NSmGFP embryos on a per transgene copy basis.
(a) Direct visualization of the GFP signal in the NSiGFP#1 (a1), NSiGFP#5 (a2), NSiGFP#17 (a3), NSmGFP#1 (a4), and NSmGFP#14 embryos (a5) at embryonic day 10.5. Images were captured using the same parameters (see Methods). (b) GFP protein expression levels in the E10.5 embryos of the five transgenic lines were measured by western blots using anti-GFP antibody (Molecular Probe). The GFP expression levels (arrow) in the NSmGFP embryos (one-copy) resemble that in the NSiGFP#17 embryo (4-copy). Anti-α-tubulin (α-Tub) immunoblot was used as a loading reference. WT, wild-type; Pos, GFP expression plasmid-transfected HEK-293 cell lysate as a positive control.
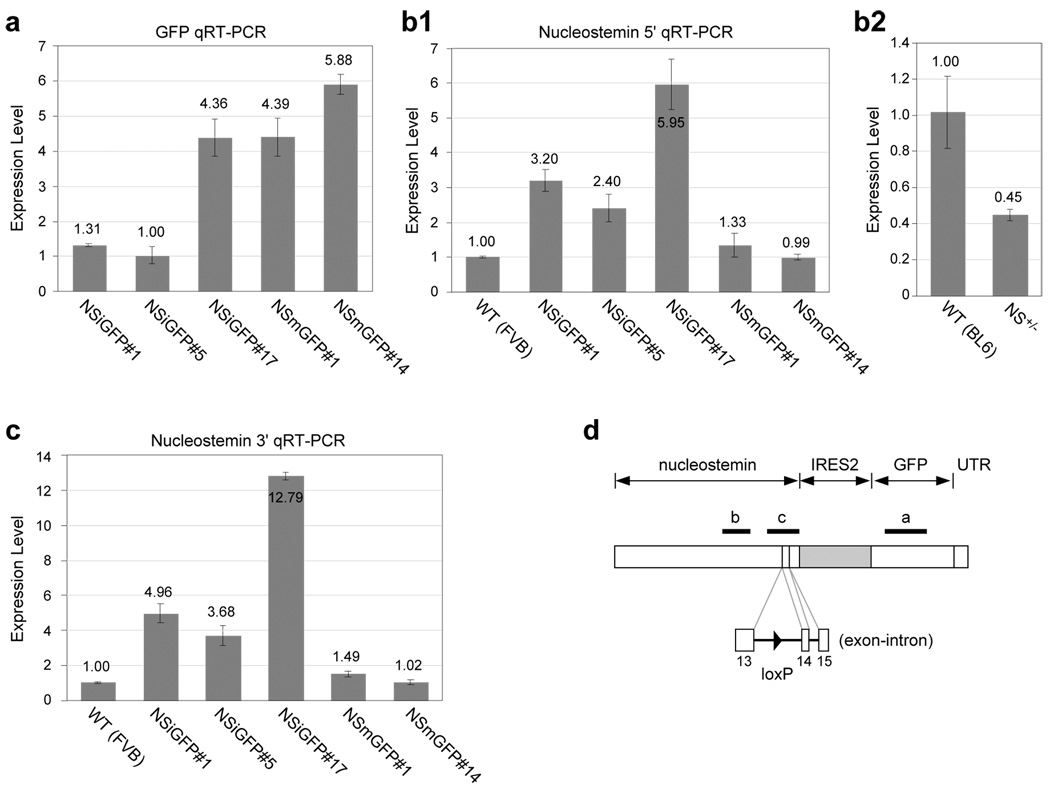
The low GFP protein level in the NSiGFP mice compared to the NSmGFP mice may be caused by inefficient translation of the second transgene following IRES2. To test this idea, we measured the amount of the GFP RNAs in the adult testis. Quantitative reverse-transcription-PCR (qRT-PCR) showed that the relative levels of the GFP RNAs were 1.3 (NSiGFP#1), 1.0 (NSiGFP#5), 4.4 (NSiGFP#17), 4.4 (NSmGFP#1), and 5.9 (NSmGFP#14). These numbers correlate with their GFP protein levels and indicate that the differences in the GFP protein between the NSiGFP and NSmGFP mice cannot be explained by the efficiency of IRES2. Next, we examined the possibility that the lower GFP RNA level in the NSiGFP mice compared to the NSmGFP mice may be caused by transcript instability, aberrant splicing, or premature termination. We reason that if the bicistronic RNA is unstable, the amount of nucleostemin RNA transcribed from one copy of the transgene will be less than that transcribed from one copy of the endogenous allele. Contrarily, our data showed that the nucleostemin RNA levels in the transgenic testis are 3.2 (NSiGFP#1), 2.4 (NSiGFP#5), 6.0 (NSiGFP#17), 1.3 (NSmGFP#1), and 1.0 (NSmGFP#14) times that in the wild-type testis (Fig. 4b1). As a control, we showed that the amount of nucleostemin RNA in the NS+/− testis is one half of that in the wild-type testis (Fig. 4b2). These results indicate that the amount of the nucleostemin RNA of the bicistronic message per transgene copy is as much or higher than that per endogenous nucleostemin allele, and that the nucleostemin expression from the NSmGFP transgene is abolished. To test the possibility of aberrant splicing, qRT-PCRs were conducted across the 13th intron where a loxP sequence was inserted (Fig. 4d). Our results showed that the expression levels of the 3’ end of nucleostemin RNA per transgene copy in the NSiGFP testis is more than that per endogenous nucleostemin allele in the wild-type testis (Fig. 4c), indicating that there is no aberrant splicing across the 13th intron.
Figure 4. Quantitative RT-PCR (qRT-PCR) measurements of the relative amounts of GFP and nucleostemin RNAs in the adult testes of transgenic mice.
The RNA expression levels of GFP, nucleostemin, and RNA polymerase II were measured by qRT-PCR using 1st stranded cDNAs synthesized from the adult testes of wild-type and transgenic (NS+/+; TG+/−) mice. (a) After normalization to the amount of RNA polymerase II, the relative levels of the GFP RNA are 1.3, 1.0, 4.4, 4.4, and 5.9 in the NSiGFP#1, NSiGFP#5, NSiGFP#17, NSmGFP#1, and NSmGFP#14 testes. The expression levels of the nucleostemin RNA transcript of these five transgenic lines relative to the wild-type mouse (FVB) were determined by qRT-PCR assays using primers that recognize the middle portion (b) or the 3’ end (c) of nucleostemin. The expression levels of the nucleostemin RNA were determined in the wild-type (C57/B6) and the NS+/− testis to provide a reference for the qPCR measurment (b2). (d) A schematic diagram of the bicistronic transgenic RNA and the regions detected by the qRT-PCR assay in Fig. 4a, 4b, and 4c (thick lines). The 13th intron with an engineered loxP site (arrowhead) is shown at the bottom.
In this report, we examined the expression efficiencies of two BAC-based transgenic designs. Our data showed that the GFP expression level is significantly lower in the bicistronic lines than in the ATG-fusion lines on a per transgene copy basis. Notably, the differences in the GFP protein level between these two models correlate with their GFP RNA levels, indicating that low GFP expression in the bicistronic mice cannot be attributed to IRES2 inefficiency. Further qRT-PCR analyses demonstrated that the amounts of the nucleostemin RNA transcribed from one copy of the transgene in the NSiGFP mice are more than that transcribed from a single endogenous allele, detected either in the middle or at the 3’ end of nucleostemin. Considering these results, we conclude that the reduced GFP expression in the bicistronic transgenics is caused by premature termination of the bicistronic transcript between nucleostemin and GFP. Due to the difficulty in detecting the GFP signal on sections, this study analyzed the transgene expression levels from the whole embryo. Given that the GFP signals in the NSiGFP and NSmGFP live embryos appear grossly identical and relatively wide-spread, it is unlikely that a restricted expression of the transgene in the NSiGFP mice compared to the NSmGFP mice is responsible for the difference in transgene expression between these two models. In summary, our work demonstrates that the ATG-fusion strategy has a clear advantage over the bicistronic design in avoiding target gene overexpression and in directing a high-level transgene expression.
METHODS
Isolation of BAC clones containing the nucleostemin locus
To obtain BAC clones containing the nucleostemin locus, the genomic position of nucleostemin was determined by the Ensembl program (www.ensembl.org). BAC clones containing this region were identified using the UCSC Genome Browser (genome.ucsc.edu), and obtained from the BACPAC Resources (bacpac.chori.org).
Preparation of BAC vector for homologous recombination
As the first step to construct the targeting vector, the loxP site in the pBACe3.6 vector was replaced by a DNA fragment that contains an ampicillin selection cassette and two flanking recombineering arms of 49bp (RT553, underlined) and 47bp (RT554, underlined) using the BAC recombineering approach. This DNA fragment was generated by a PCR reaction using primer pairs, RT553 and RT554, and the pTamp vector as the template (Lee et al., 2001). Sequence information for primers is as follows: RT553: 5’-ATC CAC AGG ACG GGT GTG GTC GCC ATG ATC GCG TAG TCG ATA GTG GCT CTT AGA CGT CAG GTG GCA C-3’; RT554: 5’-CGG CAC GTT AAC CGG GCT GCA TCC GAT GCA AGT GTG TCG CTG TCG ACC TCA CGT TAA GGG ATT TTG GTC-3’.
Modification of BAC clone by homologous recombination in E. coli
A BAC modification strategy was used as described in previous studies with slight changes (Lee et al., 2001; Liu et al., 2003). Host cells (EL350) were grown to mid-log phase (OD600=0.4–0.5) and induced to express red recombinase by incubation at 42C for 15 minutes. Linearized recombination cassette, free of vector backbone sequences, was transformed into the recombination-ready EL350 cells by electroporation. After incubation for 1 hour at 30C, cells were plated onto LB plates containing kanamycin (12.5ng/ml) and ampicillin (25ng/ml) antibiotics. The correctly recombined BAC clones were identified by PCR assays and excised of their drug selection cassettes in EL350 cells by arabinose-induced Cre recombination.
Generation of BAC transgenic mice
BAC DNA for microinjection was prepared using the Marligen High-Purity column and linearized by the PI-SceI enzyme that cuts specifically in the pBACe3.6 vector. Digested DNAs were purified by phenol-chloroform extraction and ethanol precipitation, and injected at a concentration of 2ng/ul into fertilized eggs derived from FVB mice in the transgenic core of the Center for Environmental and Rural Health. PCR analyses were used to screen for transgene-positive offspring. The transgenic lines were maintained in the FVB genetic background.
Visualization of GFP signals, image acquisition, and western blots
Embryos were dissected in cold phosphate-buffered saline and viewed immediately under a Zeiss stereoscope Discovery V12. Green fluorescent images were captured using the multidimensional acquisition function in the Axiovision Rel 4.5 software with a 10-second exposure time. Six images were collected from the top to the bottom of the embryo and stacked into one final image using the CZfocus MFC application. For western quantification of GFP protein, whole embryo lysates (E10.5) were extracted in sample buffer, fractionated by 10% sodium dodecyl sulfate-polyacrylamide gel electrophoresis (SDS-PAGE), and transferred to Immobilon-P membrane (Millipore). Specific signals were detected by rabbit anti-GFP antibody at 1-to-4000 dilutions (Molecular Probes) and horseradish peroxidase-conjugated secondary antibody.
Quantitative PCR (qPCR) analyses
For genomic qPCR assay, BAC ends were amplified from 10ng of genomic DNAs with 0.5uM of primers and 100uM of dNTPs. The ΔC(t) values between the target fragment and RNA polymerase II were determined using the MyiQ single-color real-time PCR detection system and supermix SYBR green reagent. The ΔΔC(t) values between transgenic and wild-type mice were measured from three technical replicates and two biological replicates, and used to calculate their relative expression levels. For qRT-PCR analysis, DNaseI-treated total RNAs (5ug) were isolated from adult testis, and reversed transcribed into 1st strand cDNAs using random hexamers and M-MLV reverse transcriptase. Target cDNAs were amplified from 5ul of the diluted cDNA samples (100X for GFP and nucleostemin, and 500X for RNA polymerase II) with 0.5uM of gene-specific primers and 100uM of dNTPs. For qPCR, the ΔC(t) values between the GFP (or nucleostemin) and RNA polymerase II and the ΔΔC(t) values between different transgenic lines were determined as described above. Primer sequences are listed as follows: RP23-102M6 end-1 (59C): 5’-GCT CAC TCA TGG ACC C-3’ and 5’-GGG CAT ACA AGA TGC TC-3’; RP23-102M6 end-2 (59C): 5’-GCT GCC TAA GAT GAA GG-3’ and 5’-CAT TGG ACA GAC AGC AAC-3’; GFP (59C): 5’-CAA GCT GAC CCT GAA GTT CAT C-3’ and 5’-GTT GTG GCG GAT CTT GAA GTT C-3’; nucleostemin-1 (59C, Fig. 4b), 5’-CAA GCA TTG AGG AAC TAA GAC-3’ and 5’-GCA ATA GTA ACC TAA TGA GGC; nucleostemin-2 (59C, Fig. 4c): 5’-CTG ACA AAT GGA ATA CTA GAC G-3’ and 5’-TTA TAT ATA ATC TGT GGT GAA GTC-3’; RNA polymerase II (59C): 5’-GCC ATG CAG AAG TCT GGC CGT CCC CTC AAG-3’ and 5’-CTT ATA GCC AGT CTG CAG ATG AAG GTC AC-3’.
ACKNOWLEDGEMENTS
We thank Dr. E-Chiang Lee, Neal Copeland, and Jim Martin for providing the EL350 host cells and pTamp plasmid. We also thank Paul Swinton for pronucleus injection and Antonio Baldini for sharing the imaging system. This work is supported by R01 CA113750-01 to R.Y.T.
REFERENCES
- Antoch MP, Song EJ, Chang AM, Vitaterna MH, Zhao Y, Wilsbacher LD, Sangoram AM, King DP, Pinto LH, Takahashi JS. Functional identification of the mouse circadian Clock gene by transgenic BAC rescue. Cell. 1997;89:655–667. doi: 10.1016/s0092-8674(00)80246-9. [DOI] [PMC free article] [PubMed] [Google Scholar]
- Baddoo M, Hill K, Wilkinson R, Gaupp D, Hughes C, Kopen GC, Phinney DG. Characterization of mesenchymal stem cells isolated from murine bone marrow by negative selection. J Cell Biochem. 2003;89:1235–1249. doi: 10.1002/jcb.10594. [DOI] [PubMed] [Google Scholar]
- Chi X, Zhang SX, Yu W, DeMayo FJ, Rosenberg SM, Schwartz RJ. Expression of Nkx2-5-GFP bacterial artificial chromosome transgenic mice closely resembles endogenous Nkx2-5 gene activity. Genesis. 2003;35:220–226. doi: 10.1002/gene.10181. [DOI] [PubMed] [Google Scholar]
- Giraldo P, Montoliu L. Size matters: use of YACs, BACs and PACs in transgenic animals. Transgenic Res. 2001;10:83–103. doi: 10.1023/a:1008918913249. [DOI] [PubMed] [Google Scholar]
- Heintz N. Analysis of mammalian central nervous system gene expression and function using bacterial artificial chromosome-mediated transgenesis. Hum Mol Genet. 2000;9:937–943. doi: 10.1093/hmg/9.6.937. [DOI] [PubMed] [Google Scholar]
- Lee EC, Yu D, Martinez de Velasco J, Tessarollo L, Swing DA, Court DL, Jenkins NA, Copeland NG. A highly efficient Escherichia coli-based chromosome engineering system adapted for recombinogenic targeting and subcloning of BAC DNA. Genomics. 2001;73:56–65. doi: 10.1006/geno.2000.6451. [DOI] [PubMed] [Google Scholar]
- Liu P, Jenkins NA, Copeland NG. A highly efficient recombineering-based method for generating conditional knockout mutations. Genome Res. 2003;13:476–484. doi: 10.1101/gr.749203. [DOI] [PMC free article] [PubMed] [Google Scholar]
- Meng L, Yasumoto H, Tsai RY. Multiple controls regulate nucleostemin partitioning between nucleolus and nucleoplasm. J Cell Sci. 2006;119:5124–5136. doi: 10.1242/jcs.03292. [DOI] [PMC free article] [PubMed] [Google Scholar]
- Probst FJ, Fridell RA, Raphael Y, Saunders TL, Wang A, Liang Y, Morell RJ, Touchman JW, Lyons RH, Noben-Trauth K, Friedman TB, Camper SA. Correction of deafness in shaker-2 mice by an unconventional myosin in a BAC transgene. Science. 1998;280:1444–1447. doi: 10.1126/science.280.5368.1444. [DOI] [PubMed] [Google Scholar]
- Reizis B, Leder P. The upstream enhancer is necessary and sufficient for the expression of the pre-T cell receptor alpha gene in immature T lymphocytes. J Exp Med. 2001;194:979–990. doi: 10.1084/jem.194.7.979. [DOI] [PMC free article] [PubMed] [Google Scholar]
- Tsai RY, McKay RD. A nucleolar mechanism controlling cell proliferation in stem cells and cancer cells. Genes Dev. 2002;16:2991–3003. doi: 10.1101/gad.55671. [DOI] [PMC free article] [PubMed] [Google Scholar]
- Tsai RY, McKay RD. A multistep, GTP-driven mechanism controlling the dynamic cycling of nucleostemin. J Cell Biol. 2005;168:179–184. doi: 10.1083/jcb.200409053. [DOI] [PMC free article] [PubMed] [Google Scholar]
- Yang XW, Model P, Heintz N. Homologous recombination based modification in Escherichia coli and germline transmission in transgenic mice of a bacterial artificial chromosome. Nat Biotechnol. 1997;15:859–865. doi: 10.1038/nbt0997-859. [DOI] [PubMed] [Google Scholar]
- Yang XW, Wynder C, Doughty ML, Heintz N. BAC-mediated gene-dosage analysis reveals a role for Zipro1 (Ru49/Zfp38) in progenitor cell proliferation in cerebellum and skin. Nat Genet. 1999;22:327–335. doi: 10.1038/11896. [DOI] [PubMed] [Google Scholar]
- Yu W, Misulovin Z, Suh H, Hardy RR, Jankovic M, Yannoutsos N, Nussenzweig MC. Coordinate regulation of RAG1 and RAG2 by cell type-specific DNA elements 5' of RAG2. Science. 1999;285:1080–1084. doi: 10.1126/science.285.5430.1080. [DOI] [PubMed] [Google Scholar]
- Zhu Q, Yasumoto H, Tsai RY. Nucleostemin Delays Cellular Senescence and Negatively Regulates TRF1 Protein Stability. Mol Cell Biol. 2006;26:9279–9290. doi: 10.1128/MCB.00724-06. [DOI] [PMC free article] [PubMed] [Google Scholar]


