

Abstract
Background
Abnormalities in intracellular calcium (Ca) cycling during Ca overload can cause triggered activity because spontaneous calcium release (SCR) activates sufficient Ca-sensitive inward currents to induce delayed afterdepolarizations (DADs). However, little is known about the mechanisms relating SCR and triggered activity on the tissue scale.
Methods
Laser scanning confocal microscopy was used to measure the spatiotemporal properties of SCR within large myocyte populations in intact rat heart. Computer simulations were used to predict how these properties of SCR determine DAD magnitude.
Results
We measured the average and standard deviation of the latency distribution of SCR within a large population of myocytes in intact tissue. We find that as external [Ca] is increased, and with faster pacing rates, the average and standard deviation of the latency distribution decreases substantially. This result demonstrates that the timing of SCR occurs with less variability as the SR Ca load is increased, causing more sites to release Ca within each cell. We then applied a mathematical model of subcellular Ca cycling to show that a decrease in SCR variability leads to a higher DAD amplitude, and is dictated by the rate of SR Ca refilling following an action potential.
Conclusions
Our results demonstrate that the variability of the timing of SCR in a population of cells in tissue decreases with SR load and is dictated by the time course of the SR Ca content.
Keywords: Arrhythmia, Ca2+ sparks, Ca2+ transients, Sarcoplasmic reticulum
INTRODUCTION
Delayed afterdepolarizations (DADs) were identified in the early 1970’s as the cause of various triggered arrhythmias1–4. It was subsequently reported that DADs themselves are caused by Ca-sensitive inward currents, primarily forward mode Na-Ca exchange (NCX) activity, in response to spontaneous Ca release (SCR) from the SR, which typically occurs under Ca overload conditions5–10. Further studies demonstrated that SCR 11–13 is due to spontaneous Ca sparks which induce subcellular Ca waves. More recently, using confocal microscopy, measurements of membrane potential and Ca have been made in individual myocytes in the intact heart under Ca overload conditions. This study14 showed that the latency to the first wave was the best predictor of DAD magnitude in individual myocytes and that faster heart rates shortened latencies and increased DADs in parallel. Triggered beats occurred as the result of faster waves and shorter latencies among myocytes suggesting that shorter latencies occur during Ca overload and that DADs were the result of shortened latencies, just as anticipated from early microelectrode1,2,4 and voltage clamp5,15,16 studies. However, despite this and other extensive studies of the properties of SCR, the mechanisms which determine the timing of SCR within single cells and within a population of cells in intact tissue are not clear,. A deeper understanding of these mechanisms is essential to understanding the emergence of Ca-mediated triggered arrhythmias in cardiac tissue.
The precise relationship between SCR and the formation of triggered activity in tissue is not well understood. One major reason is that depolarization in tissue is dependent on the activity of the population of cells within a volume dictated by the electrotonic length constant. Thus, the timing and morphology of a DAD is dictated by the average behavior of several hundreds to thousands of cells in tissue. Furthermore, the timing of SCR within an individual cell is a stochastic process, which is likely dictated by the random fluctuations of RyR channels and the local subcellular Ca concentration. Thus, to fully understand the timing of triggered activity in heart tissue, it is necessary to quantify the statistical distribution of SCR within a cell, and also across a population of cells in myocardium. In particular, it is necessary to quantify the relative timing of SCR between cells, and to determine the factors that dictate this timing. These studies will be crucial to uncover the underlying mechanisms that determine the timing of Ca-mediated triggered activity in cardiac tissue.
In this study, we used laser scanning confocal microscopy to image subcellular Ca events within individual myocytes and also within a population of cells in the intact heart. The goal was to understand the mechanism by which SCR across a wide cell population can summate to induce triggered activity on the tissue scale. To accomplish this, we measured key statistical properties of SCR across a large population of cells and under different SR loading conditions. In particular, we measured (i) the number and timing of spontaneous Ca waves which summate to form an episode of SCR within a single cell and (ii) the first latency distribution of SCR across a population of cells in the intact heart tissue. In order to interpret our experimental data, we also implemented a detailed mathematical model of subcellular Ca at the cell and multi-cell levels. We used this combination of experimental and computational approaches to investigate the underlying mechanisms which dictate the timing of Ca-mediated triggered activity in the heart.
METHODS
Confocal imaging in whole rat heart
Detailed methods used in this study have been provided in recent publications and are included in the online Supplementary Material17–19. Briefly, male Sprague-Dawley rats were used in this study according to animal use protocols approved by the Northwestern University IACUC and to NIH guidelines. Each heart was removed and placed on a Langendorff apparatus in an experimental chamber on the stage of a Zeiss LSM510 laser scanning confocal microscope (26°C). The heart was loaded with fluo-4AM (10–15µM/L, 1hr) then washed in normal solution and recirculated with cytochalasin-D (50µM/L) and blebbistatin (7µM/L) to stop contraction. Line scan imaging of single cells and of multicellular sites was then initiated (1.92msec/scan, 512 pixels/line) at basal pacing (basic cycle length, BCL-500msec) or during rapid pacing (BCL=200msec) for 10sec followed by a 3-sec pause. Each rapid pacing protocol was repeated 5–8 times at each test BCL in order to obtain accurate estimates of the mean and SD of the latency to first SCR. Extracellular [Ca] ([Ca]e) was increased sequentially by 1mM/L (until arrhythmias developed) and the pacing protocols were repeated at each test BCL. The timing from the last stimulated beat to the peak of each wave was measured using Zeiss LSM software in each myocyte for all replicate pacing trials.
Computer modeling
To model the spatiotemporal distribution of calcium in cardiac cells, we implemented a recently developed mathematical model developed by Restrepo et al.20. The cardiac cell is represented as a collection of spatially distributed subcellular compartments which contain key elements of the Ca cycling machinery. Each element or Ca release unit (CRU) contains 1–5 L-type Ca channels and a cluster of 100 RyR channels. The stochastic dynamics of ion channels are simulated by computing the transition probabilities using experimentally based rate constants. To describe subcellular Ca dynamics, we model a cell as a linear array of 200 CRUs which are diffusively coupled. Details of the mathematical model are given in Chen et al.21.
RESULTS
Experimental Studies
Characteristics of spontaneous Ca release in individual myocytes in the intact heart
In the first series of experiments, we measured the characteristics of SCR under conditions of increasing SR Ca load, by increasing both [Ca]e and pacing rate. Figure 1A–C shows linescan images recorded from single myocytes in whole rat hearts paced at a BCL=500ms at [Ca]e of 4, 5 and 6mM/L. Each image was recorded along the long axis of a single myocyte in the intact heart. Average fluorescence intensity is shown below each image. Figure 1D–F shows results at BCL=200ms at the same [Ca]e. From these images, we can infer basic properties of SCR as a function of increasing SR load. First, SCR occurs as Ca waves which originate at distinct sources or initiation sites in the cell. We refer to these wave initiation sites as spontaneous Ca release sources (SCRS). Second, once a Ca wave is initiated, it propagates until it collides either with the cell boundary or with waves originating from other SCRS. Therefore, SCR can be divided into distinct episodes of wave initiation and propagation. For example, in Figure 1C where intermediate Ca overload is induced at high [Ca]e but low heart rate, SCR consists of one set of waves originating from two SCRS followed by a Ca wave from a single source that occurs after about 1000ms. In contrast, when Ca overload is maximal due to high [Ca]e and rapid pacing (Figure 1F), four distinct SCR episodes occur at intervals of roughly 500ms. We will refer to an episode of SCR as a single occurrence of wave initiation, propagation and extinction. We found that, as [Ca]e was increased, there were distinct changes in the subcellular Ca release activity including an increase in the number of SCRS for all episodes of SCR and a decreased coupling interval from the last stimulated beat to the first SCRS. Note, however, that the peak average fluorescence of each Ca wave (red vertical lines) occurs earlier with increasing Ca overload induced by the combination of high [Ca]e and rapid pacing. In addition, the interval between episodes of SCR also decreased as Ca overload increased, especially during rapid pacing. When we measured the number of initiation sites and propagation velocity for each wave, we found that increasing both [Ca]e and heart rate increased both wave properties. The summary data in Figure 2A–B show that the number of initiation sites increases significantly as [Ca]e increases, an effect that is exaggerated when SR load is further increased by rapid pacing. At slower pacing (BCL=500msec), there seems to be a plateau effect in which the number of sites no longer increases between [Ca]e = 5 and 6mM/L. Furthermore, the velocity of wave propagation increases with increasing SR Ca load, an effect that is more pronounced when additional SR loading is induced by rapid pacing (Figure 2C–D).
Figure 1. Linescan images of SCR waves in single cells recorded in whole rat heart.

Each image was recorded along the long axis of a single myocyte in the intact heart. Panels A–C show linescan images at BCL=500msec with the last two stimulated responses followed by a pause at [Ca]e = 4, 5 and 6mM/L, respectively. Panels D–F show results at BCL=200msec (pause following last 5 stimulated beats) at their respective [Ca]e. Average fluorescence profiles are shown below each image with vertical red dashed lines indicating timing of peak fluorescence and ECG recordings are shown at the bottom of each panel. Red arrows indicate the peak of DAD on the ECG.
Figure 2. Summary of properties of SCR in single cells.
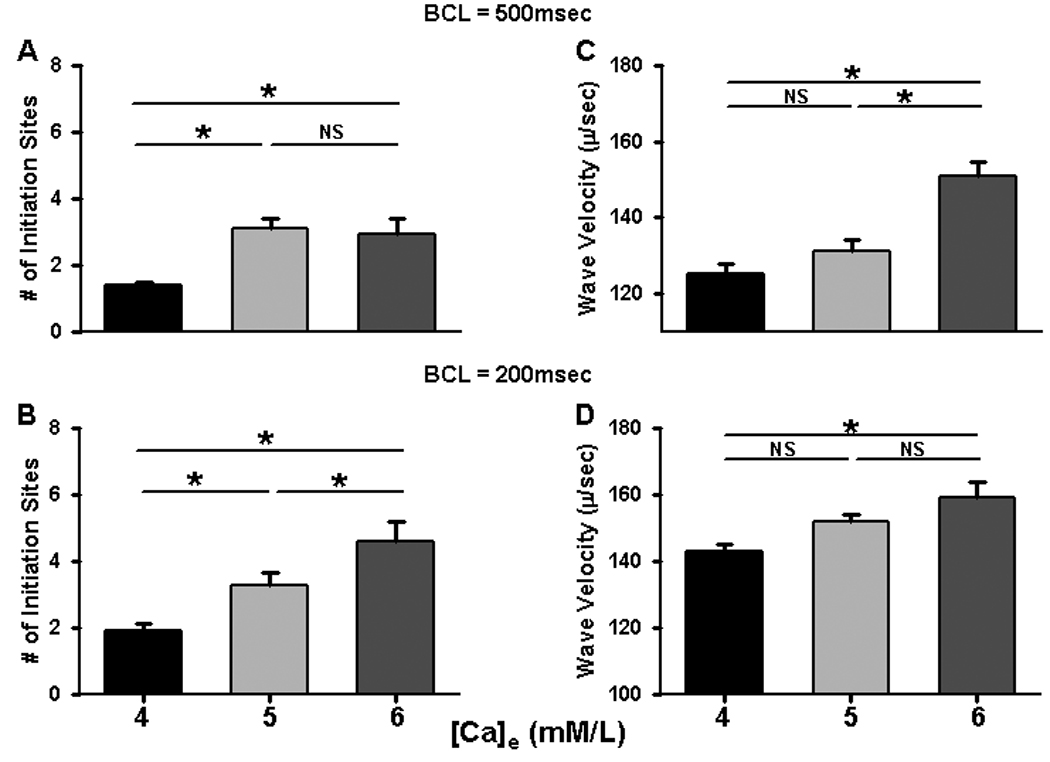
Panels A–B summarize data about Ca wave velocity during basal and rapid pacing in myocytes in situ at different [Ca]e. Panels C–D summarize showing increase in the number of initiations sites recorded with increasing [Ca]e during basal and rapid pacing. Results were obtained from 3–5 hearts and 6–22 myocytes for each condition.
The timing of SCR in a population of myocytes in intact heart
In order to investigate the properties of SCR at the multicellular level, we performed transverse line scan recordings in order to image Ca cycling behavior in a large population of myocytes. In this way, we could record the spatiotemporal properties of SCR simultaneously in 10–12 cells per site, and then from multiple sites in each heart. Figure 3A–C shows a transverse recording of the last stimulated Ca transient following pacing at BCL=500msec, with the average fluorescence intensity profile shown below. Each image was recorded across the short axis of each myocyte (separated by dotted white lines) in the intact heart. At [Ca]e=4 mM/L (Figure 3A), a few myocytes demonstrate very late waves after pacing. As [Ca]e was increased to 5 mM/L and 6 mM/L (Figures 3B–C), more cells demonstrated SCR and the latency to the first wave was decreased. The time to peak of the average fluorescence intensity (red vertical line) was also reduced with increasing [Ca]e. Figures 3D–F show results from a heart paced at BCL=200msec with increasing [Ca]e. Following the last 2 paced beats, most cells at [Ca]e=4 mM/L show SCR events that are late and occur with a high degree of variability. At [Ca]e=5 mM/L, SCR in most cells occurs with a shorter first latency and there is a greater coordination among myocytes so that time to peak of the average fluorescence occurs earlier. At [Ca]=6mM/L, first latencies are reduced further and the timing of SCR occurs with less variability. Notice also that an early extrasystole (*) interrupts SCR in all cells in the field of study. It is not possible to determine the site of origin of the extrasystole but note that it coincides with the point when SCR occurs in most of the cells in the experimental field, indicating that either the site of origin is nearby or that SCR is occurring with fairly uniform timing throughout the heart. Either way, these results indicate that increasing SR Ca load causes the synchronization of SCR events among myocytes of intact heart by the same processes observed in individual cells.
Figure 3. Linescan images of SCR waves in multicellular recordings of ventricular myocytes in whole rat heart.

Linescan images of SCR waves in individual cells recorded with the scan line placed transversely across multiple cells on the epicardial surface. Panels A–C show linescan images at BCL=500msec with the last stimulated beat followed by a pause at [Ca]e = 4, 5 and 6mM/L, respectively. Panels D–F show results at BCL=200msec at the respective [Ca]e. White dotted lines separate individual myocytes. Average fluorescence profiles are shown below each image with vertical red dashed lines indicating timing of peak fluorescence. * denotes an extrasystole.
Results summarizing timing of SCR are shown in Table 1. The data demonstrate that the latency to the first SCR waves decreases and the SD of the first latency also decreases as [Ca]e and pacing rate increase. The net result is that SCR among many myocytes occurs earlier and over a shorter period of time as SR Ca load increases. The data also represent the single cell behavior shown in Figure 1 and summarize population behavior of these individual cells among many cells in intact myocardium. These features of SCR, as a function of increasing SR Ca overload, will have the effect of delivering the greatest amount of cellular Ca to the greatest number of cells over the shortest period of time and will therefore determine the spatiotemporal integral of Ca delivered to the NCX and the magnitude of the resulting DAD.
Table 1.
Summary of Latencies and SD for SCR in Whole Heart (in msec).
| [Ca]e (mM/L) |
Mean Latency at BCL=500msec |
Mean Latency at BCL=200msec |
p < | SD of Latency at BCL=500msec |
SD of Latency at BCL=200msec |
p < |
|---|---|---|---|---|---|---|
| 4 | 1581±379 (24) |
821±35 (63) |
0.001 | 379±32 (24) |
155±11 (32) |
0.001 |
| 5 | 1481±65 (58) |
785±35 (89) |
0.001 | 333±21 (58) |
147±11 (89) |
0.001 |
| 6 | 1372±42* ** (56) |
551±17* ** (69) |
0.001 | 271±14* ** (56) |
103±6* ** (69) |
0.001 |
p<0.05 compared to 4mM/L
p<0.05 compared to 5mM/L
results were obtained from 5 hearts
The online video Figure S1 shows the timing of SCR during Ca overload induced by high [Ca]e (5mM/L) following rapid pacing. The first portion of the movie shows normal intracellular Ca transients in each myocyte in the field of view during pacing at BCL=500msec then during rapid pacing at BCL=200msec. After pacing is stopped, there is a brief pause after which all myocytes demonstrate waves that occur over a short period of time (several hundred milliseconds) after which episodes of SCR occur randomly among all cells. There is also a single extrasystole that occurs after SCR events stop. Pacing is then resumed for the last few seconds of the movie as demonstrated by the resumption of simultaneous activation of all myocytes in the field. This movie demonstrates clearly the fact that the first Ca waves occur with a short coupling interval and nearly simultaneously across many cells during SR Ca overload.
Timing of SCR at higher temperatures
Since most physiological processes are greatly accelerated at warm temperatures, we wanted to investigate how the timing of SCR is affected at normal body temperature. Since the extrusion of the fluo-4AM is greatly enhanced at physiological temperatures, we chose to study SCR at a temperature that was nearly physiological (33°C) that allowed recordings of sufficient duration and signal strength to permit accurate measurements of SCR. Figure 4A shows confocal images from one heart in which [Ca]e was increased from 4–7mM/L at both BCL=500msec (Panels a–d) and BCL=200msec (Panels e–h). At the lowest level of Ca loading (Panel a), there were no Ca waves observed in any myocytes after cessation of pacing. As [Ca]e increased, more cells showed SCR events that became progressively earlier and with less variability until an extrasystole (*) was activated at the [Ca]e=7mM/L. At the higher heart rate (BCL=200msec), every myocyte in the recording site gave at least one Ca wave even at [Ca]e=4mM/L. As [Ca]e was increased to 5–7mM/L (Panels f–g) SCR events occurred earlier and with less variability, often resulting in extrasystoles that occur earlier with increasing Ca load. At the highest level of Ca loading ([Ca]e=7mM/L, BCL=200msec, Panel h), SCR occurs extremely early and with such little variability that the result is an early extrasystole immediately (within 350msec) of cessation of pacing. The summary data for all myocytes in Figure 4B shows results that are nearly identical qualitatively to those presented at the lower temperature (Table 1). Since there were relatively few SCR waves at all [Ca]e when BCL=500msec (Figure 4A), there were not enough events to analyze statistically so only the results at BCL=200msec are summarized in the table. Our results demonstrate that the decrease in the mean and variability of the timing for SCR with Ca load are nearly identical to those obtained at lower temperature but are greatly exaggerated at physiological temperature which would have an enormous impact on the probability of triggered beats during SR Ca overload.
Figure 4. Increase in SCR with increased [Ca]e and heart rate at 33°C.

A: Panels a–d show confocal images recorded of the last two paced beats at BCL=500msec followed by a pause before resumption of pacing at each [Ca]e indicated. Panels e–h show recordings at the same [Ca]e but at BCL=200msec. * denotes extrasystoles. B: Summary of mean latency and SD of latency with increasing [Ca]e at 33°C. Results were obtained 12–19 myocytes in 2 hearts.
Numerical Simulation Studies
The first latency distribution for SCR following an AP
Here, we apply our mathematical model of the spatial distribution of subcellular Ca to uncover the underlying mechanisms which dictate the timing of SCR in cells and tissue. This model has been previously applied to understand the role of RyR coupled gating in the formation of SCR22. In this context we apply our model to investigate the shape of the first latency distribution to spontaneous Ca sparks. In Figure 5A, we show a space time plot of subcellular Ca and voltage during a simulated episode of SCR within a single cell containing 200 CRUs. In this simulation we see that, following the last action potential (AP), an episode of SCR occurs in which spontaneous Ca sparks at two CRUs (yellow arrows) initiate Ca waves which propagate along the cell. In order to characterize the timing of SCR within a single cell, we measure the time, denoted by T, from the AP upstroke of the last stimulated beat to the first spontaneous Ca spark which initiates an episode of SCR (see large orange arrow in Figure 5A). In order to quantify this timing we measured the first latency distribution denoted as P(T), so that P(T)dT is the probability that the first spontaneous Ca spark occurs in the time interval T ,T + dT, within our spatially distributed cell model. To model the experimental results we measured the probability distribution P(T) following an action potential. To compute this probability distribution, our protocol was, to fix the [Ca]e and then pace the cell to steady state (20 beats) at a cycle length of 500ms, just as in the experiments described above. After the last paced beat, we measured the time T at which the first spontaneous Ca wave occurred. In Figure 5B we plot the distribution P(T) for external Ca concentrations of 4 ,5, and 6mM/L. In Figure 5C–D we plot the mean and SD of the first latency distribution as a function of external Ca. These results show that both the mean and SD of the first latency distribution decrease as [Ca]e is increased. Thus, as in the experiments, the timing variability of SCR decreases substantially with increasing SR Ca content.
Figure 5. First latency distribution of spontaneous Ca sparks.

(A) Action potential and corresponding space-time plot of subcellular Ca. The yellow arrows denote spontaneous Ca sparks which transition to Ca waves which form the first episode of SCR. Voltage deflection during the episode of SCR is shown in the inset. (B) First latency distribution of spontaneous Ca sparks in our simulated cell. The time T is the time from the previous AP upstroke to the first spontaneous Ca spark. (C) Average and (D) standard deviation of the first latency distribution as a function of external Ca concentration.
The SR load dependence of SCR
In order to understand the relationship between [Ca]e and the shape of the first latency distribution, we note that the timing of SCR is dictated by the statistical behavior of spontaneous Ca sparks following an AP. Thus, we first investigated the factors which control the probability that a single CRU will fire spontaneously. Our simulations demonstrate that the most important factor that regulates the timing of spontaneous Ca sparks is the SR load. As a starting point, we first evaluated the functional relationship between [Ca]e and the SR [Ca] ([Ca]sr). In Figure 6A we plot the steady state relationship between [Ca]e and [Ca]sr at a cycle length of 500ms. As expected, we found that the steady state [Ca]sr is directly proportional to the [Ca]e. Thus, varying [Ca]e is effectively the same as changing the SR Ca content.
Figure 6. SR load dependence of SCR.

(A) Relationship between steady state SR load and external Ca concentration ([Ca]e). Here, the cell is paced at a cycle length of 500ms. (B) First latency distribution of spontaneous Ca sparks at fixed SR load. (C) Plot of the rate of spontaneous Ca sparks Γ as a function of SR Ca load. (D) Time course of the SR Ca load following an AP for a typical simulation run.
The previous results (Figure 5B) reveal that the timing of SCR is dependent on the SR load. However, it is difficult to discern the precise relationship since the SR load is changing in time following cell wide release triggered by the AP. Thus, we have designed a set of simulations in order to compute the first latency distribution of SCR at fixed SR load. To investigate this relationship, our protocol was to pace the cell for 20 beats (BCL=500ms) until steady state is reached. We then measured the maximum [Ca]sr and then clamped the SR load at that concentration. Holding the SR load fixed, we then proceeded to measure the timing of SCR. In this way we could evaluate the first latency distribution of SCR at a fixed SR concentration which corresponds to steady state. In Figure 6B we plot the first latency distribution of spontaneous Ca sparks in the absence of an AP, and when the SR load was held constant. Here, we see that the first latency distribution can be well approximated by an exponential distribution P(T) = Γ exp(−ΓT), where the quantity Γ gives a measure of the rate at which spontaneous Ca sparks are formed in the cell, i.e. the quantity Γdt gives the probability that a spontaneous Ca spark is formed in the cell within a given time interval dt. To estimate the rate Γ we fit an exponential curve to the distributions shown in Figure 6B and in Figure 6C we plot Γ as a function of SR load. This plot indicates that the spontaneous spark rate increases rapidly with SR Ca load.
Figure 6B & 6C shows that the first latency distribution of spontaneous Ca sparks in a cell is extremely sensitive to the SR load. Thus, to understand the shape of P(T) (Figure 6A), it is necessary to track the time course of the SR load following an AP. In Figure 6D, we plot the time course of the SR Ca content during a 2500ms pause after the 20th paced beat at a pacing cycle length of 500ms. This shows that as the initial SR Ca concentration ([Ca]sr) is increased, the rate at which Ca is pumped back into the SR and the maximum [Ca]sr both increase. This result implies that the average and SD of the first latency distribution P(T) decrease with increasing initial SR load, because more spontaneous Ca sparks occur earlier and with less variability owing to the faster SR recovery rate at increasing SR loads. Furthermore, we also note that Figure 5B indicates that the first latency distribution for [Ca]e=4mM/L rises earlier than at [Ca]e=6mM/L. This result is explained by the fact that there is greater SR depletion when the initial SR load is larger. Thus, the [Ca]sr starts at a higher value following depletion at [Ca]e=4mM/L than it does at [Ca]e=6mM/L. Therefore, spontaneous Ca sparks occur earlier when the SR is depleted at lower concentrations. These results indicate that the time course of the SR load, following Ca depletion of the SR, dictates the shape of the first latency distribution.
DAD amplitude is correlated with the variability of timing of SCR
SCR is arrhythmogenic since Ca delivered to the cytoplasm activates Ca-sensitive inward currents which cause DADs. Here, we apply our mathematical model to explore the relationship between the timing variability of SCR events and the morphology of the corresponding DADs. In Figure 5A, we plot the voltage time course during SCR and indicate the corresponding voltage deflection δV (see inset), which is the voltage difference between the first minimum and maximum voltage after the last AP. In Figure 7, we plot the average voltage deflection (δV̅) as a function of the SD of the first latency distribution. To generate this curve, we compute the average voltage deflection for 500 independent simulations runs for a range of initial SR loads. This result indicates that the average voltage deflection increases rapidly as the SD of the first latency distribution decreases. Thus, DAD amplitude increases substantially as the variability in timing of spontaneous Ca sparks decreases.
Figure 7. Relationship between DAD amplitude and the first latency distribution.

Plot of average voltage deflection δV̅ during an episode of SCR vs. the standard deviation of the first latency distribution.
DISCUSSION
Timing of SCRS dictates rate of Ca release during SCR
In this paper, we have studied the spatiotemporal properties of subcellular Ca during SCR in the intact heart. At the single cell level, overall SCR is dictated by the number and timing of SCRS, and the propagation characteristics of Ca waves which emanate from these SCRS. Interestingly, in nearly all cases, we find that Ca waves propagate in the cell and only extinguish when they collide with waves that emanate from other SCRS, or when they collide with the cell boundary. Thus, our data indicate that essentially all CRUs in the cell are recruited during an episode of SCR, at least in normal heart. As the SR load is gradually increased by increasing [Ca]e, we found that the first episode of SCR occurs earlier following the last AP, and the time between distinct SCR episodes decreases. In addition, the number of SCRS per SCR episode and the velocity of Ca waves both increase. These findings shed light on the factors which govern the rate of Ca release into the cytoplasm during SCR. An examination of Figure 1 and the corresponding summary data (Table 1) reveal that the duration of an episode of SCR is extremely sensitive to [Ca]e and pacing rate. From these confocal images, we can estimate the duration of an episode of SCR by computing the time from the first SCRS to the time when the last wave was extinguished at the cell boundary. For example, the duration of the first episode of SCR in Figure 1C is roughly 500ms, while in Figure 1F, this time is substantially shortened to about 160ms. Here, the underlying mechanism for this substantial shortening of SCR duration is simply that more SCRS events occurred within a shorter time interval. Thus, the amount of time required to recruit most CRUs in the cell is substantially reduced. Note that wave propagation speed is not sufficient to explain this effect since the measured wave velocity was roughly the same in both cases. Therefore, our results suggest that the primary determinant of the rate of Ca release during SCR is the number and timing of SCRS in the cell.
Stochastic recruitment of SCRS is dictated by SR load
In order to determine the factors that dictate the timing of SCRS, we have applied a detailed mathematical model of subcellular Ca cycling. In this model, SCRS correspond to Ca sparks which occur at CRUs in which RyR channels make random transitions to the open state. When this occurs, Ca flux from the SR is sufficient to induce a spontaneous Ca spark. To characterize the timing of SCRS in our model, we measured the first latency distribution of spontaneous Ca sparks within our computational cell model of 200 CRUs. Our computational results are consistent with our experimental findings showing that SCRS events occur earlier and with less variability as the SR load is increased. The underlying mechanism for this effect is due to two basic features of SCR: (i) The rate at which spontaneous Ca sparks occurs within a cell increases rapidly with increasing SR load and (ii) the uptake rate of the SR and the diastolic SR Ca concentration are substantially increased at elevated cytoplasmic [Ca]. These two features alone are sufficient to explain why the average and SD of the first latency distribution both decrease with increasing SR load since the SR is depleted following an AP and therefore the probability that spontaneous Ca sparks occur is very low. However, since the recruitment rate of spontaneous Ca sparks increases rapidly with SR load (Figure 6B), SCR events rapidly begin to occur as the SR recovers to its maximum value. This behavior is consistent with our experimental results showing that rapid pacing is followed by a brief period where no SCR occurs before a burst of synchronized activity across myocytes (see online video (Video S1)). Therefore, the time over which SCRS occur will be dictated by the rate of recovery of the SR Ca content. Now, as the cell is loaded with more Ca, then the SR content increases and the amount of Ca released also increases, causing a larger rise in Ca concentration in the cytosol. Furthermore, the rate at which the SR content rises also increases because uptake pumps are upregulated by cytosolic Ca concentration23. Hence, increasing levels of Ca overload lead to a decrease in the average and SD of the first latency distribution, so that SCR events occur earlier and with less timing variability.
The role of SR load in the latency distribution of SCR
In this study, we applied confocal line scans in the transverse direction to measure the latency distribution of peak SCR across a multicellular population in our mapping field. Our main finding is that the average and the SD of the latency distribution decreased substantially with increasing SR load. Thus, SCR occurs earlier and occurs will lesser timing variability across the population of cells at higher SR loads. Interestingly, we found occasional extra beats at the highest load which roughly coincided with the average latency of the cells in the mapping field (example shown in Figure 3F). This result suggests that the timing of triggered activity is dictated by the timing variabililty of SCR. Thus, if the latency distribution is peaked around a well defined average time, then a DAD is likely to occur close to that time.
To explain the mechanism for this effect, we again refer to the first latency distribution of spontaneous Ca sparks computed using our mathematical model (Figure 5B). Since the timing of an SCR episode is determined by the timing of SCRS, then the timing of SCR across a population of cells is also dictated by the first latency distribution. Thus, the reduction of the average and SD of the first latency distribution also explains why SCR in the population of cells in the mapping field occurs earlier and with lesser variability as the SR load is increased. Therefore, as in the case of the single cell, the underlying mechanism for the decreased timing variability of SCR in a population of cells is due to the recovery rate of SR Ca load following an AP.
Role of cell-to-cell diffusion in the timing variability of SCR
Several studies have tried to address the issue of how SCR within individual myocytes can lead to DADs on the tissue scale. SCR in aggregates of connected Purkinje cells isolated from the ischemic zone of the post-infarction dog heart24,25 showed micro Ca transients (large non-propagated wavelets) that often triggered full waves, causing DADs to reach threshold. There was evidence that waves spread between cells but usually only over two additional cells, making Ca spread an unlikely means of synchronizing SCR among cells, although greater spread can occur in damaged myocardium26. In contrast, our work in whole heart show that waves can start in virtually any intracellular region and that the propagation of waves from cell to cell in normal myocardium must be an extremely rare event and is not likely to influence the timing distribution of SCR between cells. Indeed, as indicated by our numerical simulations, active diffusion of Ca between myocytes is not necessary to explain this effect. Note that we have confirmed that these properties of SCR represent intrinsic behavior of SR Ca release by performing experiments in isolated myocytes, where intercellular interactions are removed. These results were nearly identical to those obtained in whole heart (see Online Figure I and Table 1), confirming that the timing of SCR is dictated by intrinsic properties of Ca cycling.
Timing variability of SCR between myocytes determines DAD amplitude
A novel finding in this work is the demonstration that the amplitude of SCR-induced DADs is highly sensitive to the timing variability of SCR between cells. This occurs because DADs in tissue are due to the summation of Ca-sensitive inward currents (particularly that of NCX) which are induced by the release of Ca during SCR. Thus, if SCR in a population of cells occurs with a broad distribution of timing then Ca release will occur in some cells but not in neighboring cells because the electronic coupling between these cells will decrease the effective rise of voltage in that region of tissue. If SCR occurs with a narrow timing distribution (such as during Ca overload), then Ca release occurs simultaneously in many cells and the inward currents will summate to yield a larger depolarization in that region of tissue. This result is consistent with our observation of an extra beat which occurred close to the average time to peak of the cells in the mapping field (Figure 3F). In this case, it is likely that this extra beat is due to a DAD-induced ectopic beat which occurred somewhere in the heart. However, the coincidence of the timing suggests that cells at the source of the beat exhibited the same averaged properties as the cells in the mapping field. Thus, we expect that a suprathreshold DAD is activated by the coincident timing of SCR which occurs over a much larger scale than our mapping field.
Conclusions
It is now well known that various cardiac arrhythmias are caused by ectopic beats in the heart. In many cases these ectopic beats have been traced to abnormalities in intracellular Ca cycling, which in some cases are known to be caused by mutations in specific Ca cycling proteins27–29. However, to date, a detailed picture of how a Ca cycling abnormality leads to an ectopic beat at the tissue level is still not known. In this paper, we have identified several key features which are crucial to understanding how SCR at the single cell level can lead to a triggered beat in tissue. Our main finding is that the effectiveness of SCR to induce a triggered beat is critically sensitive to the probability distribution of the timing of SCRS within cells in tissue. Furthermore, this probability distribution is dictated primarily by the intrinsic properties of Ca cycling. These insights can potentially have applications in the treatment cardiac arrhythmias. For example, our results suggest that it should be possible to decrease the likelihood of triggered activity by targeting those factors that decrease the timing variability of SCR. In particular, our results predict that down-regulation of SERCA is potentially antiarrhythmic as it should broaden the distribution of timing of SCRS. However, to date there have been no therapeutic approaches which target factors that control the distribution of timing of SCR. Our experimental and theoretical findings should stimulate further exploration of therapeutic strategies based on this novel perspective.
NOVELTY AND SIGNIFICANCE
What is known?
Spontaneous Ca release (SCR), in the form of intracellular Ca waves, occurs as a result of Ca overload of the sarcoplasmic reticulum (SR)
SCR is responsible for delayed afterdepolarizations (DADs) that can reach voltage threshold and cause triggered beats and arrhythmias
SCR events and DADs occur earlier with increasing degree of SR Ca overload
What new information does this article contribute?
Increasing SR Ca overload causes progressively earlier SCR because initiation occurs from more intracellular sites within each myocyte
Increasing SR Ca overload decreases both the average latency and the variability in latencies for SCR, which are both responsible for the early coordination of SCR events among many cells and determine DAD timing and magnitude
Earlier and less variable SCR between cells occurs as the result of accelerated SR Ca reuptake during Ca overload and is an intrinsic property of SR Ca cycling
Summary
SR Ca overload causes SCR in the form of Ca waves that produce subthreshold depolarizations in cardiac cells. During Ca overload, DADs are early and large enough to achieve threshold, producing triggered activity. The major unresolved issue is to determine how individual SCR events can occur in many cells over a short enough period of time to produce suprathreshold DADs. We used high resolution confocal imaging to measure SCR in intact rat heart and found that Ca waves occurred earlier because more release sites were activated during Ca overload. Not only was latency reduced but the timing of SCR between cells became less variable so that SCR events were more coordinated, which explains how intact tissue can produce early and large DADs. Computer simulations support this model and suggest that these properties of SCR result from an increased rate of SR Ca uptake during Ca overload. Our results offer the first complete explanation for how individual subcellular Ca release events are responsible for triggered activity and arrhythmogenesis in intact heart during Ca overload. Knowing the mechanism by which SCR causes triggered beats should allow us to develop new treatment strategies to prevent or terminate triggered arrhythmias.
Supplementary Material
Acknowledgments
Sources of Funding
This work was supported in part by the American Heart Association (Grant 0830298N, YS) and the National Heart, Lung and Blood Institute (R01HL101196 to YS and R01 HL 093490 to RA).
Non-standard Abbreviations and Acronyms
- [Ca]e
extracellular Ca concentration
- CRU
Ca release unit
- DAD
delayed afterdepolarization
- NCX
sodium, calcium exchange
- RyR
ryanodine receptor
- SCR
spontaneous Ca release
- SCRS
spontaneous Ca release sources
- SD
standard deviation
- SR
sarcoplasmic reticulum
Footnotes
Publisher's Disclaimer: This is a PDF file of an unedited manuscript that has been accepted for publication. As a service to our customers we are providing this early version of the manuscript. The manuscript will undergo copyediting, typesetting, and review of the resulting proof before it is published in its final citable form. Please note that during the production process errors may be discovered which could affect the content, and all legal disclaimers that apply to the journal pertain.
Disclosures: None
REFERENCES
- 1.Ferrier GR, Moe GK. Effect of calcium on acetylstrophanthidin-induced transient depolarizations in canine Purkinje tissue. Circ Res. 1973;33:508–515. doi: 10.1161/01.res.33.5.508. [DOI] [PubMed] [Google Scholar]
- 2.Ferrier GR, Saunders JH, Mendez C. A cellular mechanism for the generation of ventricular arrhythmias by acetylstrophanthidin. Circ Res. 1973;32:600–609. doi: 10.1161/01.res.32.5.600. [DOI] [PubMed] [Google Scholar]
- 3.Vassalle M, Musso E. On the mechanisms underlying digitalis toxicity in cardiac Purkinje fibers. Recent Adv Stud Cardiac Struct Metab. 1976;9:355–376. [PubMed] [Google Scholar]
- 4.Rosen MR, Gelband H, Merker C, Hoffman BF. Mechanisms of digitalis toxicity. Effects of ouabain on phase four of canine Purkinje fiber transmembrane potentials. Circulation. 1973;47:681–689. doi: 10.1161/01.cir.47.4.681. [DOI] [PubMed] [Google Scholar]
- 5.Kass RS, Lederer WJ, Tsien RW, Weingart R. Role of calcium ions in transient inward currents and aftercontractions induced by strophanthidin in cardiac Purkinje fibres. J Physiol. 1978;281:187–208. doi: 10.1113/jphysiol.1978.sp012416. [DOI] [PMC free article] [PubMed] [Google Scholar]
- 6.Schlotthauer K, Bers DM. Sarcoplasmic reticulum Ca(2+) release causes myocyte depolarization. Underlying mechanism and threshold for triggered action potentials. Circ Res. 2000;87:774–780. doi: 10.1161/01.res.87.9.774. [DOI] [PubMed] [Google Scholar]
- 7.Wier WG, Beuckelmann DJ. Sodium-calcium exchange in mammalian heart: current-voltage relation and intracellular calcium concentration. Mol Cell Biochem. 1989;89:97–102. doi: 10.1007/BF00220759. [DOI] [PubMed] [Google Scholar]
- 8.Beuckelmann DJ, Wier WG. Sodium-calcium exchange in guinea-pig cardiac cells: exchange current and changes in intracellular Ca2+ J Physiol. 1989;414:499–520. doi: 10.1113/jphysiol.1989.sp017700. [DOI] [PMC free article] [PubMed] [Google Scholar]
- 9.Karagueuzian HS, Katzung BG. Voltage-clamp studies of transient inward current and mechanical oscillations induced by ouabain in ferret papillary muscle. J Physiol. 1982;327:255–271. doi: 10.1113/jphysiol.1982.sp014230. [DOI] [PMC free article] [PubMed] [Google Scholar]
- 10.Garfinkel A, Kim YH, Voroshilovsky O, Qu Z, Kil JR, Lee MH, Karagueuzian HS, Weiss JN, Chen PS. Preventing ventricular fibrillation by flattening cardiac restitution. Proc Natl Acad Sci U S A. 2000;97:6061–6066. doi: 10.1073/pnas.090492697. [DOI] [PMC free article] [PubMed] [Google Scholar]
- 11.Berlin JR, Cannell MB, Lederer WJ. Cellular origins of the transient inward current in cardiac myocytes. Role of fluctuations and waves of elevated intracellular calcium. Circ Res. 1989;65:115–126. doi: 10.1161/01.res.65.1.115. [DOI] [PubMed] [Google Scholar]
- 12.Takamatsu T, Wier WG. High temporal resolution video imaging of intracellular calcium. Cell Calcium. 1990;11:111–120. doi: 10.1016/0143-4160(90)90064-2. [DOI] [PubMed] [Google Scholar]
- 13.Kort AA, Capogrossi MC, Lakatta EG. Frequency, amplitude, and propagation velocity of spontaneous Ca++-dependent contractile waves in intact adult rat cardiac muscle and isolated myocytes. Circ Res. 1985;57:844–855. doi: 10.1161/01.res.57.6.844. [DOI] [PubMed] [Google Scholar]
- 14.Fujiwara K, Tanaka H, Mani H, Nakagami T, Takamatsu T. Burst emergence of intracellular Ca2+ waves evokes arrhythmogenic oscillatory depolarization via the Na+-Ca2+ exchanger: simultaneous confocal recording of membrane potential and intracellular Ca2+ in the heart. Circ Res. 2008;103:509–518. doi: 10.1161/CIRCRESAHA.108.176677. [DOI] [PubMed] [Google Scholar]
- 15.Kass RS, Tsien RW, Weingart R. Ionic basis of transient inward current induced by strophanthidin in cardiac Purkinje fibres. J Physiol. 1978;281:209–226. doi: 10.1113/jphysiol.1978.sp012417. [DOI] [PMC free article] [PubMed] [Google Scholar]
- 16.Tsien RW, Kass RS, Weingart R. Calcium ions and membrane current changes induced by digitals in cardiac Purkinje fibers. Ann N Y Acad Sci. 1978;307:483–490. doi: 10.1111/j.1749-6632.1978.tb41978.x. [DOI] [PubMed] [Google Scholar]
- 17.Aistrup GL, Kelly JE, Kapur S, Kowalczyk M, Sysman-Wolpin I, Kadish AH, Wasserstrom JA. Pacing-induced heterogeneities in intracellular Ca2+ signaling, cardiac alternans, and ventricular arrhythmias in intact rat heart. Circ Res. 2006;99:e65–e73. doi: 10.1161/01.RES.0000244087.36230.bf. [DOI] [PubMed] [Google Scholar]
- 18.Wasserstrom JA, Kapur S, Jones S, Faruque T, Sharma R, Kelly JE, Pappas A, Ho W, Kadish AH, Aistrup GL. Characteristics of intracellular Ca2+ cycling in intact rat heart: a comparison of sex differences. Am J Physiol Heart Circ Physiol. 2008;295:H1895–H1904. doi: 10.1152/ajpheart.00469.2008. [DOI] [PMC free article] [PubMed] [Google Scholar]
- 19.Wasserstrom JA, Sharma R, Kapur S, Kelly JE, Kadish AH, Balke CW, Aistrup GL. Multiple Defects in Intracellular Calcium Cycling in Whole Failing Rat Heart. Circ Heart Fail. 2009;2:223–232. doi: 10.1161/CIRCHEARTFAILURE.108.811539. [DOI] [PubMed] [Google Scholar]
- 20.Restrepo JG, Weiss JN, Karma A. Calsequestrin-mediated mechanism for cellular calcium transient alternans. Biophys J. 2008;95:3767–3789. doi: 10.1529/biophysj.108.130419. [DOI] [PMC free article] [PubMed] [Google Scholar]
- 21.Chen W, Wasserstrom JA, Shiferaw Y. Role of coupled gating between cardiac ryanodine receptors in the genesis of triggered arrhythmias. Am J Physiol Heart Circ Physiol. 2009;297:H171–H180. doi: 10.1152/ajpheart.00098.2009. [DOI] [PubMed] [Google Scholar]
- 22.Chen W, Wasserstrom JA, Shiferaw Y. Role of Coupled Gating Between Cardiac Ryanodine Receptors in the Genesis of Triggered Arrhythmias. Am J Physiol Heart Circ Physiol. 2009 doi: 10.1152/ajpheart.00098.2009. [DOI] [PubMed] [Google Scholar]
- 23.Hove-Madsen L, Bers DM. Sarcoplasmic reticulum Ca2+ uptake and thapsigargin sensitivity in permeabilized rabbit and rat ventricular myocytes. Circ Res. 1993;73:820–828. doi: 10.1161/01.res.73.5.820. [DOI] [PubMed] [Google Scholar]
- 24.Boyden PA, Barbhaiya C, Lee T, ter Keurs HE. Nonuniform Ca2+ transients in arrhythmogenic Purkinje cells that survive in the infarcted canine heart. Cardiovasc Res. 2003;57:681–693. doi: 10.1016/s0008-6363(02)00725-3. [DOI] [PMC free article] [PubMed] [Google Scholar]
- 25.Ter Keurs HE, Boyden PA. Calcium and arrhythmogenesis. Physiol Rev. 2007;87:457–506. doi: 10.1152/physrev.00011.2006. [DOI] [PMC free article] [PubMed] [Google Scholar]
- 26.Daniels MC, Fedida D, Lamont C, ter Keurs HE. Role of the sarcolemma in triggered propagated contractions in rat cardiac trabeculae. Circ Res. 1991;68:1408–1421. doi: 10.1161/01.res.68.5.1408. [DOI] [PubMed] [Google Scholar]
- 27.Lehnart SE, Wehrens XH, Laitinen PJ, Reiken SR, Deng SX, Cheng Z, Landry DW, Kontula K, Swan H, Marks AR. Sudden death in familial polymorphic ventricular tachycardia associated with calcium release channel (ryanodine receptor) leak. Circulation. 2004;109:3208–3214. doi: 10.1161/01.CIR.0000132472.98675.EC. [DOI] [PubMed] [Google Scholar]
- 28.Wehrens XH, Lehnart SE, Marks AR. Intracellular calcium release and cardiac disease. Annu Rev Physiol. 2005;67:69–98. doi: 10.1146/annurev.physiol.67.040403.114521. [DOI] [PubMed] [Google Scholar]
- 29.Liu N, Priori SG. Disruption of calcium homeostasis and arrhythmogenesis induced by mutations in the cardiac ryanodine receptor and calsequestrin. Cardiovasc Res. 2008;77:293–301. doi: 10.1093/cvr/cvm004. [DOI] [PubMed] [Google Scholar]
Associated Data
This section collects any data citations, data availability statements, or supplementary materials included in this article.