Abstract
Short days (SDs) in autumn induce growth cessation, bud set, cold acclimation, and dormancy in trees of boreal and temperate forests, and these responses occur earlier in northern than in southern genotypes. Nevertheless, we know little about whether this variation results from differential perception of SDs or differential downstream responses to the SD signal or a combination of the two. We compared global patterns of SD-regulated gene expression in the stems of hybrid poplar (Populus trichocarpa × Populus deltoides) clones that differ in their SD-induced growth cessation in order to address this question. The timing of cessation of cambial cell division caused by SDs differed between the clones and was coincident with the change in the pattern of expression of the auxin-regulated genes. The clones also differed in the timing of their SD-regulated changes in the transcript abundance of genes associated with cold tolerance, starch breakdown, and storage protein accumulation. By analyzing the expression of homologs of FLOWERING LOCUS T, we demonstrated that the clones differed little in their perception of SDs under the growth conditions applied but differed substantially in the downstream responses manifested in the timing and magnitude of gene expression after SD treatment. These results demonstrate the existence of factors that act downstream of SD perception and can contribute to variation in SD-regulated adaptive photoperiodic responses in trees.
To survive harsh winter conditions, temperate forest trees typically stop growing and develop cold hardiness prior to the onset of winter. These changes are often initiated before the onset of cold temperatures because trees respond to photoperiodic signals. Photoperiods shorter than a “critical daylength” induce the cessation of elongation growth and cambial cell division; formation of a terminal resting bud (or shoot tip abscission in some species); initiation of cold acclimation; and development of bud dormancy (Nitsch, 1957; Weiser, 1970; Olsen et al., 1997; Rohde et al., 2002; Espinosa-Ruiz et al., 2004; Druart et al., 2007). In response to short days (SDs) and low temperatures, metabolism shifts toward the production of storage compounds such as vegetative storage proteins (Clausen and Apel, 1991), and other biochemical and physical changes are initiated that allow plants to withstand extremely low temperatures (Weiser, 1970; Welling et al., 2002). The proper temporal orchestration of these SD responses is underpinned by highly coordinated changes in the transcriptome, as has been shown by microarray analyses of global gene expression in the apices and cambia of a variety of tree species (Schrader et al., 2004a; Druart et al., 2007; Ruttink et al., 2007; Holliday et al., 2008).
Trees originating from areas with different climatic conditions (e.g. from different latitudes or elevations) often display considerable differences in their timing of SD-induced bud set, cambial growth cessation, and cold acclimation (Howe et al., 2003; Ingvarsson et al., 2006; Holliday et al., 2008). In common garden experiments, for example, northern genotypes typically stop growing and develop cold hardiness earlier than do southern genotypes (Morgenstern, 1996; Li et al., 2005). Data from aspen (Populus tremula) genotypes collected from different latitudes in Sweden have implicated homologs of the flowering time genes FLOWERING LOCUS T (FT) and CONSTANS (CO) and the photoreceptor PHYTOCHROME B2 in controlling these differences in SD-regulated growth cessation (Bohlenius et al., 2006; Ingvarsson et al., 2006). Although these studies suggest that the timing of growth cessation differs because of differences in the perception of SDs (e.g. critical daylength), it is unclear whether other downstream components may also be important in regulating these differences, as has been suggested by the detection of several quantitative trait loci associated with the timing of growth cessation in forest trees (Frewen et al., 2000; Hurme et al., 2000). To address this question, we studied two hybrid poplar (Populus trichocarpa × Populus deltoides) clones that differ in their timing of SD-induced growth cessation. We used transcript profiling to compare global changes in transcript levels in these clones following exposure to SDs. These analyses allowed us, first, to test the hypothesis that components acting downstream of the SD perception machinery can contribute to the differences in the timing of SD-regulated physiological responses such as cold hardiness, starch breakdown, storage protein accumulation, and cambial growth cessation, and second, to identify differences in the regulation of expression patterns of genes underlying the differential regulation of these key SD-regulated physiological responses.
RESULTS
Hybrid Poplar Clones 333 and 107 Differed in the Timing of Their SD-Induced Growth Cessation
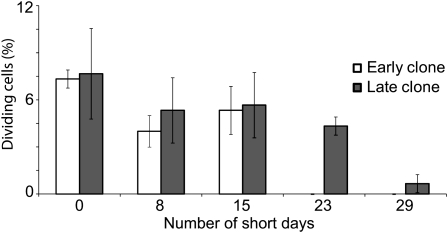
We compared the timing of bud set and cessation of cambial cell division in one early (333) and one late (107) clone of hybrid poplar after exposure to an 8-h SD photoperiod. These clones are full-sib progeny of two F1 clones derived from a cross between P. trichocarpa (latitude 48°N) and P. deltoides (latitude 31°N; Frewen et al., 2000). Prior to the SD treatment, the two clones contained about the same percentage of dividing cambial cells (Fig. 1) and appeared to be physiologically similar to one another. Bud set occurred in the early and late clones after 14 and 28 SD, respectively (Supplemental Fig. S1), and cambial cell division ceased after 15 d in the early clone (i.e. shortly after bud set). In the late clone, cambial division declined substantially after 23 d but was still occurring on day 29 (Fig. 1). Thus, the two clones differed not only in their timing of cambial cell division but also in bud set after SD treatment.
Figure 1.
Analysis of cambial cell division in the early and late hybrid poplar clones after SD treatment. The y axis represents the percentage of fusiform cells undergoing cell division, and the x axis represents the duration of the SD treatment in days. At least 300 fusiform cells were analyzed from three separate plants of the two clones at each time point, and data are expressed as the average of the three measurements with sd.
Global Gene Expression Was Different in the Early and Late Hybrid Poplar Clones
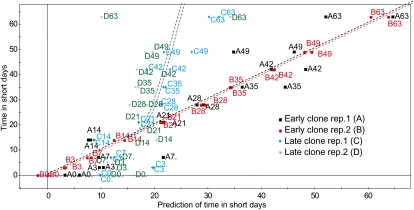
Using POP2 cDNA microarrays (Andersson et al., 2004), we studied global changes in transcript abundance in the stem tissues of the early and late clones at several time points following the beginning of the SD treatment. Genes whose transcript levels changed significantly after SD treatment were identified for each clone separately. We did this by comparing transcript levels at each time point after SD treatment began with the transcript levels at time point 0 (i.e. before the start of the SD treatment). All transcripts whose levels changed significantly at any time point after the start of the SD treatment (relative to time point 0) were inferred to have responded to the SD treatment. Of the 24,735 cDNAs spotted onto the POP2 microarray (Andersson et al., 2004), the mRNA levels were significantly altered for 2,871 transcripts from the early clone and 1,397 transcripts from the late clone. A comparison of the lists of transcripts whose levels changed significantly in the early and late clones indicated considerable differences in gene expression between the two clones after SD treatment. While 1,977 out of 2,871 transcripts were unique to the early clone, 503 out of 1,397 transcripts were unique to the late clone, and 894 transcripts were significantly altered in both clones after SD treatment (Supplemental Table S1). We also investigated the expression of vegetative storage protein (BSP; Zhu and Coleman, 2001), DRTY, and IAA16 genes that are representative of nitrogen metabolism, cold, and auxin response pathway, respectively, which are the key programs whose regulation after SD treatment differs between the two clones (see below) by reverse transcription (RT)-PCR (Supplemental Fig. S2). Importantly, the patterns of expression of these genes differ between the early and late clone after SD treatment in agreement with microarray data, indicating in general the reproducibility of microarrays as well as confirming the differences in regulation of the key growth cessation-associated programs described below. A detailed examination using partial least squares (PLS) analysis (Wold et al., 2001a) indicated that the change in patterns of transcript abundance began to differ between the early and late clones about 14 to 21 d after the beginning of the SD treatment (Fig. 2) and roughly coincided with the cessation of cambial cell division in the early clone.
Figure 2.
Comparison of global changes in transcript abundance in the early and late hybrid poplar clones after SD treatment. PLS analysis was used to compare patterns of global changes in transcript levels in the early and late clones (see “Materials and Methods”). Samples A (black) and B (red) represent the two biological replicates from the early clone, and samples C (blue) and D (green) represent the two replicates from the late clone. The x axis represents the predicted duration of the SD treatment in days, and the y axis represents the observed (true) duration in days. For example, point A28 represents sample A from the early clone after 28 d of exposure to SDs.
Both the Timing and Magnitude of Change in Transcript Levels Differed between the Early and Late Hybrid Poplar Clones
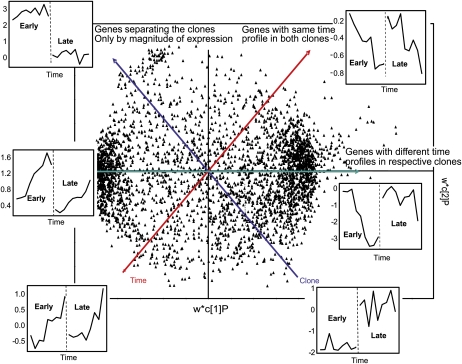
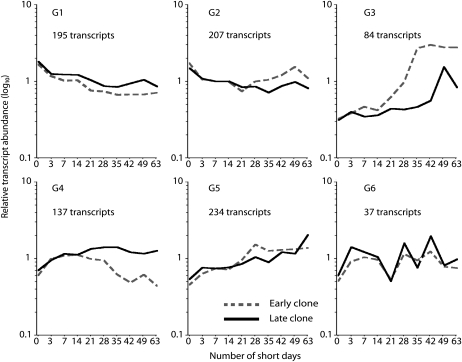
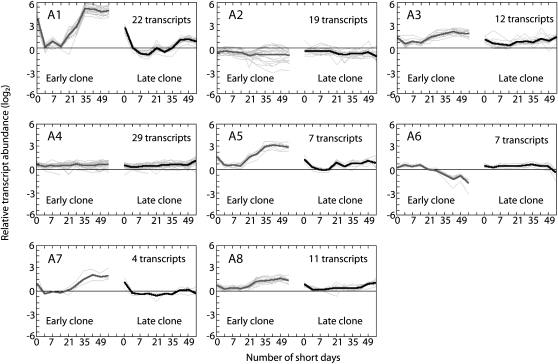
We subsequently used orthogonal partial least squares (OPLS) analysis (Trygg and Wold, 2002) to characterize the differences in transcript abundance between the early and late clones after SD treatment (Fig. 3). This analysis indicated that both the timing and magnitude of changes in transcript abundance for a large number of genes differed between the two clones after SD treatment. Furthermore, when we used cluster analysis to analyze the 894 transcripts whose levels changed significantly after SD treatment in both clones (Fig. 4; Supplemental Table S2), we found additional evidence for changes in the timing and magnitude of transcript abundance (see below). At the extreme is a set of genes whose transcripts are down-regulated after 21 SDs in the early clone but are affected to only a small degree in the late clone (Fig. 4, cluster G4). In most other cases, only the magnitude of up- or down-regulation seemed to differ between the clones. Interestingly, one set of transcripts responded simultaneously in the two clones, but in the late clone subsequent changes in gene expression occurred more slowly and peak induction was significantly delayed (Fig. 4, cluster G3).
Figure 3.
Analysis of differences in global changes in transcript levels between the early and late hybrid poplar clones exposed to SDs using OPLS (see “Materials and Methods”). The green axis indicates which genes differ in their time profiles between the early and late clones. The red axis indicates which genes have similar time profiles in the two clones. The blue axis indicates which genes differ only in their magnitude of transcript levels between the two clones.
Figure 4.
Comparisons of the expression patterns of 894 transcripts (Supplemental Table S2) whose levels changed significantly in both hybrid poplar clones after SD treatment. The expression patterns were clustered using the K-means method. The number of transcripts and mean expression profile are shown for each cluster. The nonlinear x axis represents the duration of the SD treatment in days, and the y axis represents relative transcript levels expressed as a ratio (log10 scale).
The Early and Late Hybrid Poplar Clones Differed in the Regulation of Auxin-Responsive Genes after SD Treatment
Because auxin is a key regulator of cambial cell division (Nilsson et al., 2008), we investigated the regulation of auxin-responsive genes in the early and late clones after SD treatment. Of the auxin-responsive genes previously identified in hybrid aspen (Nilsson et al., 2008), the levels of 482 transcripts changed in the early clone but not in the late clone, 145 transcripts changed in the late clone but not in the early clone, and 111 transcripts changed significantly in both clones after SD treatment (Supplemental Table S3). When we compared the 111 transcripts whose expression changed in both clones, both the timing and magnitude of induction and repression differed between the clones (Fig. 5).
Figure 5.
Comparisons of the patterns of auxin-responsive genes in the early and late hybrid poplar clones after SD treatment. Expression patterns of the 111 auxin-responsive transcripts whose expression changed significantly in both the early and late clones (Supplemental Table S3) were clustered using the K-means method. The nonlinear x axis represents the duration of the SD treatment in days, and the y axis represents relative transcript levels expressed as a ratio (log2 scale). The number of transcripts and mean expression profile are shown for each cluster.
The Early and Late Hybrid Poplar Clones Differed in the Regulation of Cold Tolerance Genes after SD Treatment
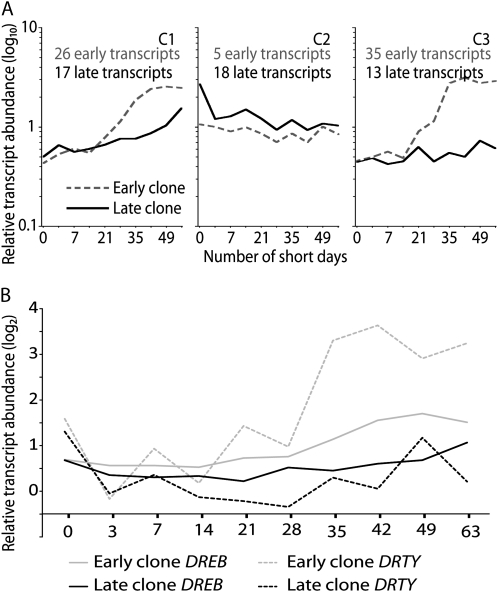
Several cold tolerance-related genes already described in poplar (Rowland and Arora, 1997; Welling et al., 2002; Druart et al., 2007) are known to respond to SDs; therefore, we compared their expression in the early and late clones after SD treatment. mRNA levels were significantly altered in 66 and 48 of the cold tolerance-related transcripts in the early and late clones, respectively (Supplemental Table S4). The major difference between the clones was a slower increase in transcript levels in the late clone compared with the early clone (Fig. 6A, C1 and C3). We also found that the transcripts of DREB (PU23551) and DRTY (PU03412), which are putative regulators of cold tolerance-related gene expression (Benedict et al., 2006; Druart et al., 2007), were significantly up-regulated in both clones after the SD treatment; however, up-regulation of DREB and DRTY was substantially slower in the late clone (Fig. 6B; Supplemental Fig. S2).
Figure 6.
A, Comparison of cold tolerance-related genes in the early and late hybrid poplar clones after SD treatment. Expression patterns of cold tolerance-related transcripts whose levels changed significantly in the early and late clones (Supplemental Table S4) were clustered using the K-means method. The nonlinear x axis represents the duration of the SD treatment in days, and the y axis represents relative transcript levels expressed as a ratio (log10 scale). The number of transcripts and mean expression profile are shown for each cluster. B, Expression patterns of DREB and DRTY in the early and late clones. The x axis represents the duration of the SD treatment in days, and the y axis represents relative transcript levels expressed as a ratio (log2 scale).
Key Carbon and Nitrogen Metabolism Pathways Are Differentially Regulated in the Early and Late Hybrid Poplar Clones
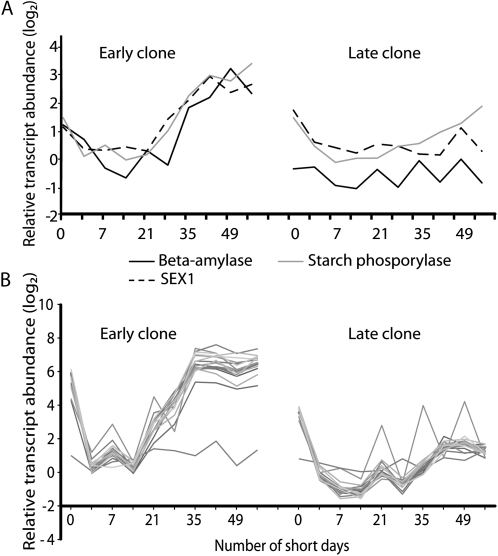
The levels of storage protein and starch breakdown-related transcripts are up-regulated after SD treatment (Zhu and Coleman, 2001; Druart et al., 2007). In the early clone, transcripts of β-amylase, STARCH EXCESS1, and starch phosphorylase (which is related to starch breakdown) were up-regulated after 14 to 21 SDs (Fig. 7A). In contrast, the induction of these transcripts was significantly slower in the late clone, and the transcripts never reached the same levels as in the early clone. Similarly, the induction of storage protein transcripts was significantly slower in the late clone, and the transcripts never reached the same levels as in the early clone (Fig. 7B; Supplemental Fig. S2).
Figure 7.
Analysis of transcripts associated with starch breakdown (A; Supplemental Table S1) and bark storage proteins (B; Supplemental Table S5) in the early and late hybrid poplar clones following SD treatment. The nonlinear x axis represents the duration of the SD treatment in days, and the y axis represents the relative gene expression expressed as a ratio (log2 scale).
SD-Induced Down-Regulation of PtFT Is Similar in the Early and Late Hybrid Poplar Clones
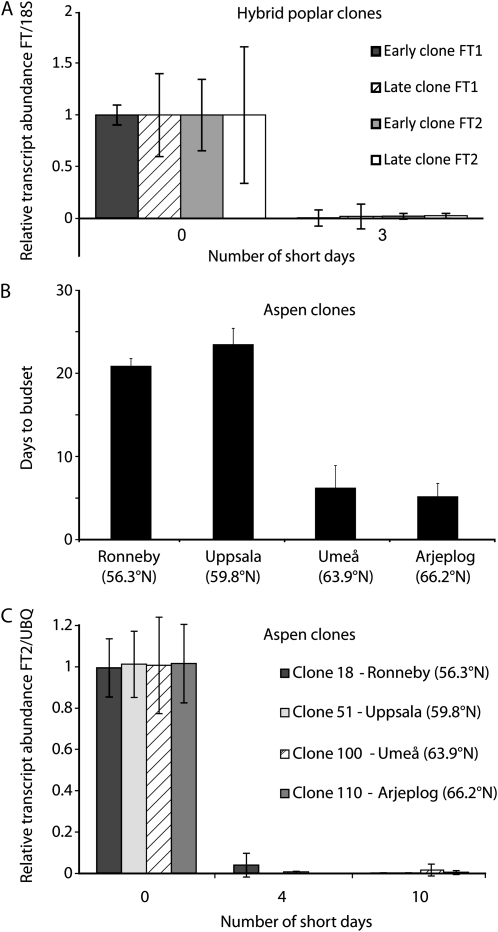
SD-mediated down-regulation of PtFT transcripts is the earliest known marker for the perception of SDs linked to the induction of growth cessation (Bohlenius et al., 2006). Therefore, we measured the abundance of PtFT1 and PtFT2 transcripts after SD treatment to investigate whether the two hybrid poplar clones differed in their timing of SD perception. The transcripts of PtFT1 and PtFT2 were down-regulated in the leaves of both hybrid poplar clones after SD treatment, but there were no significant differences in the timing of down-regulation between the two clones (Fig. 8A).
Figure 8.
A, SD regulation of FT1 and FT2 in the early and late hybrid poplar clones. The x axis represents the duration of the SD treatment in days, and the y axis indicates gene expression relative to the 18S rRNA control. B, Induction of growth cessation in Swedish aspen clones. The x axis shows the aspen clones used (for detailed descriptions, see “Materials and Methods”), and the y axis represents the duration of the SD treatment in days. C, SD regulation of FT2 in aspen clones. The x axis represents the duration of the SD treatment in days, and the y axis represents gene expression relative to the Ubiquitin (UBQ) control.
We also investigated SD-induced regulation of PtFT homologs and growth cessation in four aspen genotypes that span a latitudinal cline in Sweden (55.9°N–66°N; Ingvarsson et al., 2006). When these aspen clones were exposed to an 8-h SD photoperiod, the two northern genotypes stopped growing sooner than the two southern genotypes (Fig. 8B). Although we could not detect the expression of PtFT1 in these genotypes before or after SD treatment, the down-regulation of PtFT2 occurred simultaneously in the four genotypes (Fig. 8C). Therefore, data from both hybrid poplar and aspen show that differences in the timing of growth cessation still exist even when no difference in the timing of SD perception can be observed at the molecular level.
DISCUSSION
The timing of SD-regulated responses such as bud set, cambial growth cessation, and cold acclimation differs among genotypes and populations (Weiser, 1970; Howe et al., 1995; Ogren, 1999; Holliday et al., 2008). In aspen, these differences have been primarily associated with the differential perception of SDs (Bohlenius et al., 2006), but it is not known whether components in the downstream signaling machinery play important roles as well in this process. We addressed this question by comparing global changes in transcript abundance of genes associated with key physiological responses after SD treatment in the stem tissues in two hybrid poplar clones that differ in the SD regulation of bud set and cambial growth cessation. The microarray data indicate significant differences between the hybrid poplar clones in the stem tissues in the regulation of the transcript levels for several hundred genes after SD treatment. It is unlikely that these differences in transcript abundance between the clones after SD treatment are due to differences in hybridization efficiency of the alleles (due to differences in the sequences of the alleles between the clones) from the two parental poplar species with the labeled probes, since the probe lengths are between 300 and 400 bases and the average length of ESTs spotted on the arrays is between 300 and 1,000 or more bases.
Since we sampled whole stem tissues, it is likely that some of the differences in transcript levels between the clones may not be related to the cambial growth cessation process. Therefore, in our analysis, we focused on transcriptional programs associated with cambial growth cessation that have been described earlier (Druart et al., 2007). We first compared the expression of genes known to be regulated by auxin after SD treatment in the two clones, as auxin is a key regulator of cambial activity. For example, hybrid aspens with reduced auxin sensitivity exhibit reduced cambial cell division, and auxin regulates the expression of many genes expressed in the wood-forming zone (Nilsson et al., 2008). Moreover, auxin has been implicated in the regulation of cambial dormancy (Little and Bonga, 1974), and the expression of several auxin-regulated genes is down-regulated during cambial growth cessation and dormancy induction (Schrader et al., 2004b). Importantly, recent data pertaining to Arabidopsis (Arabidopsis thaliana) suggest that auxin-responsive gene expression is regulated by the circadian clock (Covington and Harmer, 2007), which is also thought to play a key role in SD-regulated responses (Bohlenius et al., 2006). Therefore, the auxin response pathway could be one important target for the SD signal, and this is consistent with the observation that the regulation of auxin-responsive genes differs between the two hybrid poplar clones after SD treatment. However, differences may also exist in the SD regulation of other hormonal pathways that control cell division. For example, several putative ethylene response factors and genes involved in ethylene biosynthesis are differentially regulated in the two clones (Supplemental Table S2). Ethylene has been implicated in the regulation of dormancy induction (Ruonala et al., 2006; Ruttink et al., 2007) and cambial cell division (Love et al., 2009). Taken together, these observations suggest that the clones differ in their regulation of multiple hormonal pathways that control the timing of cambial growth cessation under SDs.
A delay in growth cessation is often associated with delayed cold acclimation (Ogren, 1999; Holliday et al., 2008), and this is consistent with our results. Compared with the early clone, a subset of cold tolerance-related genes was either not activated or was activated much more slowly in the late clone. Overall, the accumulation of cold tolerance-related transcripts occurred almost 2 weeks later and to a lesser extent in the late clone, presumably resulting in reduced cold hardiness. These results suggest that differences in the rate of cold acclimation may result from slower increases in the transcripts of cold tolerance-related genes (e.g. cluster C1 in Fig. 6). What is the molecular basis for the differential regulation of cold tolerance-related transcripts in the early and late clones? Our data strongly suggest that it results from differences in the regulation of CBF/DREB-related transcription factors (DREB and DRTY) that regulate the expression of cold tolerance-related genes (Jaglo-Ottosen et al., 1998; Benedict et al., 2005; Pino et al., 2007; Welling and Palva, 2008). The accumulation of DREB and DRTY transcripts was slower in the late clone, and peak transcript accumulation was lower. Thus, our findings provide an explanation for the slower rates of cold acclimation that have been observed in several tree species that differ with respect to their timing of growth cessation (e.g. in coastal and southern clones compared with continental and northern clones of Salix; Ogren, 1999).
The late clone also differed from the early clone in the regulation of transcripts associated with starch degradation and the formation of storage proteins. In poplar, the accumulation of storage protein transcripts is regulated by SDs (Zhu and Coleman, 2001), but starch breakdown is proposed to be mostly regulated by low temperatures (Sauter et al., 1998). However, our results indicate that SDs directly or indirectly induce the accumulation transcripts associated with starch breakdown, and this accumulation is delayed in the late clone. This altered transcriptional regulation suggests that cold acclimation may be adversely affected if southern genotypes are transferred to environments with short growing seasons. This is because starch breakdown in the autumn generates carbon skeletons and substrates for the synthesis of cryoprotectants (Keskitalo et al., 2005; Druart et al., 2007; Ruttink et al., 2007). Furthermore, storage proteins are an important source of stored nitrogen in perennial plants such as trees. In the autumn, amino acids are transported from senescing leaves to perennating organs such as the cambium, where large amounts of storage proteins are synthesized (Clausen and Apel, 1991). These proteins are then broken down during the reactivation phase of cambial growth in the spring. Thus, delayed accumulation of storage proteins may compromise nitrogen storage and the reactivation of growth the following spring.
SD signals are thought to be perceived by the leaves, and previous studies of photoperiodic responses in Populus have identified important roles for genes encoding PHYTOCHROME, CO, and FT (Howe et al., 1996; Olsen et al., 1997; Frewen et al., 2000; Bohlenius et al., 2006; Ingvarsson et al., 2006). Studies of hybrid aspen have shown that SD perception leads to rapid down-regulation of PtFT1 and PtFT2, which are poplar homologs of the flowering time gene FT (Bohlenius et al., 2006). Moreover, inhibition of the PtFT1 homolog in transgenic hybrid aspen and poplar plants leads to rapid induction of growth cessation and bud formation (Bohlenius et al., 2006; Hsu et al., 2006). Importantly, in a latitudinal transect of aspen clones in Sweden, differences in the expression of FT homologs have also been associated with differences in critical daylength and the timing of growth cessation (Bohlenius et al., 2006). Because differential perception of SDs seems to be a key contributor to variation in the timing of growth cessation, we also examined whether our hybrid poplar clones differed in their regulation of FT homologs under our SD treatment. The decrease in PtFT transcript abundance, which is one of the earliest SD responses, does not seem to differ between the early and late hybrid poplar clones or between the northern (early) and southern (late) aspen genotypes under the SD conditions applied in this study. This suggests that the early and late clones of hybrid poplar and aspen perceive SDs at about the same time under the conditions that we imposed, but various downstream responses occur at different rates. From our data, we conclude that signaling components lying downstream of the FT/CO module may also contribute to the differences between the clones and may perform a regulatory function to fine-tune the rate of bud set and cambial growth cessation after SDs have been perceived.
Our results highlight other potentially important mechanisms of photoperiodic regulation, mechanisms that can operate at the level of downstream responses rather than the initial perception of SDs. These alternative mechanisms have not been highlighted in previous studies (Ingvarsson et al., 2006; Holliday et al., 2008), possibly because of the experimental approach used. When different photoperiodic ecotypes are compared under naturally decreasing photoperiods (Ingvarsson et al., 2006; Holliday et al., 2008), differences in gene expression and physiological responses can result from corresponding differences in the critical daylength, response time, or both. Generally, differences in critical daylength may be identified more easily under these conditions. In contrast, when the daylength is apparently well below the critical value for all genotypes (as in our study), the roles of factors acting downstream of the SD signal are revealed more easily because large differences in the timing of SD perception should have been minimized.
Our data suggest that differential regulation of hitherto unidentified factors acting downstream of SD perception can contribute to variation in the timing of a multitude of SD-controlled physiological responses. Which components contribute to these variations in SD responses? The obvious candidates are the tree homologs of the circadian clock and daylength signaling genes that have been identified and studied in Arabidopsis. Indeed, orthologs of key components of the circadian clock (e.g. LHY, CCA, TOC1, GIGANTEA) and their downstream targets have been identified in poplar and other trees (Bohlenius et al., 2006; Tuskan et al., 2006; Holliday et al., 2008). Thus, it is tempting to implicate these well-studied genes and their downstream targets (e.g. hormonal signaling and biosynthetic pathways) in regulating the variation in the SD-regulated physiological responses. However, the role of these components of daylength signaling in the SD regulation of growth cessation and related processes remains largely unexplored in trees; therefore, in the absence of in vivo data, the role of these components remains hypothetical.
In summary, we observed substantial downstream differences in SD-regulated transcriptional programs in hybrid poplar clones that differed in the timing of SD-induced bud set and the cessation of cambial cell division. Many of these differences can be linked to the regulation of biochemical changes that are known to be important for acclimation to winter conditions, including changes in transcripts associated with hormone signaling, cold tolerance, starch metabolism, and the accumulation of storage proteins. Previous molecular work on photoperiodic responses in trees focused on the perception of the SD signal and the very early signaling components. In contrast, our results suggest that genetic variation in downstream components also contributes to adaptive variation in photoperiodic responses. Although these downstream components remain to be identified, microarray analyses have identified several candidates for future genomics studies.
MATERIALS AND METHODS
Plant Materials and Growth Conditions
The hybrid poplar clones were derived from an interspecific cross between a female Populus trichocarpa (clone 93-968) from western Washington (latitude 48°N) and a male Populus deltoides (clone S7C4) from Texas (latitude 31°N; Frewen et al., 2000). Two full siblings (53-246 and 53-242) from the resulting F1 progeny were mated to produce the F2 generation. From this F2 family, clone 333 and clone 107 were selected for analysis because of differences in their timing of growth cessation. Stem cuttings were propagated in soil under a natural long-day photoperiod (more than 16 h) in the greenhouse. To analyze SD responses, the plants were transferred to an 8-h photoperiod (SDs) using a greenhouse blackout system and grown from May to August. The aspen (Populus tremula) clones, which had been characterized previously (Ingvarsson et al., 2006), were grown in soil under a 22-h long-day photoperiod in the greenhouse prior to transferring them to an 8-h photoperiod at 22°C in a growth chamber at 300 μmol m−2 s−1.
RNA Preparation
Hybrid poplar stem samples were collected from three internodes collected below leaf 4 from four trees per clone at each of 10 time points during a 63-d SD treatment. Index leaf (leaf 0) is defined as shortest leaf 20 mm long or less counting from the top (Larson and Isebrands, 1971). The samples were collected after 0, 3, 7, 14, 21, 28, 35, 42, 49, and 63 d of SD treatment. Total RNA was extracted according to Chang et al. (1993), except that after the lithium chloride precipitation the RNA was redissolved in nuclease-free water and cleaned using the RNeasy Mini kit (Qiagen; www.qiagen.com) according to the manufacturer’s protocol. The RNA was then precipitated in ethanol and redissolved in nuclease-free water. The amount and quality of RNA were measured using a Nanodrop spectrophotometer (www.nanodrop.com). For RT-PCR analysis of PtFT expression, total RNA was isolated from the leaves of the two hybrid poplar clones (after 0 and 3 SDs) and four aspen clones (after 0, 4, and 10 SDs) in the SD treatments described above.
cDNA Amplification, Probe Labeling, Experimental Design, and Microarray Hybridization
For each time point and hybrid poplar clone, two RNA samples were prepared by pooling equal amounts of RNA from two of the four trees (i.e. replicate 1 = trees 1 + 2 and replicate 2 = trees 3 + 4). These samples were then used for cDNA amplification and labeling using the approach described by Hertzberg et al. (2001; for details, see Supplemental Protocols S1 and S2). This approach, although yielding two biological replicates per clone at each time point, nevertheless provides good statistical power to analyze differences in transcript abundance, due to a reduction in variation comparable to that provided by the use of three replicates (for explanation, see Supplemental Protocols S1 and S2). Furthermore, comparison of transcript abundance between the clones at several time points also increases the confidence with which differences in the pattern of up-regulation or down-regulation of transcript abundance between the clones can be identified. Finally, for a subset of genes, RT-PCR was performed to analyze differences in the pattern of gene expression between clones that further confirm the data from microarrays. Hybridizations were conducted using a common reference design approach in which the common reference was generated by adding equal amounts of RNA from each individual sample (Druart et al., 2007). For each time point, replicate samples were randomly hybridized against the pooled reference by means of a replicated dye swap, as described by Druart et al. (2007; for a detailed description, see Supplemental Protocols S1 and S2).
Array Analysis
After hybridization, the slides were analyzed using a ScanArray Lite Microarray Analysis System and ScanArray Express 2.1 software (Perkin-Elmer). The images were quantified and analyzed using GenePix Pro 5.0 software (Axon Instruments). Data output files from GenePix were imported into UPSC-BASE and then examined using quality-control plug-ins (Sjödin et al., 2006). Background subtraction was performed by removing local median background intensity from the spot foreground median intensity. A median normalization method was applied, and then spots marked as poor quality were allocated a weighting of 0.1. The LIMMA package for R (Smyth, 2004; http://bioinf.wehi.edu.au/limma/) was used to estimate relative expression values and determine which genes exhibited significant changes in expression.
To identify genes whose transcript abundance changed significantly after SD treatment, expression values at each time point after SD treatment were compared with the expression values at time point 0 (before SD treatment). This analysis was performed independently for each clone. A change in transcript abundance was considered significant if the B-statistic was greater than or equal to 5 for any time point relative to time point 0 (Druart et al., 2007). A high B-statistic indicates a high probability that a gene is differentially expressed, while a B-statistic of 0 indicates a 50% probability of differential expression. A cutoff value of 5 represents a 99.5% probability of differential expression. In addition to B-values, false discovery rate adjusted P values were also calculated as implemented in the LIMMA package. Genes were clustered using the K-means clustering method, implemented using The Institute for Genomic Research MultiExperiment Viewer 3.01 software (Saeed et al., 2003). Output files from GenePix were also exported to SIMCA-P10.5 (Umetrics) for principal components analysis and PLS-discriminant analysis analysis. All data (including the raw data files) are available from UPSC-BASE (www.upsc.se) stored under experiment number UMA0017.
OPLS Analysis and PLS Modeling
PLS analysis (Wold et al., 2001b) was used to examine the gene expression of samples A and B (the two replicates for the early clone, 333) and C and D (the two replicates for the late clone, 107). PLS was used to model the gene expression values (XB) from sample B in relation to the duration of the SD treatment (YT). The resulting model was then used to predict the time of development (YT) for the three remaining samples (A, C, and D). The predictions were evaluated by plotting the observed (known) gene expression values against the values predicted by the PLS model.
OPLS analysis (Trygg and Wold, 2002) was used to model gene expression (XTot) in relation to the duration of the SD treatment (YT) and clone identity (YCid) in a single model.
RT-PCR Analysis
Total RNA (1 μg) was reversed transcribed using a Bio-Rad iScript cDNA synthesis kit. First-strand cDNA was used as the template for RT-PCR quantification performed as described earlier (Espinosa-Ruiz et al., 2004) and using SYBR Green dye (Ambion; http://www.ambion.com/). For RT-PCR analysis of hybrid poplar, 18S RNA or Ubiquitin was used as the reference, and experiments were performed on Roche Light Cycler 480 with three biological replicates in addition to technical replicates. These reference genes were selected because they exhibit low sequence variation between various poplar species as well as based on published results (Espinosa-Ruiz et al., 2004; Bohlenius et al., 2006), where these genes have been used for RT-PCR analysis of gene expression after SD treatment in various poplar species and hybrids. For all clones, we compared relative gene expression of the target genes using ΔCT values (CTCONTROL − CTTARGET), where CT is the threshold PCR cycle (Bohlenius et al., 2006). Primer sequences were as follows: 18S, 5′-TCAACTTTCGATGGTAGG-3′ and 5′-CCGTGTCAGGATTGGGTAATTT-3′; BSP, 5′-TTACCTCTGATGTCAACGAAAG-3′ and 5′-CTTTTCATTTGACATAGATG-3′; DRTY, 5′-TCAAATGTGCCTCAAGCTGACC-3′ and 5′-TCTGCATCGGAATTCCCTGGTG-3′; IAA16, 5′-AGAGTCAAGTTGTGGGGTGGC-3′ and 5′-TTCTTAATTAACCAATAATCACG-3′; PtFT1, 5′-ATTGGCGGGGAAGATCTAAG-3′ and 5′-CCCCAGTTGTTGCTGGAATA-3′; PtFT2, 5′-TGGTTATGGTGGACCCTGAT-3′ and 5′-CACAACCTCTTGCCCAAAGT-3′; and UBI, 5′-GTTGATTTTTGCTGGGAAGC-3′ and 5′-GATCTTGGCCTTCACGTTGT-3′.
Analysis of Cell Division Activity
Cell division was analyzed in fusiform cambial cells isolated from internodes 8 to 10 of both hybrid poplar clones after 0, 8, 15, 23, and 29 d under an 8-h photoperiod, as described by Espinosa-Ruiz et al. (2004). A minimum of 300 fusiform cells from three plants per clone at each time point were examined.
Supplemental Data
The following materials are available in the online version of this article.
Supplemental Figure S1. Images of bud set of early and late clones.
Supplemental Figure S2. RT-PCR analysis of BSP, IAA16, and DRTY in hybrid poplar clones.
Supplemental Table S1. Genes whose transcript levels change significantly at any time point after SD treatment in early, late, or both clones.
Supplemental Table S2. Distribution of genes whose transcript levels change significantly after SD treatment in both clones into the expression clusters shown in Figure 4.
Supplemental Table S3. Distribution of the 111 auxin-responsive genes whose transcript levels change significantly in both clones after SD treatment.
Supplemental Table S4. Distribution of cold-responsive genes whose transcript levels change significantly after SD treatment in early and/or late clones into the expression clusters shown in Figure 6.
Supplemental Table S5. List of probes representing the storage protein transcripts in Figure 7.
Supplemental Protocol S1. Description of cDNA amplification and labeling and microarray hybridization.
Supplemental Protocol S2. Explanation for the approach used in microarray hybridization, providing statistical power for the analysis of changes in transcript abundance
Supplementary Material
Acknowledgments
We thank Anna Karlberg for helpful comments.
References
- Andersson A, Keskitalo J, Sjödin A, Bhalerao R, Sterky F, Wissel K, Tandre K, Aspeborg H, Moyle R, Ohmiya Y, et al. (2004) A transcriptional timetable of autumn senescence. Genome Biol 5: R24. [DOI] [PMC free article] [PubMed] [Google Scholar]
- Benedict C, Skinner JS, Meng R, Chang Y, Bhalerao R, Finn C, Chen THH, Hurry V. (2005) The role of the CBF-dependent signalling pathway in woody perennials. Chen THH, Uemura M, Fujikawa S, , Cold Hardiness in Plants: Molecular Genetics, Cell Biology and Physiology. Seventh International Plant Cold Hardiness Seminar, Sapporo, Japan, 10–15 July 2004 CABI Publishing, Wallingford, UK, pp 167–180 [Google Scholar]
- Benedict C, Skinner JS, Meng R, Chang YJ, Bhalerao R, Huner NPA, Finn CE, Chen THH, Hurry V. (2006) The CBF1-dependent low temperature signalling pathway, regulon and increase in freeze tolerance are conserved in Populus spp. Plant Cell Environ 29: 1259–1272 [DOI] [PubMed] [Google Scholar]
- Bohlenius H, Huang T, Charbonnel-Campaa L, Brunner AM, Jansson S, Strauss SH, Nilsson O. (2006) CO/FT regulatory module controls timing of flowering and seasonal growth cessation in trees. Science 312: 1040–1043 [DOI] [PubMed] [Google Scholar]
- Chang SJ, Puryear J, Cairney J. (1993) A simple and efficient method for isolating RNA from pine trees. Plant Mol Biol Rep 11: 113–116 [Google Scholar]
- Clausen S, Apel K. (1991) Seasonal changes in the concentration of the major storage protein and its mRNA in xylem ray cells of poplar trees. Plant Mol Biol 17: 669–678 [DOI] [PubMed] [Google Scholar]
- Covington MF, Harmer SL. (2007) The circadian clock regulates auxin signaling and responses in Arabidopsis. PLoS Biol 5: e222. [DOI] [PMC free article] [PubMed] [Google Scholar]
- Druart N, Johansson A, Baba K, Schrader J, Sjödin A, Bhalerao RR, Resman L, Trygg J, Moritz T, Bhalerao RP. (2007) Environmental and hormonal regulation of the activity-dormancy cycle in the cambial meristem involves stage-specific modulation of transcriptional and metabolic networks. Plant J 50: 557–573 [DOI] [PubMed] [Google Scholar]
- Espinosa-Ruiz A, Saxena S, Schmidt J, Mellerowicz E, Miskolczi P, Bakó L, Bhalerao RP. (2004) Differential stage-specific regulation of cyclin-dependent kinases during cambial dormancy in hybrid aspen. Plant J 38: 603–615 [DOI] [PubMed] [Google Scholar]
- Frewen BE, Chen TH, Howe GT, Davis J, Rohde A, Boerjan W, Bradshaw HD., Jr (2000) Quantitative trait loci and candidate gene mapping of bud set and bud flush in Populus. Genetics 154: 837–845 [DOI] [PMC free article] [PubMed] [Google Scholar]
- Hertzberg M, Sievertzon M, Aspeborg H, Nilsson P, Sandberg G, Lundeberg J. (2001) cDNA microarray analysis of small plant tissue samples using a cDNA tag target amplification protocol. Plant J 25: 585–591 [DOI] [PubMed] [Google Scholar]
- Holliday JA, Ralph SG, White R, Bohlmann J, Aitken SN. (2008) Global monitoring of autumn gene expression within and among phenotypically divergent populations of Sitka spruce (Picea sitchensis). New Phytol 178: 103–122 [DOI] [PubMed] [Google Scholar]
- Howe GT, Aitken SN, Neale DB, Jermstad KD, Wheeler NC, Chen THH. (2003) From genotype to phenotype: unraveling the complexities of cold adaptation in forest trees. Can J Bot 81: 1247–1266 [Google Scholar]
- Howe GT, Gardner G, Hackett WP, Furnier GR. (1996) Phytochrome control of short-day-induced bud set in black cottonwood. Physiol Plant 97: 95–103 [Google Scholar]
- Howe GT, Hackett WP, Furnier GR, Klevorn RE. (1995) Photoperiodic responses of a northern and southern ecotype of black cottonwood. Physiol Plant 93: 695–708 [Google Scholar]
- Hsu CY, Liu Y, Luthe DS, Yuceer C. (2006) Poplar FT2 shortens the juvenile phase and promotes seasonal flowering. Plant Cell 18: 1846–1861 [DOI] [PMC free article] [PubMed] [Google Scholar]
- Hurme P, Sillanpää MJ, Arjas E, Repo T, Savolainen O. (2000) Genetic basis of climatic adaptation in Scots pine by Bayesian quantitative trait locus analysis. Genetics 156: 1309–1322 [DOI] [PMC free article] [PubMed] [Google Scholar]
- Ingvarsson PK, García MV, Hall D, Luquez V, Jansson S. (2006) Clinal variation in phyB2, a candidate gene for day-length-induced growth cessation and bud set, across a latitudinal gradient in European aspen (Populus tremula). Genetics 172: 1845–1853 [DOI] [PMC free article] [PubMed] [Google Scholar]
- Jaglo-Ottosen KR, Gilmour SJ, Zarka DG, Schabenberger O, Thomashow MF. (1998) Arabidopsis CBF1 overexpression induces COR genes and enhances freezing tolerance. Science 280: 104–106 [DOI] [PubMed] [Google Scholar]
- Keskitalo J, Bergquist G, Gardeström P, Jansson S. (2005) A cellular timetable of autumn senescence. Plant Physiol 139: 1635–1648 [DOI] [PMC free article] [PubMed] [Google Scholar]
- Larson PR, Isebrands JG. (1971) The plastochron index as applied to developmental studies of cottonwood. Can J For Res 1: 1–11 [Google Scholar]
- Li CY, Welling A, Puhakainen T, Viherä-Aarnio A, Ernstsen A, Junttila O, Heino P, Palva ET. (2005) Differential responses of silver birch (Betula pendula) ecotypes to short-day photoperiod and low temperature. Tree Physiol 25: 1563–1569 [DOI] [PubMed] [Google Scholar]
- Little CHA, Bonga JM. (1974) Rest in the cambium of Abies balsamea. Can J Bot 52: 1723–1730 [Google Scholar]
- Love J, Björklund S, Vahala J, Hertzberg M, Kangasjärvi J, Sundberg B. (2009) Ethylene is an endogenous stimulator of cell division in the cambial meristem of Populus. Proc Natl Acad Sci USA 106: 5984–5989 [DOI] [PMC free article] [PubMed] [Google Scholar]
- Morgenstern EK. (1996) Geographic Variation in Forest Trees. UBC Press, Vancouver [Google Scholar]
- Nilsson J, Karlberg A, Antti H, Lopez-Vernaza M, Mellerowicz E, Perrot-Rechenmann C, Sandberg G, Bhalerao RP. (2008) Dissecting the molecular basis of the regulation of wood formation by auxin in hybrid aspen. Plant Cell 20: 843–855 [DOI] [PMC free article] [PubMed] [Google Scholar]
- Nitsch JP. (1957) Photoperiodism in woody plants. Proc Am Soc Hortic Sci 70: 526–544 [Google Scholar]
- Ogren E. (1999) Fall frost resistance in willows used for biomass production. I. Characterization of seasonal and genetic variation. Tree Physiol 19: 749–754 [DOI] [PubMed] [Google Scholar]
- Olsen JE, Junttila O, Nilsen J, Eriksson ME, Martinussen I, Olsson O, Sandberg G, Moritz T. (1997) Ectopic expression of oat phytochrome A in hybrid aspen changes critical daylength for growth and prevents cold acclimatization. Plant J 12: 1339–1350 [Google Scholar]
- Pino MT, Skinner JS, Park EJ, Jeknić Z, Hayes PM, Thomashow MF, Chen TH. (2007) Use of a stress inducible promoter to drive ectopic AtCBF expression improves potato freezing tolerance while minimizing negative effects on tuber yield. Plant Biotechnol J 5: 591–604 [DOI] [PubMed] [Google Scholar]
- Rohde A, Prinsen E, De Rycke R, Engler G, Van Montagu M, Boerjan W. (2002) PtABI3 impinges on the growth and differentiation of embryonic leaves during bud set in poplar. Plant Cell 14: 1885–1901 [DOI] [PMC free article] [PubMed] [Google Scholar]
- Rowland LJ, Arora R. (1997) Proteins related to endodormancy (rest) in woody perennials. Plant Sci 126: 119–144 [Google Scholar]
- Ruonala R, Rinne PL, Baghour M, Moritz T, Tuominen H, Kangasjärvi J. (2006) Transitions in the functioning of the shoot apical meristem in birch (Betula pendula) involve ethylene. Plant J 46: 628–640 [DOI] [PubMed] [Google Scholar]
- Ruttink T, Arend M, Morreel K, Storme V, Rombauts S, Fromm J, Bhalerao RP, Boerjan W, Rohde A. (2007) A molecular timetable for apical bud formation and dormancy induction in poplar. Plant Cell 19: 2370–2390 [DOI] [PMC free article] [PubMed] [Google Scholar]
- Saeed AI, Sharov V, White J, Li J, Liang W, Bhagabati N, Braisted J, Klapa M, Currier T, Thiagarajan M, et al. (2003) TM4: a free, open-source system for microarray data management and analysis. Biotechniques 34: 374–378 [DOI] [PubMed] [Google Scholar]
- Sauter JJ, Elle D, Witt W. (1998) A starch granule bound endoamylase and its possible role during cold acclimation of parenchyma cells in poplar wood (Populus x canadensis Moench “robusta”). J Plant Physiol 153: 739–744 [Google Scholar]
- Schrader J, Moyle R, Bhalerao R, Hertzberg M, Lundeberg J, Nilsson P, Bhalerao RP. (2004a) Cambial meristem dormancy in trees involves extensive remodelling of the transcriptome. Plant J 40: 173–187 [DOI] [PubMed] [Google Scholar]
- Schrader J, Nilsson J, Mellerowicz E, Berglund A, Nilsson P, Hertzberg M, Sandberg G. (2004b) A high-resolution transcript profile across the wood-forming meristem of poplar identifies potential regulators of cambial stem cell identity. Plant Cell 16: 2278–2292 [DOI] [PMC free article] [PubMed] [Google Scholar]
- Sjödin A, Bylesjö M, Skogström O, Eriksson D, Nilsson P, Rydén P, Jansson S, Karlsson J. (2006) UPSC-BASE: Populus transcriptomics online. Plant J 48: 806–817 [DOI] [PubMed] [Google Scholar]
- Smyth GK. (2004) Linear models and empirical Bayes methods for assessing differential expression in microarray experiments. Stat Appl Genet Mol Biol 3: Article3 [DOI] [PubMed] [Google Scholar]
- Trygg J, Wold S. (2002) Orthogonal projections to latent structures (O-PLS). J Chemometr 16: 119–128 [Google Scholar]
- Tuskan GA, Difazio S, Jansson S, Bohlmann J, Grigoriev I, Hellsten U, Putnam N, Ralph S, Rombauts S, Salamov A, et al. (2006) The genome of black cottonwood, Populus trichocarpa (Torr. & Gray). Science 313: 1596–1604 [DOI] [PubMed] [Google Scholar]
- Weiser CJ. (1970) Cold resistance and injury in woody plants: knowledge of hardy plant adaptations to freezing stress may help us to reduce winter damage. Science 169: 1269–1278 [DOI] [PubMed] [Google Scholar]
- Welling A, Moritz T, Palva ET, Junttila O. (2002) Independent activation of cold acclimation by low temperature and short photoperiod in hybrid aspen. Plant Physiol 129: 1633–1641 [DOI] [PMC free article] [PubMed] [Google Scholar]
- Welling A, Palva ET. (2008) Involvement of CBF transcription factors in winter hardiness in birch. Plant Physiol 147: 1199–1211 [DOI] [PMC free article] [PubMed] [Google Scholar]
- Wold S, Sjostrom M, Eriksson L. (2001a) PLS-regression: a basic tool of chemometrics. Chemom Intell Lab Syst 58: 109–130 [Google Scholar]
- Wold S, Trygg J, Berglund A, Antti H. (2001b) Some recent developments in PLS modeling. Chemom Intell Lab Syst 58: 131–150 [Google Scholar]
- Zhu B, Coleman GD. (2001) The poplar bark storage protein gene (Bspa) promoter is responsive to photoperiod and nitrogen in transgenic poplar and active in floral tissues, immature seeds and germinating seeds of transgenic tobacco. Plant Mol Biol 46: 383–394 [DOI] [PubMed] [Google Scholar]
Associated Data
This section collects any data citations, data availability statements, or supplementary materials included in this article.


