

Abstract
A photochemical strategy to generate carbohydrate microarrays on flat sensor surfaces, and to study the protein-binding effects of these arrays by surface plasmon resonance imaging is described. The approach was validated using a panel of carbohydrate-binding proteins. The coupling agents, thiol-functionalized perfluorophenyl azides, allow the covalent attachment of underivatized carbohydrates to gold surfaces by a fast photochemical reaction. Carbohydrate microarrays composed of 3,6-di-O-(α-d-mannopyranosyl)-d-mannopyranose (Man3), 2-O-α-d-mannopyranosyl-d-mannopyranose (Man2), d-mannose (Man), d-glucose (Glc), and d-galactose (Gal) were constructed, and the binding studies were carried out in real-time using surface plasmon resonance imaging. Results showed that the immobilized carbohydrate ligands retained their binding affinities with lectins, the rank order of which was consistent with that of the free ligands in solution. The detection limit of Man3, Man2, Man, and Glc with the lectin Concanavalin A was measured to be 0.29 nM, 0.18 nM, 0.61 nM, and 3.1 nM, respectively. In addition, soybean agglutinin and Griffonia simplicifolia lectin II were tested on the array, and the results were consistent with the binding selectivity of these lectins with the carbohydrate ligands.
Keywords: carbohydrate microarray, photocoupling chemistry, immobilization, lectins, surface plasmon resonance imaging
1. Introduction
Carbohydrate-protein interactions are fundamental in many cellular processes such as cell adhesion, cell differentiation and proliferation, viral/bacterial infection, fertilization, and immune response, which are all of great importance in life sciences (Bertozzi and Kiessling 2001; Gabius et al. 2004; Lee and Lee 2002; Sacchettini et al. 2001). Carbohydrate microarrays have become a powerful tool to elucidate the molecular basis of carbohydrate recognition in a high-throughput format (Feizi et al. 2003; Horlacher and Seeberger 2008; Oyelaran et al. 2009; Park et al. 2008; Stevens et al. 2006; Wang 2003). Potential carbohydrate-binding entities are treated with the array, and the affinity of the interactions is translated into readable signals, for example, fluorescence. Fluorescence detection requires fluorescently-tagged substances. Detection methods that do not require tags are appealing; one such method is surface plasmon resonance (SPR). SPR is a label-free sensing technique, providing the real-time analysis of molecular interactions occurring at near the surface. Surface plasmon resonance imaging (SPRi) offers the additional benefit of detecting multiple receptor-ligand interactions in an array format by simultaneously taking real-time measurements of each spot on the array (Yeatman and Ash 1988). SPRi has gained increasing popularity, and several studies have been reported using the technique to investigate carbohydrate-protein interactions on glycan arrays (D'Agata et al. 2006; Dhayal and Ratner 2009; Karamanska et al. 2008; Linman et al. 2009; Liu et al. 2008; Smith et al. 2003; Suda et al. 2006).
To effectively study carbohydrate-lectin interactions, carbohydrate coupling chemistry is of vital importance. A common approach involves the derivatization of carbohydrates with a functional group that is reactive towards the array substrate. In SPR studies, for example, carbohydrate ligands are often derivatized with thiol or disulfide, which are then chemisorbed on the Au SPR sensors. A few methods of attaching underivatized carbohydrates on flat substrates for microarray construction have been reported. Polysaccharides such as inulin and α-1,6-dextran of different molecular weights were arrayed on nitrocellulose-coated glass slides or oxidized black polystyrene substrates (Wang 2002; Willats 2002). This physisorption approach is effective primarily for polysaccharides where the weak van der Waals interactions with the substrate material are enhanced with increasing molecular weight. Underivatized mono- and oligosaccharides are attached to substrates by reacting their terminal aldehyde group with a hydrazide-modified substrate (Lee and Shin 2005; Zhi et al. 2006), or with amine-functionalized surfaces by way of reductive amination (Seo 2007; Xia et al. 2005). In both cases, reducing carbohydrates are necessary, and for monosaccharides, the coupled products often became acyclic and lost their binding affinity. Photochemical immobilization methods were also reported where a surface-functionalized photoactive layer was used to attach underivatized carbohydrates. Wang et al. employed the photoactive phthalimide chromophore to covalently attach underivatized carbohydrates by way of H abstraction (Carroll et al. 2006). Sprenger et al. synthesized an aziridine-derivatized dextran surface, which upon photoactivation, produced carbene which formed covalent bonds with carbohydrate ligands (Angeloni et al. 2005).
In this article, we employed photocoupling chemistry to conjugate underivatized carbohydrates onto SPR sensors using perfluorophenylazides (PFPAs). The azide moiety, upon light activation, yields perfluorophenylnitrene that most significantly inserts into CH bonds (Platz 1995). This method has been used to attach a wide range of molecules on solid substrates (Bartlett and Yan 2001; Gann and Yan 2008; Liu et al. 2006; Yan 2002; Yan and Ren 2004) including underivatized carbohydrates on iron oxide (Liu et al. 2009) and gold nanoparticles (Wang 2009a, b). The methodology has however not been applied to the generation of microarrays on flat sensor substrates, a challenging application where the ligand presentation and surface composition play very large roles. Herein, we report that carbohydrate microarrays can be efficiently fabricated by this versatile photocoupling chemistry, and directly used to analyze multiple protein-carbohydrate interactions in real-time and at high throughput. A series of mono- and oligosaccharides were thus successfully arrayed on SPR sensors and subjected to a panel of carbohydrate-binding proteins. This combination of photochemical functionalization with the SPRi technique allowed the generation, development and validation of carbohydrate arrays, where the binding specificity, selectivity and detection sensitivities were investigated.
2. Materials and Methods
2.1 Materials
Absolute ethyl alcohol (99.5%) was purchased from ACROS. Concanavalin A (Con A) from jack-bean Canavalia ensiformis (104 kDa), GS-II from Griffonia simplicifolia (113 kDa), and Soybean agglutinin (SBA) from Glycine max (120 kDa), bovine serum albumin (BSA, 69 kDa) were obtained from Sigma and were used without further purification. A stock solution of Con A (3.85 μM) was prepared in pH 7.4 PBS buffer (1.7 mM KH2PO4, 8.2 mM Na2HPO4, 150 mM NaCl). 3,6-Di-O-(α-d-mannopyranosyl)-d-mannopyranose (Man3, V-Labs Inc., Covington, LA), 2-O-α-d-mannopyranosyl-d-mannopyranose (Man2, Sigma), d-mannose (Man, Fluka), d-glucose (Glc, TCI), d-galactose (Gal, TCI), methyl α-d-mannopyranoside (α-MeMan, TCI), N-acetylglucosamine (GlcNAc, TCI), lactose (Lac, TCI), N-acetylgalactosamine (GalNAc, Sigma), and maltose (Mal, TCI) were used as received. (1-Mercaptoundec-11-yl)tetra(ethylene glycol) (MUTEG, 95%) and 2-(2-(2-chloroethoxy)ethoxy)ethanol were purchased from Aldrich. Other standard chemicals were purchased from commercial suppliers and used as received. SF 10 glass slides (18 mm × 18 mm) were purchased from SCHOTT Glass Technology, Inc. (PA, USA).
2.2 Syntheses of Thiol Compounds
Compounds PFPA-MUTEG, PFPA-C2-SH, PFPA-C6-SH and PFPA-C11-SH (Figure 1) were synthesized following the procedures developed in our laboratory (Wang 2010). 2-(2-(2-Mercaptoethoxy)ethoxy)ethanol (MDEG) was synthesized according to the literature procedure; see details in Supporting Information.
Figure 1.
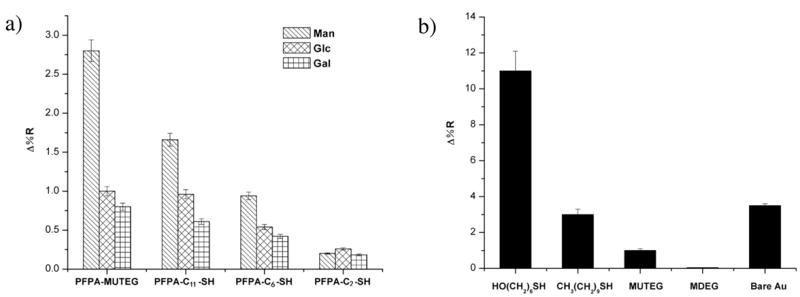
SPR responses of Con A with a) Man, Glc and Gal immobilized on SPR sensors functionalized with PFPA-MUTEG, PFPA-C11-SH, PFPA-C6-SH, and PFPA-C2-SH, respectively; b) various thiol-functionalized surfaces. Each data point was the average of three SPR sensors with four replicates for each ligand, thus the error bar represents the standard derivation of 12 data sets.
2.3 Preparation of Photoactive Sensor Surfaces
SPR sensors were fabricated by coating Au films on high refractive index SF 10 glass. The slides were cleaned in piranha solution (3:1v/v conc. H2SO4/H2O2) at r.t. for 60 minutes. (Caution: the piranha solution reacts violently with organic solvents. Use extreme care when handling this solution.) The slides were thoroughly washed in boiling water three times for 60 minutes each. The slides were then coated with a 2 nm thick Ti followed by a 45 nm gold film in an electron beam evaporator (SEC-600, CHA) at the Microfabrication Lab, Washington Technology Center (University of Washington). These SPR sensors were again cleaned with the piranha solution immediately before they were chemically functionalized. A number of tests were conducted with immersion intervals varying from 10, 30, 45, 60, and 75 seconds, respectively. Beyond 45 seconds, the gold coating started to peel off, and therefore, gold-coated SPR sensors were soaked in the piranha solution for 30-45 seconds at 35 °C followed by washing in boiling water three times for 20 minutes each. The SPR sensors were then washed with milli-Q water followed by ethanol before soaking in the thiol solution for sample preparation. Stock solutions of PFPA-MUTEG (10 mM), MUTEG (65.8 mM), and MDEG (28 mM) were prepared by dissolving the corresponding compound in ethanol. For SAM preparation, the total concentration of the thiol solution was kept at 4 mM for either pure PFPA-MUTEG or the mixture of PFPA-MUTEG and MDEG. SPR sensors were then soaked in the thiol solution at room temperature for 3 hours, followed by gentle washing in ethanol three times for 5 minutes each, and dried with nitrogen.
The dynamic contact angle measurements were conducted on a contact angle goniometer (Model 250, Ramé-Hart, Netcong, NJ). The advancing contact angle (θA) was determined by placing a drop of milli-Q water from a syringe attached to the instrument, advancing the periphery of the drop by adding water at the rate of 0.03 μL/s at a time interval of 2.5 seconds (i.e. frame), and recording the contact angle as well as the diameter of the droplet. The receding contact angle (θR) was measured by withdrawing water from the drop at the same rate and time interval, and recording the contact angle and the diameter of the droplet.
2.4 Carbohydrate Microarray Fabrication
Stock solutions of Man3 (12.5 mM), Man2 (25 mM), Man (100 mM), Glc (100 mM), and Gal (100 mM) were prepared in milli-Q water at room temperature. Each carbohydrate solution (50 μL) was then pipetted to the well of the 96-well source plate according to the microarray layout designed for the experiment. The source plate was immediately placed into a robotic printer (BioOdyssey Calligrapher, Bio-Rad, Hercules, CA) for printing the designed array on functionalized SPR sensors. The capillary pin of 360 μm in diameter (MCP360, Bio-Rad) was used to generate spot sizes of ca. 400 μm. The distance between each spot in a 5 × 4 array pattern was set at 800 μm. The pin approach speed to the source plate and SPR sensor was 10 and 5 mm/s, respectively, and the dwell time in the source plate and on the SPR sensor was 500 and 100 ms, respectively. Milli-Q water and 80% ethanol were used as the wash solutions for 3000 and 5000 ms, respectively, followed by drying in vacuum. A constant humidity of 60% was maintained throughout the printing process. After printing, the SPR sensors were irradiated with a 450-W medium pressure Hg lamp (Hanovia) for 5 minutes using a 280-nm long-pass optical filter. The intensity of the light at samples was measured to be 4.3 mW/cm2 using a 254-nm sensor. This was followed by three times washing in water for 5 minutes each while shaking gently. Finally, the sensors were blow-dried with nitrogen.
2.5 Binding Studies
SPR experiments were performed on a SPR imager®II (GWC Technologies, Madison, WI) at room temperature and at a flow rate of 100 μL/min. The experiments were carried out as follows. The array containing carbohydrate ligands was flushed with pH 7.4 PBS buffer followed by a solution of BSA in pH 7.4 PBS buffer (2 μM), after which, the PBS buffer was introduced again until a flat baseline was obtained. A solution of Con A in pH 7.4 PBS was introduced to the flow cell for about 3 minutes. The running solution was then switched to the PBS buffer followed by 8 M urea solution to regenerate the array surface. The sequence, PBS/BSA/PBS/Con A/PBS/urea/PBS, was then repeated to test the re-generated surface for reproducibility. The same protocol was used in the cross-reactivity studies except that Con A was replaced by GSII or SBA.
2.6 Data Analysis
Region of interest (ROI) is a selected area within printed spots on a microarray image in SPRi. At each specific ROI, data acquisition utilized an average of 30 images/frames and SPR signals converted to normalized percentage in reflectivity (%ΔR) following the protocol provided by GWC. All SPR images were collected using the V++ image analysis software package. Adsorption coefficients, solution binding constants and surface kinetic data were computed using GraphPad Prism 4 or Origin 6.1 software.
The limit of detection (LOD) and the limit of quantitation (LOQ) were calculated using Equations 1 and 2, respectively,
| (1) |
| (2) |
where SD is the standard deviation of the blank, which was defined as the SPR response when the array was treated with the PBS buffer only (without Con A), and b is the initial slope of the calibration curve, which was obtained by plotting Δ%R of each ligand with respect to the Con A concentration.
3. Results and Discussion
3.1 Functionalization of SPRi Sensors with Carbohydrates
The carbohydrate coupling chemistry is based on the photochemistry of PFPA. Upon photoactivation, singlet perfluorophenylnitrene is generated which inserts into CH bonds of neighboring molecules. Since all carbohydrates possess CH bonds, no additional functional group is needed and the coupling chemistry is therefore applicable to a wide range of underivatized carbohydrates. The photocoupling reactions are completed in minutes instead of hours which are needed in many carbohydrate conjugation chemistries. The process is also efficient, resulting in high coupling yield and ligand density (Wang 2009b). To attach carbohydrate ligands on the SPR sensors, Au-coated optical glass slides were first treated with a thiol-functionalized PFPA (Scheme 1). Solutions of each carbohydrate were then printed onto the SPR sensor using a robotic printer. Covalent coupling was accomplished by irradiating the sensor with a medium pressure Hg lamp for 5 min followed by thorough cleaning with water to remove the un-attached ligands. Note that the Au-S bonds are labile to prolonged UV irradiation, which may lead to the oxidation of adsorbed thiols to sulfonates (Huang and Hemminger 1993; Piscevic 1995; Tarlov et al. 1993). The photooxidation is dose and time dependent (Friebel et al. 2000), however, and the SAM layer is stable and intact if the deep UV is removed from the light source or the thiolated SAM is irradiation for shorter lengths of time (Herbert et al. 1997). In our studies, the samples were irradiated for 5 min at intensity of 4.3 mW/cm2, and in addition, a 280-nm long-path filter was used to remove deep UV from the light source. We expect minimal oxidation or degradation under these conditions.
Scheme 1.
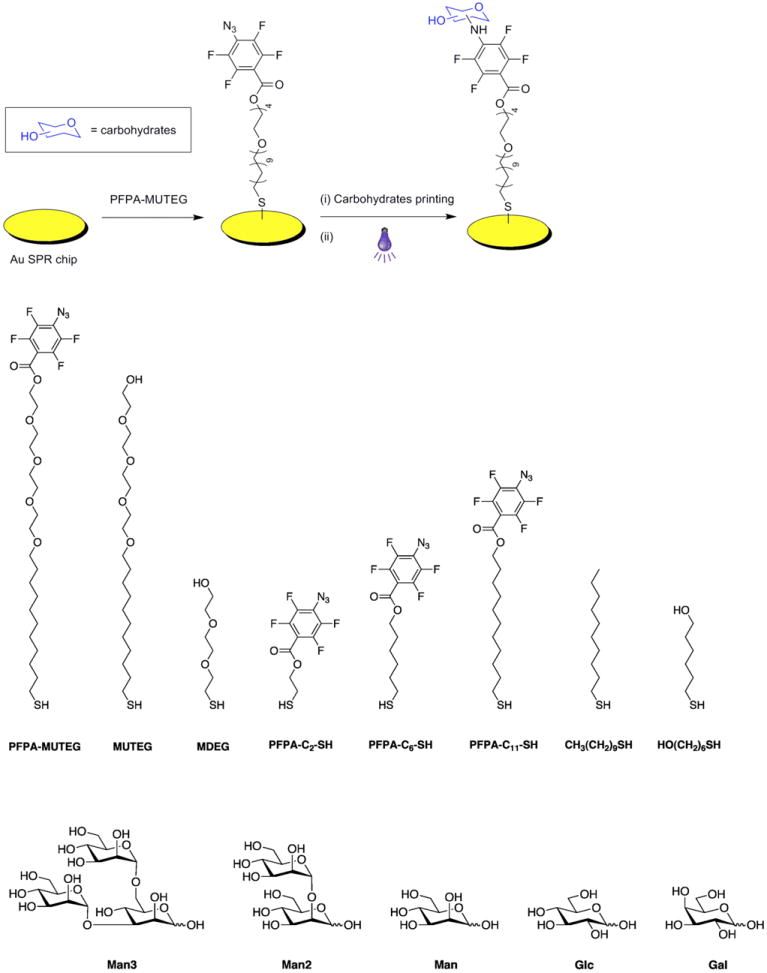
Fabrication of carbohydrate-conjugated SPRi sensors, and structures of thiol compounds and carbohydrate ligands. SPRi sensors were prepared by coating Au films on glass substrates, after which perfluorophenylazide-conjugated thiol compounds were applied to form photoactive self-assembled monolayers (SAMs). Following printing and photoimmobilization of different underivatized carbohydrate structures at the surfaces, carbohydrate arrays were generated.
3.2 Evaluation of Protein Binding Affinities and Validation of the Array Platform
To validate the photocoupling chemistry, experiments were carried out on the SPRi sensors to test whether the surface-bound carbohydrate ligands retain their recognition abilities. A carbohydrate-binding protein, Con A, was used in the model studies. Con A is a well-studied lectin; its structure has been thoroughly characterized and established (Gupta et al. 1997; Hardman and Ainsworth 1972; Imberty et al. 1994; Naismith and Field 1996). Under our experimental conditions (pH 7.4), Con A is known to exist as a tetramer with an overall size of 6.3 nm × 8.7 nm × 8.9 nm and the distance between the binding sites of 6.5 nm. Each monomeric unit binds to α-d-mannopyranose having free −OH groups at C-3, C-4 and C-6 positions as well as α-linked oligomannosides. α-d-Glucopyranose and α-linked oligoglucosides such as maltooligosaccharides also bind Con A although the affinities are lower than the mannopyranose (Gupta et al. 1997; Mortell et al. 1996). The interactions of Con A with these ligands and derivatives have been studied extensively using various characterization methods, and the binding affinity and dissociation constants were measured by different physicochemical methods including equilibrium dialysis, spectrophotometry, fluorimetry, NMR and microcalorimetry (Schwarz et al. 1996; Shaanan et al. 1991; Toone 1994; Wiseman et al. 1989). These results can be used as the benchmark evaluating the binding affinities of the surface-bound ligands and validating the array platform.
Thiol-functionalized PFPAs with varying length of spacer linkage, PFPA-C2-SH, PFPA-C6-SH, PFPA-C11-SH, and PFPA-MUTEG (Scheme 1), were used to generate PFPA-functionalized sensor surfaces. The SPR sensors were treated with 4 mM ethanol solution of each thiol for 3 h, introducing PFPA to the surface. Man, Glc and Gal were printed on the PFPA-functionalized surfaces as quadruplets and were then irradiated to couple the ligands to the sensor surface. After removal of the unattached carbohydrates, the resulting SPR sensor was subjected to binding studies with Con A and SPR signals recorded as the percent change in reflectivity (Δ%R). The flow cell over the sensor surface was thus subjected to a solution of Con A in pH 7.4 PBS, and sensorgrams of each spot of the array were collected (see Figure 2S, Supporting Information). Results showed that the SPR responses increased with the length of the spacer linkage (Figure 1a). PFPA-MUTEG gave the highest signal and was therefore chosen as the coupling agent for the subsequent studies.
We next investigated the surface composition leading to the optimal ligand presentation for lectin binding. A non-photoactive thiol was used together with PFPA-MUTEG to control the surface composition. The non-photoactive thiol should cause minimal background adsorption with the lectins used in the studies. 6-Mercapto-1-hexanol (HS(CH2)6OH), 1-decanethiol (HS(CH2)9CH3), MUTEG and MDEG (Scheme 1) were chosen and the SPR sensor was functionalized with each thiol. The resulting surfaces were exposed to Con A and the SPR responses were recorded. Surfaces treated with HS(CH2)6OH or HS(CH2)9CH3 gave large SPR responses (Figure 1b) due to the non-specific adsorption of these SAMs (Prime and Whitesides 1993). The responses from MUTEG and MDEG surfaces were much lower (Figure 1b), a result that is consistent with the general finding that ethylene oxide units reduce non-specific protein adsorption (Prime and Whitesides 1993). MDEG was therefore chosen and was mixed with PFPA-MUTEG at various mole ratios to treat the SPR sensors.
3.3 Generation and SPRi Sensor Analysis of Carbohydrate Microarrays
Man3, Man2, Man, Glc, and Gal were printed on the functionalized sensors in quadruplets in a 5 × 4 array. The printed arrays were then photoactivated and rinsed to remove un-attached ligands. Binding studies were carried out by conditioning the sensors in the pH 7.4 PBS buffer followed by blocking with BSA. After cleaning with the PBS buffer, a solution of Con A was introduced. Figure 2 shows the SPR responses of the carbohydrate arrays to Con A. As the concentration of PFPA-MUTEG decreased, the SPR response decreased in general except for the surfaces treated with 90% PFPA-MUTEG. The signal was higher than that from the surfaces treated with 100% PFPA-MUTEG. Figure 2 also reveals the binding affinity rank order of the carbohydrate ligands with Con A, according to which, Man3 showed the highest affinity followed by Man2 and Man. The binding of Glc was weaker than Man, and that of Gal was minimal. The rank order of the binding affinity and selectivity observed here were consistent with those of the corresponding free ligands in solution (Mandal et al. 1994), demonstrating that the surface-bound ligands retained their recognition abilities.
Figure 2.
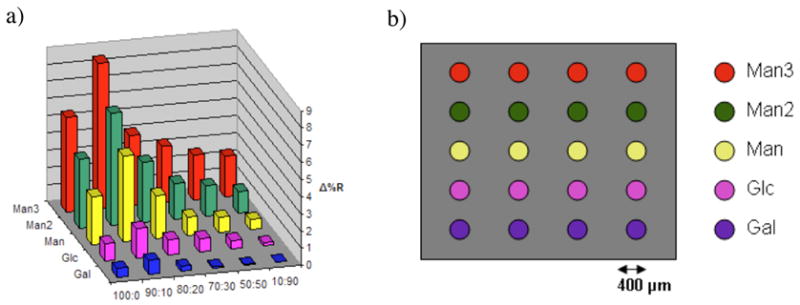
a) SPR responses of a carbohydrate microarray with Con A (100 nM). SPR sensors were treated with solutions of PFPA-MUTEG and MDEG at various mole ratios as indicated. Carbohydrate ligands were then printed on the SPR sensor as a 5 × 4 array according to the pattern shown in b). Each data point in a) was the average of three samples with each ligand printed in quadruplets as shown in b). Error bars were omitted for clarity.
At the end of the experiment, Con A was removed by treating the surface with 8 M urea, regenerating the carbohydrate array as indicated by the signal returning to the original level (Figure 4S, Supporting Information). The regenerated microarrays, when subjected to the same sequence of binding studies, showed similar results as the freshly prepared microarray. In fact, the responses were consistent after 15 experiment cycles, indicating that the microarray surfaces were robust and stable.
Because the samples generated from 90:10 PFPA-MUTEG/MDEG gave the highest SPR responses, this surface composition was used in the subsequent binding studies. The detection limit of each arrayed ligand for Con A was then determined from the corresponding calibration curve of SPR response vs. Con A concentration (see Figure 5S, Supporting Information). Using Eq. 1, the LOD for Man3, Man2, Man, and Glc were calculated to be 0.29 nM, 0.18 nM, 0.61 nM, and 3.1 nM, respectively, and LOQ values for these ligands were 0.98 nM, 0.60 nM, 2.2 nM, and 10.3 nM, respectively, using Eq. 2. This reveals that the oligosaccharides have higher detection sensitivity than that of the monosaccharides.
Dynamic contact angle studies were carried out to investigate the PFPA-MUTEG-treated surfaces. Compared with the 100% PFPA-MUTEG surface, the surface functionalized with 90:10 PFPA-MUTEG/MDEG had a lower advancing contact angle (55.0±3.2° vs 79.0±2.0°), θA, due to the presence of MDEG. The receding contact angle, θR, a measure of liquid retention by the solid surface, was similar for the two surfaces (15.1±2.6°, 16.0±2.9° respectively). In both cases, the θA values were lower than that of the surface treated with PFPA-C11-SH (102.7±1.9°), indicating that the surfaces were less ordered. Furthermore, the contact angle hysteresis for both surfaces was significantly larger (39.0° and 63.9°, respectively) than the PFPA-C11-SH surface (12.1°). The contact angle hysteresis, the difference between the advancing and receding contact angles, measures the adhesion of the liquid droplet to the surface, and is influenced by the surface roughness, chemical heterogeneity, and the interactions of the liquid droplets with the surface constituents (Johnson and Dettre 1964). Small hysteresis is consistent with surfaces that are homogeneous, smooth, and stable. A typical example is the SAM prepared from C12H25SH on Au which is known to be highly ordered and densely packed (Laibinis et al. 1991). The contact angle hysteresis increases when the SAM becomes less ordered, for example, in the case of C10H21SH where a larger hysteresis was observed in comparison to C12H25SH (see Table 1S, Supporting Information), which is consistent with the previous observation by others. (Béthencourt et al. 2009; Laibinis et al. 1991). The large hysteresis values for the PFPA-MUTEG surfaces revealed that these SAM surfaces were less ordered. Furthermore, during the course of the advancing contact angle measurements, the contact angle continued to decrease with the addition of the water droplet (Figures 6Sa and 6Sb, Supporting Information). This is in contrast with the surfaces in the cases of PFPA-C11-SH (Figure 6Sc) and C12H25SH (data not shown) where the contact angle increased with time, which is indicative of highly ordered and stable surfaces. These results show that surfaces prepared from PFPA-MUTEG are not only disordered, but also highly dynamic.
Two additional plant lectins, GS-II and SBA, were used to further evaluate the selectivity and cross-reactivity of the surface-bound carbohydrates. A 5×4 array containing GlcNAc, Gal, Glc, Man and Lac was fabricated on SPR sensors that were pre-treated with 90:10 PFPA-MUTEG/MDEG, and the resulting array was subjected to binding studies with GS-II. GS-II binds strongly with GlcNAc (Goldstein and Poretz 1986), and has a weak binding with Gal and no binding with Glc and Man. The selection of Lac was based on the fact that Lac is a disaccharide of Gal and Glc, and Gal is a known weak binder to GS-II lectin (Pei et al. 2007). Similarly, a 6×4 array consisting of six carbohydrate ligands was fabricated to test their binding with SBA: Lac, GalNAc, Man, Man2, Glc and Mal. Lac was reported to have the strongest affinity for SBA, whereas GalNAc is a weak binder and Man is non-binder (Deboeck et al. 1984). SPR responses of the microarrays showed that GlcNAc had the strongest binding with GS-II followed by Gal and Lac (Figure 7Sa, Supporting Information), whereas Lac exhibited the strongest binding to SBA followed by Glc and Mal (Figure 7Sb, Supporting Information). Both Glc and Mal bound stronger to SBA than GalNAc. These results were consistent with the binding affinity and selectivity ranking of the free ligands with the corresponding lectins, further confirming that the surface-bound ligands retained both binding affinities and selectivities.
4. Conclusions
In conclusion, we have developed a photocoupling chemistry for the fabrication of carbohydrate microarrays that could be analyzed in situ using surface plasmon resonance imaging. The coupling agent, thiol-functionalized PFPA, allows the attachment of underivatized carbohydrates to the SPR sensors. The coupling chemistry is facile and versatile, and the generated arrays were robust and stable and could be repeatedly used. The method offers a straightforward, fast and efficient route to carbohydrate microarray generation on SPRi sensor surfaces, where the surface plasmon resonance imaging technology yields simultaneous, high quality, real-time data for each array structure. More importantly, the surface-bound ligands retained their binding affinities and selectivities with carbohydrate-binding proteins. This represents a new approach to carbohydrate microarrays to study carbohydrate-protein interactions.
Supplementary Material
Acknowledgments
We are grateful to Dr. Daniel M. Ratner, University of Washington, and his research group for their assistance in the preparation of SPR sensor sensors, and to Dr. Dean Atkinson, Portland State University, for helping with data analysis. LD thanks the China Scholarship Council for a special scholarship award. This research is funded by the National Institutes of General medical Science (NIGMS) under NIH Award Numbers R01GM080295 and 2R15GM066279, and in part by the European Commission (MRTN-CT-19561).
Footnotes
Publisher's Disclaimer: This is a PDF file of an unedited manuscript that has been accepted for publication. As a service to our customers we are providing this early version of the manuscript. The manuscript will undergo copyediting, typesetting, and review of the resulting proof before it is published in its final citable form. Please note that during the production process errors may be discovered which could affect the content, and all legal disclaimers that apply to the journal pertain.
References
- Angeloni S, Ridet JL, Kusy N, Gao H, Crevoisier F, Guinchard S, Kochhar S, Sigrist H, Sprenger N. Glycobiol. 2005;15:31–41. doi: 10.1093/glycob/cwh143. [DOI] [PubMed] [Google Scholar]
- Bartlett MA, Yan M. Adv Mater. 2001;13:1449–1451. [Google Scholar]
- Bertozzi CR, Kiessling LL. Science. 2001;291:2357–2364. doi: 10.1126/science.1059820. [DOI] [PubMed] [Google Scholar]
- Béthencourt MI, Srisombat L-o, Chinwangso P, Lee TR. Langmuir. 2009;25:1265–1271. doi: 10.1021/la803179q. [DOI] [PubMed] [Google Scholar]
- Carroll GT, Wang DN, Turro NJ, Koberstein JT. Langmuir. 2006;22:2899–2905. doi: 10.1021/la0531042. [DOI] [PubMed] [Google Scholar]
- D’Agata R, Grasso G, Iacono G, Spoto G, Vecchio G. Org Biomol Chem. 2006;4:610–612. doi: 10.1039/b517074e. [DOI] [PubMed] [Google Scholar]
- Deboeck H, Lis H, Vantilbeurgh H, Sharon N, Loontiens FG. J Biol Chem. 1984;259:7067–7074. [PubMed] [Google Scholar]
- Dhayal M, Ratner DA. Langmuir. 2009;25:2181–2187. doi: 10.1021/la8031122. [DOI] [PMC free article] [PubMed] [Google Scholar]
- Feizi T, Fazio F, Chai WC, Wong CH. Curr Opin Struct Biol. 2003;13:637–645. doi: 10.1016/j.sbi.2003.09.002. [DOI] [PubMed] [Google Scholar]
- Friebel S, Aizenberg J, Abad S, Wiltzius P. Appl Phys Lett. 2000;77:2406–2408. [Google Scholar]
- Gabius H-J, Siebert H-C, André S, Jiménez-Barbero J, Rüdiger H. ChemBioChem. 2004;5:740–764. doi: 10.1002/cbic.200300753. [DOI] [PubMed] [Google Scholar]
- Gann JP, Yan M. Langmuir. 2008;24:5319–5323. doi: 10.1021/la7029592. [DOI] [PMC free article] [PubMed] [Google Scholar]
- Goldstein IJ, Poretz RD. Isolation, physiochemical characterization and carbohydrate-binding specificity of lectins. In: Liener IE, Sharon N, Goldstein IJ, editors. The lectins: Properties, Functions and Applications in Biology and Medicine. Academic Press; New York: 1986. pp. 35–244. [Google Scholar]
- Gupta D, Dam TK, Oscarson S, Brewer CF. J Biol Chem. 1997;272:6388–6392. [PubMed] [Google Scholar]
- Hardman KD, Ainsworth CF. Biochem. 1972;11:4910–4919. doi: 10.1021/bi00776a006. [DOI] [PubMed] [Google Scholar]
- Herbert CB, McLernon TL, Hypolite CL, Adams DN, Pikus L, Huang CC, Fields GB, Letourneau PC, Distefano MD, Hu WS. Chem Biol. 1997;4:731–737. doi: 10.1016/s1074-5521(97)90311-2. [DOI] [PubMed] [Google Scholar]
- Horlacher T, Seeberger PH. Chem Soc Rev. 2008;37:1414–1422. doi: 10.1039/b708016f. [DOI] [PubMed] [Google Scholar]
- Huang JY, Hemminger JC. J Am Chem Soc. 1993;115:3342–3343. [Google Scholar]
- Imberty A, Casset F, Gegg CV, Etzler ME, Perez S. Glycoconjugate J. 1994;11:400–413. doi: 10.1007/BF00731275. [DOI] [PubMed] [Google Scholar]
- Johnson REJ, Dettre RH. J Phys Chem. 1964;68:1744–1750. [Google Scholar]
- Karamanska R, Clarke J, Blixt O, MacRae JI, Zhang JQQ, Crocker PR, Laurent N, Wright A, Flitsch SL, Russell DA, Field RA. Glycoconjugate J. 2008;25:69–74. doi: 10.1007/s10719-007-9047-y. [DOI] [PubMed] [Google Scholar]
- Laibinis PE, Whitesides GM, Allara DL, Tao YT, Parikh AN, Nuzzo RG. J Am Chem Soc. 1991;113:7152–7167. [Google Scholar]
- Lee M, Shin I. Org Lett. 2005;7:4269–4272. doi: 10.1021/ol051753z. [DOI] [PubMed] [Google Scholar]
- Lee YC, Lee RT. Acc Chem Res. 2002;28:321–327. [Google Scholar]
- Linman MJ, Yu H, Chen X, Cheng Q. ACS Appl Mater Interfaces. 2009;1:1755–1762. doi: 10.1021/am900290g. [DOI] [PubMed] [Google Scholar]
- Liu L, Engelhard MH, Yan M. J Am Chem Soc. 2006;128:14067–14072. doi: 10.1021/ja062802l. [DOI] [PMC free article] [PubMed] [Google Scholar]
- Liu L-H, Dietsch H, Schurtenberger P, Yan M. Bioconjugate Chem. 2009;20:1349–1355. doi: 10.1021/bc900110x. [DOI] [PMC free article] [PubMed] [Google Scholar]
- Liu W, Chen Y, Yan M. Analyst. 2008;133:1268–1273. doi: 10.1039/b804235g. [DOI] [PubMed] [Google Scholar]
- Mandal DK, Kishore N, Brewer CF. Biochem. 1994;33:1149–1156. doi: 10.1021/bi00171a014. [DOI] [PubMed] [Google Scholar]
- Mortell KH, Weatherman RV, Kiessling LL. J Am Chem Soc. 1996;118:2297–2298. [Google Scholar]
- Naismith JH, Field RA. J Biol Chem. 1996;271:972–976. doi: 10.1074/jbc.271.2.972. [DOI] [PubMed] [Google Scholar]
- Oyelaran O, Li Q, Farnsworth D, Gildersleeve JC. J Proteome Res. 2009;8:3529–3538. doi: 10.1021/pr9002245. [DOI] [PMC free article] [PubMed] [Google Scholar]
- Park S, Lee MR, Shin I. Chem Commun. 2008:4389–4399. doi: 10.1039/b806699j. [DOI] [PubMed] [Google Scholar]
- Pei ZC, Yu H, Theurer M, Walden A, Nilsson P, Yan M, Ramstrom O. ChemBioChem. 2007;8:166–168. doi: 10.1002/cbic.200600447. [DOI] [PMC free article] [PubMed] [Google Scholar]
- Piscevic D, Wolfgang K, Tarlov Michael J. Supramol Sci. 1995;2:99–106. [Google Scholar]
- Platz MS. Acc Chem Res. 1995;28:487–492. [Google Scholar]
- Prime KL, Whitesides GM. J Am Chem Soc. 1993;115:10714–10721. [Google Scholar]
- Sacchettini JC, Baum LG, Brewer CF. Biochemistry. 2001;40:3009–3015. doi: 10.1021/bi002544j. [DOI] [PubMed] [Google Scholar]
- Schwarz FP, Misquith S, Surolia A. Biochem J. 1996;316:123–129. doi: 10.1042/bj3160123. [DOI] [PMC free article] [PubMed] [Google Scholar]
- Seo JH, A K, Lee BK, Kang DG, Kim YK, Kim KR, Lee HY, Kawai T, Cha HJ. Bioconjugate Chem. 2007;18:2197–2201. doi: 10.1021/bc700288z. [DOI] [PubMed] [Google Scholar]
- Shaanan B, Lis H, Sharon N. Science. 1991;254:862–866. doi: 10.1126/science.1948067. [DOI] [PubMed] [Google Scholar]
- Smith EA, Thomas WD, Kiessling LL, Corn RM. J Am Chem Soc. 2003;125:6140–6148. doi: 10.1021/ja034165u. [DOI] [PubMed] [Google Scholar]
- Stevens J, Blixt O, Paulson JC, Wilson IA. Nat Rev Microbiol. 2006;4:857–864. doi: 10.1038/nrmicro1530. [DOI] [PMC free article] [PubMed] [Google Scholar]
- Suda Y, Arano A, Fukui Y, Koshida S, Wakao M, Nishimura T, Kusumoto S, Sobel M. Bioconjugate Chem. 2006;17:1125–1135. doi: 10.1021/bc0600620. [DOI] [PubMed] [Google Scholar]
- Tarlov MJ, Burgess DRF, Gillen G. J Am Chem Soc. 1993;115:5305–5306. [Google Scholar]
- Toone EJ. Curr Opin Struct Biol. 1994;4:719–728. [Google Scholar]
- Wang D, L S, Trummer BJ, Deng C, Wang A. Nat Biotechnol. 2002;20:275–281. doi: 10.1038/nbt0302-275. [DOI] [PubMed] [Google Scholar]
- Wang DN. Proteomics. 2003;3:2167–2175. doi: 10.1002/pmic.200300601. [DOI] [PubMed] [Google Scholar]
- Wang X, Liu L-H, Ramström O, Yan M. Exp Biol Med. 2009a;234:1128–1139. doi: 10.3181/0904-MR-134. [DOI] [PMC free article] [PubMed] [Google Scholar]
- Wang X, Ramström O, Yan M. J Mater Chem. 2009b;19:8944–8949. doi: 10.1039/B917900C. [DOI] [PMC free article] [PubMed] [Google Scholar]
- Wang X, Ramström O, Yan M. 2010 submitted. [Google Scholar]
- Willats WG, R SE, Kristen T, Mikkelsen JD, Knox JP. Proteomics. 2002;2:1666–1671. doi: 10.1002/1615-9861(200212)2:12<1666::AID-PROT1666>3.0.CO;2-E. [DOI] [PubMed] [Google Scholar]
- Wiseman T, Williston S, Brandts JF, Lin LN. Anal Biochem. 1989;179:131–137. doi: 10.1016/0003-2697(89)90213-3. [DOI] [PubMed] [Google Scholar]
- Xia BY, Kawar ZS, Ju TZ, Alvarez RA, Sachdev GP, Cummings RD. Nat Methods. 2005;2:845–850. doi: 10.1038/nmeth808. [DOI] [PubMed] [Google Scholar]
- Yan M. Polym News. 2002;27:6–12. [Google Scholar]
- Yan M, Ren J. Chem Mater. 2004;16:1627–1632. [Google Scholar]
- Yeatman EM, Ash EA. Proceedings of SPIE-The International Society for Optical Engineering. 1988;897:100–107. [Google Scholar]
- Zhi ZL, Powell AK, Turnbull JE. Anal Chem. 2006;78:4786–4793. doi: 10.1021/ac060084f. [DOI] [PubMed] [Google Scholar]
Associated Data
This section collects any data citations, data availability statements, or supplementary materials included in this article.