Abstract
Liquid chromatography−mass spectrometry-based (LC−MS) proteomics uses peak intensities of proteolytic peptides to infer the differential abundance of peptides/proteins. However, substantial run-to-run variability in intensities and observations (presence/absence) of peptides makes data analysis quite challenging. The missing observations in LC−MS proteomics data are difficult to address with traditional imputation-based approaches because the mechanisms by which data are missing are unknown a priori. Data can be missing due to random mechanisms such as experimental error or nonrandom mechanisms such as a true biological effect. We present a statistical approach that uses a test of independence known as a G-test to test the null hypothesis of independence between the number of missing values across experimental groups. We pair the G-test results, evaluating independence of missing data (IMD) with an analysis of variance (ANOVA) that uses only means and variances computed from the observed data. Each peptide is therefore represented by two statistical confidence metrics, one for qualitative differential observation and one for quantitative differential intensity. We use three LC−MS data sets to demonstrate the robustness and sensitivity of the IMD−ANOVA approach.
Keywords: Missing data, peak intensity comparison, quantitative statistical analysis, qualitative statistical analysis, imputation
Short abstract
Missing abundance values in LC−MS data are difficult to analyze statistically because the mechanisms by which the data are missing are unknown (processing or biological effect). We present a new approach that pairs a test of independence on missing data to discern qualitative difference across treatment groups with traditional statistical tests that evaluate quantitative differences. The combination of these two statistics yields a more robust statistical description of the data.
Introduction
Measuring quantitative and qualitative changes in the global profile of proteins by high-resolution mass spectrometry coupled with liquid chromatography (LC−MS) is key to such fields as biomarker discovery and systems biology. An LC−MS global protein profile is based on whole-cell protein extractions and the identification of enzymatically cleaved peptides, for which peptide abundances are estimated from the extracted ion-chromatographic intensities,1−4 allowing a quantitative measure of each peptide. This ability to make quantitative measurements means that one can associate changes in the global profile of proteins with factor-based changes in the underlying biological system. Here, factors are the categorical separations, or groups (e.g., time, exposure, treatment, disease), of individual samples, defined in controlled experiments to measure a biological effect. Thus, the output from LC−MS experiments can generally be defined as a set of measurements over J peptides, across N samples separated into K groups, where groups may represent a single or combination of factors. Similar to microarrays, this experimental design allows statistical analyses to identify peptides and subsequently proteins that change based on the “treatment” group.
There are obvious analysis parallels between transcriptomics and proteomics data since the goal of both approaches is to measure whole cell complements of biomolecules (RNA and protein, respectively) up to the limitations of the technologies. Conceptually, after feature extraction and quantification from the raw data, both technologies result in similar data representations, i.e., a matrix where the columns represent distinct samples (microarray hybridizations or MS runs), and the rows are associated with the entity measured, which is usually probes or peptides.(5) Downstream statistical analysis methods have been designed and validated for microarray data, and many of these methods have been used extensively in the analysis of LC−MS and LC−MS/MS proteomics data.1,5,6 However, as noted by Li and Roxas,(7) fundamental differences between these two types of data challenge the appropriateness of statistical methods designed for microarray analysis when applied to proteomics data.
One of the key differences between transcriptomics and proteomics data is the fraction and underlying reason for missing values in the data matrix. The missing values in microarray data are typically minimal with modern technologies and are generally due to issues such as printing artifacts, scratches, and other processing issues; thus, data are missing at random. Standard imputation approaches such as K-nearest neighbors (KNN) work relatively well(8) for random missing data, and advances in imputation methods such as clustering of microarray data9,10 continue to improve downstream analyses. With proteomic technologies the data can be missing for numerous diverse reasons. For example, a peptide observed in one sample may not be observed in other samples due to post-translational modification, sequence variation, alternative splicing, or incomplete enzymatic cleavage; all of these biological and experimental variables hinder software-based peptide identification.11−14 Alternatively, the peptide abundance may simply be near or below the limits of detection of the platform; low abundance peptides are more difficult to consistently identify. Moreover, a peptide may not be observed simply because it is not present; i.e., the parent protein is not expressed in a defined experimental group—these peptides are of particular importance because their differential expression is associated with a biological effect. In effect, a priori it is unknown if a specific peptide is missing in an individual analysis at random or due to some systematic, biological effect (censored). Proteins that are significantly different due to the presence/absence (qualitatively significant) between experimental groups are of special interest in many proteomics analyses because they have the potential to be used as clinical biomarkers.
In proteomics analyses, the missing data are often imputed using simple approaches, and then differential peptide or protein abundances are identified by univariate statistical tests such as a t test or analysis of variance (ANOVA).1,6,15 However, imputation of the missing values changes both the mean and variance structures of the data, and therefore imputation may invalidate the results of these common statistical tests. Additionally, proteomics data sets are often filtered prior to analysis by some minimum level of occurrence, which is generally based on arbitrary user rules; e.g., the peptide is observed in at least 50% of the samples within an experimental group or across all runs.16,17 These occurrence filters aid in the removal of peptides with inadequate data but may inadvertently remove peptides associated with proteins that have qualitative differences. An alternate to these simple filters based on counts in specific groups is model-based filtering.(15) A protein-specific additive model-based filter selects, for each protein, the subset of all identified peptides that maximize the protein-level group differences, i.e., produces optimal information content. Only those in the optimal set are retained for further analyses. If the protein does not have a collection of peptides that produce an identifiable model, then none of the peptides from the parent protein are retained for further analysis. In many cases, this approach produces biases in the data similar to the ANOVA filter because if there are not adequate data to estimate more than one group mean then the model will not be identifiable for the protein.
The present work describes an approach for the analysis of proteomics data at the peptide level that combines a statistical test of peptide intensities with a statistical test for the independence of missing data (IMD) from an experimental group. Our focus herein is to develop a statistically robust approach to identify a data matrix of peptides that contain significance related to experimental conditions. These peptide lists may then be interpreted at the peptide level or provide robust peptide data for processing at the protein level. Specifically, we employ a standard ANOVA, or nonparametric equivalent, when adequate data are present to estimate the peptide mean and variance for the observed intensity values. To assess the independence of missing data from an experimental group, we use a modified χ2 test of independence called a G-test, which is best suited to data sets with a small number of samples or with many missing values, a common characteristic of proteomics data. The combination of these two methods, called IMD−ANOVA, therefore quantifies significance using both peptide intensity and peptide occurrence, therefore capturing both quantitative and qualitative differences, respectively. A peptide may be significant by only one or both tests.
We demonstrate the robustness of the IMD−ANOVA approach on two experimental LC−MS data sets. Analyses of these data sets by a traditional ANOVA-after-imputation approach resulted in large numbers of significant peptides due to a bias introduced by imputation of the missing data, when either limit of detection (LOD) or K-nearest neighbor (KNN) methods were used for imputation. IMD−ANOVA did not introduce this bias, yielding a more statistically robust result for these data sets. Lastly, we applied the IMD−ANOVA approach to a proteomics data set from a cell culture/virus infection experiment, where the presence of viral proteins was known a priori to demonstrate that the G-test can more accurately identify peptides associated with proteins with differential occurrence than model-based approaches that depend on group averages.
Material and Methods
LC−MS Data Sets
Three LC−MS data sets from independent MS proteomics experiments were used to compare the G-test statistical procedure to traditional approaches for statistical analysis of proteomics data sets. The first experimental data set is associated with a study designed to detect microbial respiratory infections of mice by analyzing bronchial alveolar lavage fluid (BALF). The second data set is associated with an experiment designed to detect changes in protein profiles correlated with smoking status, by analyzing human plasma samples. The third data set is associated with a time-series experiment of influenza infection of Calu-3 epithelial cells; this data set has the lowest level of run-to-run variability, as well as known qualitative differences (presence/absence of influenza proteins).
All BALF and plasma samples were analyzed using an LTQ-Orbitrap mass spectrometer (Thermo Electron Corp., Waltham, MA) with nanoelectrospray ionization. All Calu-3 samples were analyzed using an Exactive mass spectrometer (Thermo Electron Corp.). Spectra were collected at 400−2000 m/z with a resolution of 100k and analyzed using the accurate mass and elution time (AMT) tag approach.(18) Features from the LC−MS analyses were matched to AMT tags to identify peptides, using an initial tolerance of ±6 ppm for mass and 0.025% for the LC normalized elution time (NET). The mass deisotoping process was performed using Decon2LS,(19) and the matching process was performed using VIPER.(20) BALF and plasma peptide abundance data were further processed to remove peptides identified with low confidence, using a uniqueness filter of a SLiC(21) score of 0.5 and a DelSLiC of 0.2.(21) Calu-3 peptide abundance data were processed using a SLiC score of 0.35.
Mouse BALF Data Set (BALF)
Young male mice (C57/BL) were subjected to aerosol exposure to one of three organisms: virulent strains of Francisella novicida (FTN) or Pseudomonas aeruginosa (PA) or an avirulent strain of F. novicida (MGLA) containing a mutation in the transcriptional regulator gene mglA. The C57/BL mice were exposed to one of the above pathogens and sacrificed at one of three time points, 0, 4, or 24 h. The BALF of four mice was analyzed for each exposure and time point with no technical replicates; additional experimental detail is available.22,23 For the purposes of this study, the samples from postinfection time points (4 and 24 h) were combined into single groups of size 8 for each pathogen. Proteomic analysis as described above returned 3272 peptides which were identified at least once with appropriate confidence thresholds. Thus, each sample consisted of 3272 peptides, each with either a measured abundance or a missing value. Each sample data set was log 10 transformed and normalized using median absolute deviation (MAD) scaling. The final, combined data set thus consisted of a matrix representing 3272 peptides, with values in four total groups (Control, FTN, PA, and MGLA) with 12, 8, 8, and 8 samples each, respectively.
Human Plasma Data Set (Plasma)
Plasma samples of 27 representative individuals from a cohort of 500 tobacco smokers or nonsmokers were selected for proteomics. The confounding factors of age, body mass index (obesity), and gender were also captured but ignored herein to demonstrate the statistical approach on a data set with large within- and between-group variability and with larger sample numbers (≥10) than we had with the mouse infection study (BALF). A total of 6459 peptides were identified with statistical confidence in at least one of 71 data sets (27 plasma samples each with 2 or 3 technical replicates each). The data were log 10 transformed and normalized using a MAD scaling factor, and the peptide intensities from the technical replicates were averaged to provide peptide intensities representative of each plasma sample. The final data set thus consisted of a matrix of 6459 peptides, with values for 27 samples separated into two groups (smokers and nonsmokers), with 13 and 14 samples each, respectively.
Calu-3 Cell Line/Viral Data Set (VN1203)
Calu-3 cells, a human lung adenocarcinoma cell line, were exposed to avian influenza virus A/Vietnam/1203/2004 (H5N1) (VN1203). Cell monolayers were inoculated with VN1203 for 50 min at 37 °C, and sham-infected controls were inoculated with medium only. Following inoculation, monolayers were rinsed and incubated for times 0, 3, 7, 12, 18, and 24 h. Samples were run with triplicate technical replicates and returned 25 747 and 288 total peptides identified at least once with appropriate confidence thresholds against either the Calu-3 cell or viral proteins, respectively. For the purpose of this study, we focus on the viral peptides because they have known differential occurrence between the sham and infected groups. To ensure we have a data set of differential occurrence, we used the 7 h and later time points for comparative purposes as the 0 and 3 h infected cells generally have expression of the viral proteins below limit-of-detection. Peptides with one occurrence were filtered out; the data were log 10 transformed and normalized using a MAD scaling factor; and the peptide intensities from technical replicates were averaged to provide peptide intensities representative of each sample. The final data set thus consisted of a matrix representing 255 peptides, with values for 23 samples separated into two groups (no exposure and influenza exposed) of 11 and 12 samples each, respectively. This data set was used as a benchmark with known qualitative differences since influenza proteins should not be identified in the sham-infected samples.
G-Test Statistical Procedure
A χ2 test of independence is a statistical test to compare the relationship between two factors associated with the data.(24) For the missing data problem in proteomics, these two factors are: (1) the K experimental groups and (2) the two missing data states (observed or absent). The null hypothesis is that the number of missing observations is independent of the groups (e.g., smokers vs nonsmokers). The number of times each peptide is observed and absent across the samples associated with group k can be defined as counts COk and CAk, respectively. On the basis of the total number of peptides observed (O) and absent (A) from a sample, the expected number in each group by random chance can be computed as EOk = (mOnk)/N and EAk = (mAnk)/N, where N is the total number of samples from which mO and mA are the number observed and absent, respectively (mO + mA = N); nk is the number of samples associated with group k; and K is the total number of groups. Given the counts of observed and absent peptides and the expected values, the χ2 test statistic can be computed as
The statistical significance is then derived from a χ2 distribution with (K − 1) degrees of freedom. If the measured counts and expected values are similar, then the χ2 test statistic will be small and result in a large p-value; if they are not similar, then the p-value will be small, indicating that the missing data are not dispersed as would be expected by random chance.
The χ2 test of independence assumes that there are an adequate number of observations for a normal approximation of the underlying multinomial distribution. A general rule of thumb for this assumption is that most expected values used in the test (EOk and EAk) should be greater than five.(24) With proteomics data, expected values of less than 5 are highly likely, especially for studies with small sample numbers, either globally or within an experimental group. In addition, for truly censored peptides, the observed values will be near zero and consequently result in small expected values. A modified version of the χ2 test of independence, called a G-test, can be used where these conditions for the χ2 test of independence are not met. The G-test statistic is computed as
The sum is taken over all nonzero counts, and the statistical significance is still derived from a χ2 distribution with (K − 1) degrees of freedom. Since the censored peptides of interest will have a large amount of missing data, the G-test is generally the most appropriate and for simplicity is used exclusively in this study.
A comparison of the G-test to ANOVA under simulated scenarios of missing data is given in the Supporting Information. The approach for simulating the data and the results of the simulation are presented in the Supporting Information methods and associated Figures S1−S3. The results demonstrate that ANOVA-based analyses in the presence of missing data do not identify censored peptides as significant beyond what is expected by chance, a key motivating factor of the G-test approach. The G-test was implemented and evaluated in MatLab (version 7.10.0.499, R2010a, The Mathworks Inc., Natwick, MA). The basic MatLab implementation code for computing the G-value and associated significance value is given in Figure S4 (Supporting Information).
Statistical Occurrence Filtering
An occurrence filter is typically applied to proteomics data to remove peptide observations for which the data are inadequate for statistical analysis. For example, if a peptide is observed only one time across a series of samples, it is evident that there is not enough data to infer a differential abundance via statistics, regardless of whether the observation is accurate. Common occurrence filters are based on a minimum number of measured intensity values for a peptide within a treatment group.6,16 Since two observed intensity values are the minimum needed to compute a SD, this is the minimum occurrence filter that can theoretically be applied. However, in practice, ANOVA must have two groups to compare, so at least two observed intensity values in each of the two distinct groups is the minimum number necessary if one is to use ANOVA.(16) This “ANOVA-filter” can, however, eliminate peptides with a large number of observations in a single group, i.e., peptides with a qualitative difference. Thus, we describe a “G-test filter” that is based on the theoretical number of observations of a peptide that any single group must have to be significant in the absence of observations in any of the remaining groups. The minimum number of peptides that must be present within a single group can be solved by a simple integer programming problem for each group k
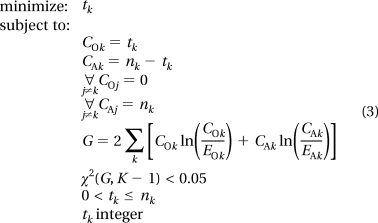 |
This equation can be solved very quickly by setting tk = 1 and incrementally increasing by 1 until the G-value results in a p-value of less than 0.05 based on the χ2 distribution. Under specific scenarios of large numbers of very small groups, tk may be undefined, meaning that at tk = nk the significant value is still not less than 0.05. In this case, tk is set to be equal to nk. A standard 0.05 threshold is used in this study, but a user can set any threshold desired to eliminate peptides based on the needs of the study; for example, a corrected p-value threshold for multiple comparisons would be called for in some studies. We combine an ANOVA-filter (at least two observations in two distinct groups) and this G-filter to analyze our real proteomics data sets (described above). The identification of the G-test filtering values was implemented and evaluated (Version 7.10.0.499, R2010a, The Mathworks Inc., Natwick, MA). Basic MatLab implementation code for identification of the number of peptides required for G-filtering is given in Figure S5 (Supporting Information).
Results and Discussion
ANOVA is based on a comparison of variance between treatment groups to variance within treatment groups. In particular, the ratio of the between to within group variance is used to compute the test statistic, which is estimated by an F-distribution.(24) This ratio becomes larger as the quantitative differences become more extreme, and the p-value computed from the F-distribution becomes small. However, if adequate data are not available to compute these estimates of variance, as is the case with peptides exhibiting a qualitative (occurrence) difference between groups, the test statistic (F) is undetermined, and no statistical assessment of the data is possible. Thus, ANOVA-based analyses in the presence of missing data cannot identify these censored peptides simply due to a lack of adequate data to estimate a group mean (see Figures S1 and S2, Supporting Information). We first demonstrate how the G-test filter can be combined with the ANOVA-filter (GA-filter) to retain the most complete peptide data. Since the peptide data are the first step to protein-level inferences, the identification of the appropriate set of peptides for analysis is essential. Subsequently, we demonstrate how the GA-filter affects protein identification in comparison to model-based filtering. Lastly, we compare the G-test directly to ANOVA on imputed data.
Statistical Occurrence Filtering on Peptide Data Sets
Real proteomics data are generated by a mass spectrometer on a run-by-run basis, which yields a set of observed and missing values for a given peptide across runs (which may be samples or technical replicates of samples), as discussed above. It is not uncommon in an experiment for a peptide to be observed in so few runs that the data are inadequate for statistical analysis, and keeping those peptide observations in the data set provides no benefit. Not filtering these rarely observed peptides affects downstream analyses, such as false discovery rate corrections that rely on the number of comparisons made.(25) The GA-filtered peptide list is the result of using a combination of a standard threshold-filter, i.e., our “ANOVA-filter”, as well as our proposed G-filter (see Methods, eq 3). Basic MatLab code to implement the GA-filter is given in Figure S6 (Supporting Information). The ANOVA-filter used here is a threshold of two (at least two values in each of two distinct groups), although any level can be specified (three is a common threshold).
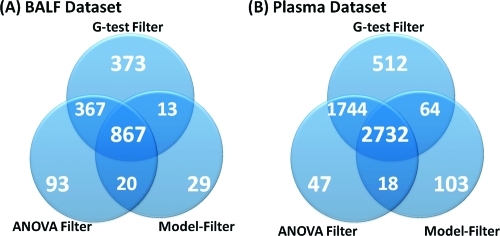
By applying both an ANOVA- and G-filter to the experimental BALF and Plasma data sets, no peptides with only one or two observations passed either filter, and peptides with three (total) measured intensities did not pass the ANOVA-filter, although these may have passed the G-filter (if all three observations were within the same group). This combined filter reduced the experimental BALF and Plasma data sets to ∼53.5% and ∼79.2% of their original data size, respectively. We also examined the model-based filter presented by Karpievitch et al.,(15) to determine if censored peptides would be retained in the context of the global protein model. Figure 1 gives the exact numbers of peptides retained by each filter and their overlap.
Figure 1.
Number of peptides retained by peptide occurrence filtering and the overlap and uniqueness of the ANOVA, G-test, and model-based occurrence filters. Only the G-test filter retains peptides that occur predominantly in a single treatment group.
For the BALF data set, there were 1347 peptides retained in the data set when using the ANOVA-filter. An additional 386 peptides were retained by the G-filter, of which 345 (∼85.4%) are significant by a G-test at a p-value of less than 0.05 and 198 at a false discovery rate (FDR) corrected p-value of 0.05 using a standard Benjamini−Hochberg correction.(25) An example of one of these peptides is one for which 11 measured intensity values were observed: one measurement in each of the first three groups and eight in the last group (FTN). Since there were not at least two groups with two measured intensity values, this peptide was deemed as having inadequate data by the ANOVA-filter. However, given its observation pattern, one might infer that this peptide is censored, present in the FTN group, and missing from the others—an inference that was strongly supported by a p-value of less than 1 × 10⁻⁵ by the G-test. The model-based filtering retained fewer peptides (929 total) than either the ANOVA- or G-filter, and these largely overlap with the peptides retained by one of the other filters. The 29 peptides uniquely retained by the model-based filtering were all peptides with intensity values present in all four groups, but with too few values in each group to be retained by a standard peptide-level ANOVA-filter or a G-test filter. The Plasma data set returned similar results (Figure 1B); a large number of peptides (512 total) were retained by only the G-filter, and the 103 peptides uniquely retained by the model-based filter were those with low numbers of observations (exactly three observations dispersed between the two groups).
Our combination of the G-test filter and ANOVA-filter (GA-Filter) provides a methodology to filter peptides that have too little data for downstream statistical analyses, while retaining peptides with the potential to be either quantitatively or qualitatively different across groups. Although these occurrence filters could potentially be combined with any other filters of interest (including a model-based filter), our results suggest that the GA-filter retains the most complete data set to move forward into the protein inference and quantitation steps.
Influence of Statistical Occurrence Filtering on Protein-Level Analysis
The primary goal of this study is the identification of an appropriate set of peptides from proteomics data to carry forward to downstream analyses, most notably the identification of significant protein-level differences between experimental groups. Although we do not address the challenging problem of inference of significant proteins in this study, it is instructive to examine at the protein level the effect of the filters described above.
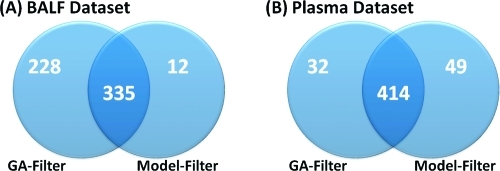
To evaluate the protein-level information retained by the GA-filter versus the model-based filter, we generated nonredundant protein lists for each data set using Protein prophet(26) to group redundant proteins into protein families. Overall, for the BALF data set many more proteins remain after the ANOVA/G-test filter (GA-filter) than the model-based filter, 563 versus 347 (Figure 2A). The 12 proteins unique to the model-based filtering results were each evaluated. These proteins were each represented in the peptide-level data by a single peptide, for which there are too few observations to infer quantitative difference between treatment groups because group variances cannot be computed. These proteins therefore would presumably be filtered out by any downstream statistical analyses. For the Plasma data set, there was a large discrepancy in the number of peptides retained by the GA- and model-based filters (Figure 1); however, at the protein level, the proteins that remain after filtering largely overlap (Figure 2B). The selective pressure of the model-based filtering approaches to have adequate data in all groups to compute and maximize a group average result in fewer proteins retained when more experimental groups are analyzed (four groups in the BALF data set vs two groups in the Plasma data set).
Figure 2.
Number of proteins retained by the GA-filter versus model-based filters for the (A) BALF and (B) plasma data sets. The GA-filter is especially important for the BALF data set and retains many proteins with qualitative differences.
For the BALF data set, there were 228 proteins that were unique to the GA-filter, and these proteins had peptides that were only retained by the GA-filter. About one-half of these 228 proteins are based on a single peptide identification (148); however, approximately 23% (66) are based on evidence from more than one peptide identification. Table 1 gives an example of a specific protein (IPI00113057.1) for which seven peptides are identified in total. Of these seven peptides, five are retained by the G-test filter, and none are retained by the model-based filter. All seven peptides are represented in Table 1 because even though the other two peptides have inadequate data they show the same trend where there are zero identifications in the Control, MGLA, and FTN groups and one to five identifications in the PA group. This qualitative marker is not identified by other methods. Approximately 98% of the 66 proteins with multiple peptide evidence are significant for one of the three exposure groups (protein presence unique to exposure). Only ∼2% are present in control and not expressed in the exposure groups, qualitatively lost after exposure.
Table 1. Counts of Peptide Observations in Each of the Groups for the Seven Peptides Associated with IPI00113057.1.
| peptide | retained by filter | control | MGLA | FTN | PA |
|---|---|---|---|---|---|
| IYGGILSLSEITK | yes | 0 | 0 | 0 | 5 |
| VSEGNYDIALIK | yes | 0 | 0 | 0 | 5 |
| VSEYMDWILEK | yes | 0 | 0 | 0 | 4 |
| SADNLVSGFSLK | yes | 0 | 0 | 0 | 3 |
| LSTDGSPTR | yes | 0 | 0 | 0 | 3 |
| TGAISGHSLK | no | 0 | 0 | 0 | 1 |
| HSASGTPTSIK | no | 0 | 0 | 0 | 1 |
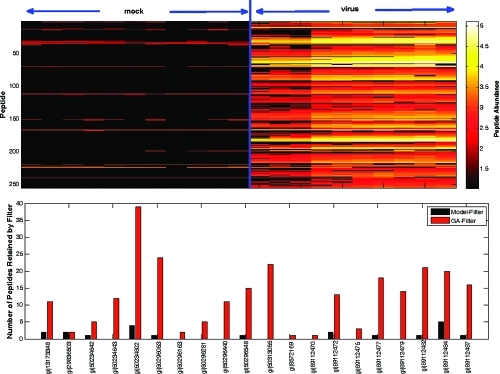
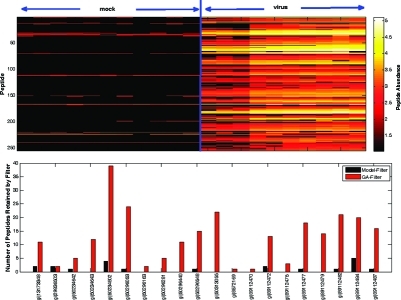
We used the VN1203 data set to further illustrate the ability of the GA-filter to correctly retain proteins with qualitative differences. This data set is an excellent test case because we know a priori that influenza proteins should not be detected in the “sham” infection samples which were not exposed to the virus, whereas we expect to observe viral proteins in the virus infected samples. Of the peptides identified from this experiment, 255 were identified against the influenza genome and associated with 20 unique influenza proteins. The GA-filter retained all 255 peptides, whereas the model-based filter retained only 20 peptides. Figure 3 shows the abundance profile of the 255 peptides and the number of peptides retained by each method. These influenza proteins are known to be censored by design, and therefore the GA-filter retains the most appropriate subset of peptides for downstream protein-level analyses.
Figure 3.
Overall graphical representation of the VN1203 data set. The top graphic shows that the 255 identified viral peptides are nearly all absent from the sham group (black) but have varying abundance values in the virus group. On the bottom is a bar graph that shows the number of peptides retained by the model-based filter versus the GA-filter of the 20 viral proteins identified by proteomics. Only 9 of these 20 proteins with known qualitative differences are retained by the model-based filter, and those are only represented by a small fraction of the total identified peptides.
Comparison of the IMD−ANOVA Approach with Traditional ANOVA Analyses
A common strategy in proteomics research is to impute the missing values prior to statistical analysis. A simple approach to impute missing peptide intensity values is to insert, for each given peptide with missing values, a simple constant defined as 1/2 of the minimum observed abundance of that peptide.(6) This quasi-LOD imputation assumes that the missing values are due to analytical sensitivity. More advanced approaches, such as K-nearest neighbors (KNN) or singular value decomposition (SVD), assume a correlative structure in the data, so that peptides with similar intensity patterns can be used to infer the intensities of the missing peptide values. More recent model-based methods perform more advanced imputation(15) based on the distribution of the observed data, but at the caveat of requiring preimputation filtering that removes many peptides that are significant to the G-test as shown in Figure 1. Therefore, the model-based imputation approach is not compared.
IMD−ANOVA combines ANOVA to identify quantitative differences in the presence of missing data with the G-test to examine the missing data structure for qualitative differences. In particular, if adequate observations and intensity data are present for a peptide, then variance estimates can be attained for the observed intensity values, and a standard t test or ANOVA-based analysis can be performed; otherwise, the p-value for ANOVA is 1. For missing data, the central question of importance is whether the missing peptides are associated with a particular experimental group; thus, if a peptide is observed in all samples, the p-value for the G-test would be 1, and the null hypothesis that the data are missing at random is not rejected. The larger the p-value, the more likely the data are simply missing in a random manner with respect to the experimental groups. The combination of these two methods, called IMD−ANOVA, therefore quantifies significance using both peptide occurrence and peptide intensity and is performed without imputation. A peptide may be significant by only one or both tests. For example, suppose a peptide is observed in samples that represent three experimental treatment groups and that the peptide is measured with high frequency in the first two groups but is missing (i.e., censored) from the third group. This peptide would have a significant qualitative difference by the G-test. If there is a quantitative difference between the measured intensity values in the first two groups, then it would also be significant by ANOVA and therefore would have a significant result for both ANOVA and G-test. If there was no quantitative difference between the measured values in the first two groups, then it would be significant by the G-test only.
Because we have shown that occurrence filtering of the data using a GA-filter eliminates peptides with inadequate data for statistical analysis, we use the filtered BALF and Plasma data sets (Figure 1) to compare analysis approaches. Specifically, we analyzed the peptide intensities to determine differences identified as significant for differential abundance by our IMD−ANOVA approach and compared them with results from ANOVA with the missing data imputed by LOD or KNN-1. KNN with more neighbors (2, 3, and 4) was also evaluated (data not shown) but correlated highly with KNN-1, and thus only results using KNN-1 are presented.
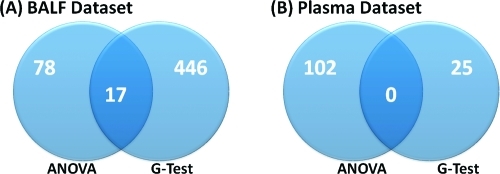
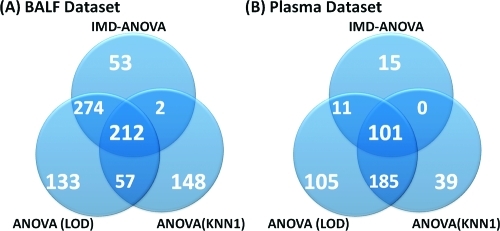
The BALF and Plasma data sets consisted of 1733 and 5117 peptides, respectively, after the GA-filter (Figure 1). Using IMD−ANOVA and a standard Benjamini−Hochberg(25) FDR correction for multiple comparisons, the BALF and Plasma data sets return 541 and 127 peptides, respectively, that are significant by either ANOVA or G-test (Figure 4) at a q-value of 0.05. As seen in Figure 4, the same peptides are generally not captured by both statistical tests. The significant peptides identified using the IMD−ANOVA approach were compared to those identified by ANOVA after LOD or KNN-1 imputation (Figure 5). A large number of peptides identified as significant by the G-test were not identified by ANOVA when the missing data were imputed.
Figure 4.
Overlap and uniqueness between the peptides identified as significant at an FDR corrected p-value of 0.05 by ANOVA and G-test. The G-test for missing data identifies significant numbers of peptides as having a treatment-related difference in occurrence.
Figure 5.
Overlap and uniqueness between the peptides identified as significant at a FDR corrected p-value of 0.05 by IMD−ANOVA, ANOVA LOD, and ANOVA KNN-1.
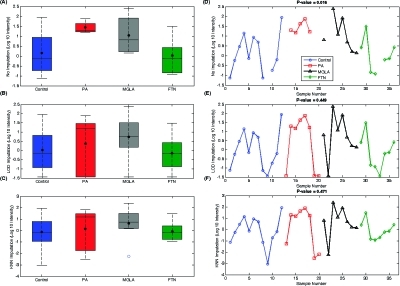
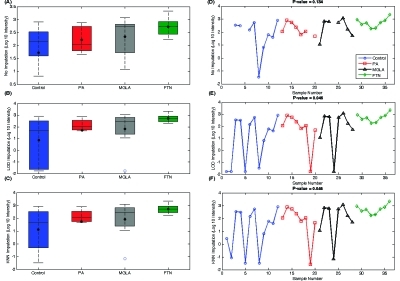
Figure 5 shows that there are many peptides identified as significant using only specific approaches, especially after imputation when ANOVA or G-test does not find them significant prior to imputation. For example, the large number of peptides unique to the ANOVA (KNN-1) illustrates a common problem for KNN imputation: when peptide observations are few, the chance of false positive significance is increased because one is imputing using intensities of a peptide which does exhibit significant differential abundance, even though there are not adequate data in the raw form to make such an inference. To demonstrate issues with imputation, we selected several peptides for individual evaluation. The first example (ESTLHLVLR) shown in Figure 6 is a peptide significant by ANOVA which becomes nonsignificant after imputation, and the second example (DLLFRDDTK) displays the reverse trend (Figure 7), which is much more common.
Figure 6.
Comparison of the boxplots and abundance values for (A)/(D) the raw data, (B)/(E) LOD imputed data, and (C)/(F) KNN-1 imputed data for peptide ESTLHLVLR. Peptide ESTLHVLR is significant when analyzed by ANOVA when ignoring missing data (A) but becomes nonsignificant after LOD or KNN-1 imputation due to variance introduced by the imputation method, (B) and (C), respectively.
Figure 7.
Comparison of the boxplots and abundance values for (A)/(D) the raw data, (B)/(E) LOD imputed data, and (C)/(F) KNN-1 imputed data for peptide DLLFRDDTK. Peptide DLLFRDDTK is not significant when analyzed by ANOVA when ignoring missing data (A) but becomes significant after LOD or KNN-1 imputation due to variance introduced by imputation, (B) and (C), respectively.
For the peptide shown in Figure 6, the G-test returns a p-value of 0.405; that is, there was no group for which the data were missing at a greater frequency than expected by random chance. In fact, the peptides are observed in ≥62.5% of the samples within each group. This peptide also had sufficient data for ANOVA analysis, and the box plot in Figure 6A shows a clear separation of the PA group from the FTN and control groups, resulting in a p-value of 0.016 from ANOVA. Imputing the missing values for this peptide with an LOD constant (Figure 6B) significantly changed the variance structure of the data, especially for the PA group which became skewed by the low intensity “outliers” that were introduced by imputation. This LOD imputation caused a nonsignificant result (p-value ∼0.45 from ANOVA). The KNN-1 imputation was also problematic (Figure 6C) because the nearest neighbor peptide had some very low intensities, which affected the variance of this peptide (ESTLHLVLR) in a manner similar to the LOD imputation, resulting in a p-value of ∼0.47 from ANOVA.
Similar to the peptide data shown in Figure 6, the peptide in Figure 7 had observed intensity values in at least 75% of samples across groups. Again, given the large number of observed values in all groups, this peptide was not significant by G-test (p-value of 0.326). Evaluation of the raw data (Figure 7A, D) showed that except for a few low intensities in the control group the peptide intensities are similar across groups, and ANOVA appropriately returned a p-value of 0.134. However, when the missing values were imputed by LOD, the mean of the control group was significantly reduced, becoming statistically smaller than the FTN group mean (p-value of 0.045), but this significance was merely an artifact because the FTN group happened to be the one group with no missing observations and thus no imputed values. A similar artifactual significance is returned from KNN-1 because the imputed intensities were not similar to the observed intensities. This example illustrates the danger of imputing missing values and creating false positive significant peptides when the data clearly demonstrate otherwise.
These examples demonstrate that the LOD and KNN-1 imputed values may introduce variance structures that cause false positive and false negative results using ANOVA with the imputed values. To be precise, the largest issue with imputation is that it can alter the means and SDs of a peptide’s intensity values, either creating artificial significance or masking true significance. Examination of the subset of peptides significant by IMD−ANOVA but not ANOVA with imputation showed that these are largely peptides present in only one or two groups and absent from the others, demonstrating that the IMD−ANOVA procedure performed as expected, successfully identifying censored peptides.
Conclusions
IMD−ANOVA integrates a statistical test across means (ANOVA) with a statistical test of missing data (G-test) to yield more accurate and sensitive results over common approaches when analyzing measured peptide intensity values across defined treatment groups. The G-test is especially useful since the results are not affected by other data processing procedures, such as normalization. The G-test is based only on the number of peptide observations and does not consider peptide intensities. The IMD−ANOVA approach was compared to ANOVA (LOD) and ANOVA (KNN-1) to demonstrate that the variance structure of the data can be adversely affected by the imputed peptide intensities and that imputation ultimately creates biases that change the significance of a large number of peptides. It is not surprising that imputation methods have been difficult to validate in proteomics, and very little has been published in this area, particularly since truth is rarely known. Even when data are missing from microarrays at random, the results can be affected by imputation.9,10,27 As noted by Troyanskaya et al., regarding microarray analyses, “estimated data should be flagged where possible, and its significance on the discovery of biological results should be assessed to avoid drawing unwarranted conclusions”.(8) Since the amount of missing data in proteomics is much larger than its transcriptomic counterpart (and not at random in many cases), the proteomics community should be very cautious of methods to impute missing data.
The primary benefit of IMD−ANOVA is that it offers an approach to analyze a proteomics data set in the presence of missing data without further biasing the statistical conclusions. As observed in Figure 3, the GA-filtering approach retained proteins with qualitative differences that are not evaluated in model-based methods. Future work should determine the best approach to the identification of statistically significant proteins based on various levels of peptide evidence, such as G-test. Lastly, ANOVA is available through any statistical package, and the G-test is very easy to implement based on eq 2 using simple counts of observed and absent intensity values for a peptide. Code to generate the G-value and G-filter and to implement the GA-filter is provided in Figures S4−S6 (Supporting Information). Although the method is demonstrated at the peptide level, the same methods for statistical analysis would be applicable at the protein level.
Acknowledgments
This work was supported in part by the National Institutes of Health under grant 1R011GM084892 (BJWR) from the National Institute of General Medical Sciences, from the National Institute of Environmental Health Sciences under grant U54 016015 (JGP), from the National Institute of Allergy and Infectious Disease under contract number HHSN272200800060C (KMW), and through the Environmental Biomarkers Initiative under Laboratory Directed Research and Development. Pacific Northwest National Laboratory (PNNL) is a multiprogram laboratory operated by Battelle for the U.S. Department of Energy under Contract DE-AC05-76RL01830. The proteomics data presented were processed by the Instrument Development Laboratory at the Environmental Molecular Sciences Laboratory (EMSL). EMSL is a national scientific user facility supported by the DOE. We thank Thomas Taverner and Yuliya Karpievitch from the Biological Separations and Mass Spectrometry group at PNNL for providing the model-based filtering routine and assistance with its application.
Supporting Information Available
Seven supporting documentation files are available. The first is the supporting documentation on the simulation and evaluation of data sets to evaluate the capability of the G-test to identify qualitative data types. Six supporting figures are provided for more detailed descriptions of (1) the distribution fit for the simulated data, (2) the sensitivity and specificity of the G-test on the simulated data, (3) the sensitivity and specificity comparing the G-test to ANOVA and Kruskal−Wallis on the simulated data sets, (4) MatLab code to compute the G-value in eq 2, (5) MatLab code to compute the G-filter in eq 3, and (6) MatLab code to implement the GA-filter. This material is available free of charge via the Internet at http://pubs.acs.org.
Funding Statement
National Institutes of Health, United States
Supplementary Material
References
- Brusniak M. Y.; Bodenmiller B.; Campbell D.; Cooke K.; Eddes J.; Garbutt A.; Lau H.; Letarte S.; Mueller L. N.; Sharma V.; Vitek O.; Zhang N.; Aebersold R.; Watts J. D. Corra: Computational framework and tools for LC-MS discovery and targeted mass spectrometry-based proteomics. BMC Bioinf. 2008, 9, 542. [DOI] [PMC free article] [PubMed] [Google Scholar]
- Kiebel G. R.; Auberry K. J.; Jaitly N.; Clark D. A.; Monroe M. E.; Peterson E. S.; Tolic N.; Anderson G. A.; Smith R. D. PRISM: a data management system for high-throughput proteomics. Proteomics 2006, 6 (6), 1783–90. [DOI] [PubMed] [Google Scholar]
- Wang G.; Wu W. W.; Zeng W.; Chou C. L.; Shen R. F. Label-free protein quantification using LC-coupled ion trap or FT mass spectrometry: Reproducibility, linearity, and application with complex proteomes. J. Proteome Res. 2006, 5 (5), 1214–23. [DOI] [PubMed] [Google Scholar]
- Zhu Z.; Boobis A. R.; Edwards R. J. Identification of estrogen-responsive proteins in MCF-7 human breast cancer cells using label-free quantitative proteomics. Proteomics 2008, 8 (10), 1987–2005. [DOI] [PubMed] [Google Scholar]
- Pavelka N.; Fournier M. L.; Swanson S. K.; Pelizzola M.; Ricciardi-Castagnoli P.; Florens L.; Washburn M. P. Statistical similarities between transcriptomics and quantitative shotgun proteomics data. Mol. Cell. Proteomics 2008, 7 (4), 631–44. [DOI] [PubMed] [Google Scholar]
- Polpitiya A. D.; Qian W. J.; Jaitly N.; Petyuk V. A.; Adkins J. N.; Camp D. G. 2nd; Anderson G. A.; Smith R. D. DAnTE: a statistical tool for quantitative analysis of -omics data. Bioinformatics 2008, 24 (13), 1556–8. [DOI] [PMC free article] [PubMed] [Google Scholar]
- Li Q.; Roxas B. A. An assessment of false discovery rates and statistical significance in label-free quantitative proteomics with combined filters. BMC Bioinf. 2009, 10, 43. [DOI] [PMC free article] [PubMed] [Google Scholar]
- Troyanskaya O.; Cantor M.; Sherlock G.; Brown P.; Hastie T.; Tibshirani R.; Botstein D.; Altman R. B. Missing value estimation methods for DNA microarrays. Bioinformatics 2001, 17 (6), 520–5. [DOI] [PubMed] [Google Scholar]
- Aittokallio T. Dealing with missing values in large-scale studies: microarray data imputation and beyond. Briefings Bioinf. 2010, 11 (2), 253–64. [DOI] [PubMed] [Google Scholar]
- Celton M.; Malpertuy A.; Lelandais G.; de Brevern A. G. Comparative analysis of missing value imputation methods to improve clustering and interpretation of microarray experiments. BMC Genomics 2010, 11, 15. [DOI] [PMC free article] [PubMed] [Google Scholar]
- Bafna V.; Edwards N. SCOPE: a probabilistic model for scoring tandem mass spectra against a peptide database. Bioinformatics 2001, 17 (1), S13–21. [DOI] [PubMed] [Google Scholar]
- Cannon W. R.; Jarman K. H.; Webb-Robertson B. J.; Baxter D. J.; Oehmen C. S.; Jarman K. D.; Heredia-Langner A.; Auberry K. J.; Anderson G. A. Comparison of probability and likelihood models for peptide identification from tandem mass spectrometry data. J. Proteome Res. 2005, 4 (5), 1687–98. [DOI] [PubMed] [Google Scholar]
- Eng K.; McCormack A. L.; Yates J. R. III. An approach to correlate tandem mass spectral data of peptides with amino acid sequences in a protein database. J. Am. Soc. Mass Spectrom. 1999, 5, 976–989. [DOI] [PubMed] [Google Scholar]
- Zhang N.; Aebersold R.; Schwikowski B. ProbID: a probabilistic algorithm to identify peptides through sequence database searching using tandem mass spectral data. Proteomics 2002, 2 (10), 1406–12. [DOI] [PubMed] [Google Scholar]
- Karpievitch Y.; Stanley J.; Taverner T.; Huang J.; Adkins J. N.; Ansong C.; Heffron F.; Metz T. O.; Qian W. J.; Yoon H.; Smith R. D.; Dabney A. R. A statistical framework for protein quantitation in bottom-up MS-based proteomics. Bioinformatics 2009, 25 (16), 2028–34. [DOI] [PMC free article] [PubMed] [Google Scholar]
- Daly D. S.; Anderson K. K.; Panisko E. A.; Purvine S. O.; Fang R.; Monroe M. E.; Baker S. E. Mixed-effects statistical model for comparative LC-MS proteomics studies. J. Proteome Res. 2008, 7 (3), 1209–17. [DOI] [PubMed] [Google Scholar]
- Metz T. O.; Qian W. J.; Jacobs J. M.; Gritsenko M. A.; Moore R. J.; Polpitiya A. D.; Monroe M. E.; Camp D. G. II; Mueller P. W.; Smith R. D. Application of proteomics in the discovery of candidate protein biomarkers in a diabetes autoantibody standardization program sample subset. J. Proteome Res. 2008, 7 (2), 698–707. [DOI] [PMC free article] [PubMed] [Google Scholar]
- Smith R. D.; Anderson G. A.; Lipton M. S.; Pasa-Tolic L.; Shen Y.; Conrads T. P.; Veenstra T. D.; Udseth H. R. An accurate mass tag strategy for quantitative and high-throughput proteome measurements. Proteomics 2002, 2 (5), 513–23. [DOI] [PubMed] [Google Scholar]
- Jaitly N.; Mayampurath A.; Littlefield K.; Adkins J. N.; Anderson G. A.; Smith R. D. Decon2LS: An open-source software package for automated processing and visualization of high resolution mass spectrometry data. BMC Bioinf. 2009, 10, 87. [DOI] [PMC free article] [PubMed] [Google Scholar]
- Monroe M. E.; Tolic N.; Jaitly N.; Shaw J. L.; Adkins J. N.; Smith R. D. VIPER: an advanced software package to support high-throughput LC-MS peptide identification. Bioinformatics 2007, 2315, 2021–3. [DOI] [PubMed] [Google Scholar]
- Anderson K. K.; Monroe M. E.; Daly D. S. Estimating probabilities of peptide database identifications to LC-FTICR-MS observations. Proteome Sci. 2006, 4, 1. [DOI] [PMC free article] [PubMed] [Google Scholar]
- Beagley N.; Stratton K. G.; Webb-Robertson B. J. VIBE 2.0: visual integration for bayesian evaluation. Bioinformatics 2010, 26 (2), 280–2. [DOI] [PMC free article] [PubMed] [Google Scholar]
- Webb-Robertson B. J.; McCue L. A.; Beagley N.; McDermott J. E.; Wunschel D. S.; Varnum S. M.; Hu J. Z.; Isern N. G.; Buchko G. W.; McAteer K.; Pounds J. G.; Skerrett S. J.; Liggitt D.; Frevert C. W. A Bayesian integration model of high-throughput proteomics and metabolomics data for improved early detection of microbial infections. Pac. Symp. Biocomput. 2009, 451–63. [PMC free article] [PubMed] [Google Scholar]
- Ott R. L.; Longnecker M.. An Introduction to Statistical Methods and Data Analysis, 6th ed.; Brooks/Cole: Belmont, 2010. [Google Scholar]
- Hochberg Y.; Benjamini Y. More powerful procedures for multiple significance testing. Stat. Med. 1990, 9 (7), 811–8. [DOI] [PubMed] [Google Scholar]
- Nesvizhskii A. I.; Keller A.; Kolker E.; Aebersold R. A statistical model for identifying proteins by tandem mass spectrometry. Anal. Chem. 2003, 75 (17), 4646–58. [DOI] [PubMed] [Google Scholar]
- Hu J.; Li H.; Waterman M. S.; Zhou X. J. Integrative missing value estimation for microarray data. BMC Bioinf. 2006, 7, 449. [DOI] [PMC free article] [PubMed] [Google Scholar]
Associated Data
This section collects any data citations, data availability statements, or supplementary materials included in this article.


