Abstract
In vertebrates, the adult form emerges from the embryo by mobilization of precursors or adult stem cells. What different cell types these precursors give rise to, how many precursors establish the tissue or organ, and how they divide to establish and maintain the adult form remain largely unknown. We use the pigment pattern of the adult zebrafish fin, with a variety of clonal and lineage analyses, to address these issues. Early embryonic labeling with lineage-marker-bearing transposons shows that all classes of fin melanocytes (ontogenetic, regeneration and kit-independent melanocytes) and xanthophores arise from the same melanocyte-producing founding stem cells (mFSCs), whereas iridophores arise from distinct precursors. Additionally, these experiments show that, on average, six and nine mFSCs colonize the caudal and anal fin primordia, and daughters of different mFSCs always intercalate to form the adult pattern. Labeled clones are arrayed along the proximal-distal axis of the fin, and melanocyte time-of-differentiation lineage assays show that although most of the pigment pattern growth is at the distal edge of the fin, significant growth also occurs proximally. This suggests that leading edge melanocyte stem cells (MSCs) divide both asymmetrically to generate new melanocytes, and symmetrically to expand the MSCs and leave quiescent MSCs in their wake. Clonal labeling in adult stages confirms this and reveals different contributions of MSCs and transient melanoblasts during growth. These analyses build a comprehensive picture for how MSCs are established and grow to form the pigment stripes of the adult zebrafish fins.
Keywords: Organ-founding stem cell, Clonal analysis, Melanoblast, Melanocyte, Zebrafish, Regeneration
INTRODUCTION
How the adult form arises from the embryo remains one of the greatest challenges in developmental biology. One mechanism employed by metazoans is the use of adult stem cells, which are established during embryonic stages for recruitment during late larval stages (Hultman and Johnson, 2010), metamorphosis (Booker and Truman, 1987; Budi et al., 2008) or regeneration (Hultman et al., 2009). These stem cells may also be used to found the primordia for tissues and organs that will grow into the adult. How many progenitors (organ founding stem cells, FSCs) establish a tissue or organ, what types of cells they give rise to, and how they divide to establish the adult form are some of the questions of adult morphogenesis. Answers can be weakly inferred from anatomical and histochemical analysis, gene expression studies or effects of mutation on different cells of the organ. A more direct understanding of the role of adult stem cells in organ development may be achieved by studying the cell lineages that contribute to the organ, similar to analyses used to study development of the embryo (Keller, 1975; Kimmel et al., 1990; Logan and McClay, 1997; Zackson, 1984).
The development of the medaka Tol2 transposon for transgenesis in zebrafish (Kawakami, 2004) provides a means to generate genetically marked clones. Typically, an engineered transposon is co-injected with Tol2 transposase mRNA into the one- or two-cell embryo. Although some transposition may commence nearly immediately, most transpositions seem to occur later, but before the 1000-2000 cell stage (∼4 hours or before the onset of gastrulation), resulting in small clones. Extensive cell mixing during gastrulation tends to separate the labeled daughters of the clone, further enhancing the use of transposon-injected embryo for analysis of adult organogenesis. Presumably, adult clones reveal stable integration of the transgene. Finally, several markers cloned into the Tol2 transposon can be used for lineage work, including the fugu Tyrp1 promoter driving GFP (fTyrp>GFP) (Hultman and Johnson, 2010; O'Reilly-Pol and Johnson, 2008; O'Reilly-Pol and Johnson, 2009; Zou et al., 2006). Transgenics for this marker express GFP weakly in somatic muscle (which is absent in the fin), and strongly in all differentiated melanocytes, making it appropriate for fin melanocyte lineage analysis. In addition, the Xenopus EF1α promoter drives GFP (EF1α>GFP) (Johnson and Krieg, 1995) with ubiquitous expression, making it suitable to compare lineage relationship of melanocytes with other cell types in the fin.
Here, we use clonal and lineage analyses to study the contribution of melanocyte lineages to the adult fin. Clones generated by the fTyrp>GFP transposon reveal the number of melanocyte-producing FSCs (mFSCs) that contribute to the anal and caudal fins, melanin-less differentiation in PTU shows where new melanocytes develop, X-irradiation induced clones uncover the role of individual stem cells in the growing fin, and labeling with the EF1α>GFP transposon shows the relationship of melanocytes to other pigmented cells. We also show that ontogenetic and regeneration melanocytes of the adult fin are derived from the same mFSCs, and that kit-dependent and kit-independent regeneration melanocytes (Rawls and Johnson, 2000) are also derived from the same lineages. These studies provide a thorough analysis of how many mFSCs contribute to the adult fin, how these stem cells grow as the fin grows, and how different types of melanocytes and other pigment cells are related from the mFSCs.
MATERIALS AND METHODS
Generation of mosaic animals
To generate fTyrp>GFP mosaic fish used in Figs 1, 2, 4, 6 and 7, we injected one- or two-cell kitj1e99 (referred to as kit-ts) embryos with 5 pg fTyrp>GFP lineage marker (Zou et al., 2006) and 5 pg Tol2 capped transposase mRNA (Kawakami, 2004). For dual color mosaics in Fig. 4B, we included 5 pg of a transposon plasmid where the GFP of the fTyrp>GFP transposon was replaced by mCherry (R. Tryon and S.L.J., unpublished). Injected fish were reared to mature stages at 25°C, the permissive temperature for kit-ts, treated with 100 μg/ml epinephrine for approximately 5 minutes to contract melanosomes, anesthetized and examined for GFP+ clones in anal and caudal fins.
Fig. 1.
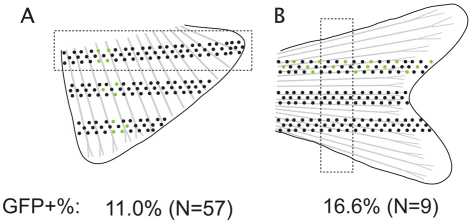
Calculating single lineage contribution to stripe pattern of fins. (A,B) Broken lines outline proximal regions where labeled (green) and unlabeled (black) cells are counted to determine single lineage contribution to (A) anal fins and (B) caudal fins.
Fig. 2.
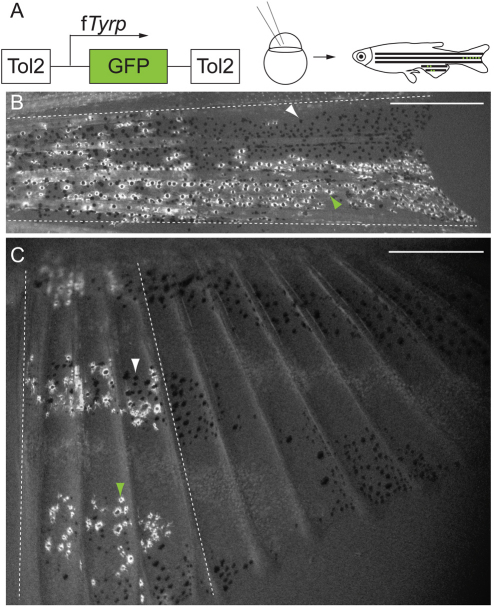
Labeled melanocyte clones extend proximo-distally in the caudal and anal fins. (A) fTyrp>GFP lineage transposon (Zou et al., 2006) was injected into one- or two-cell embryos, which were reared to maturity prior to screening for melanocyte clones in fins. (B,C) Examples of labeled melanocyte clones in center stripe, of caudal fin (B), and anterior 4 fin rays, of anal fin (C). White arrowheads indicate GFP– melanocytes; green arrowheads indicate GFP+ melanocytes; broken white lines show outer boundaries of clones. Scale bars: 0.5 mm.
Fig. 4.
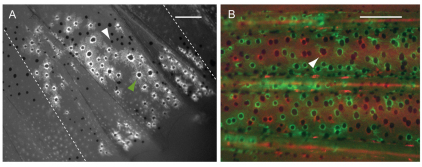
Melanocytes descended from different mFSCs intermix. (A) Fluorescence image of labeled anal fin from a mosaic animal generated by injection of fTyrp>GFP transposon. Non-labeled melanocytes (white arrowhead) are present within the territory of the GFP+ melanocytes (green arrowhead). Broken lines show the border of the clone. (B) Fluorescence image of central stripe from a fish co-injected with fTyrp>GFP and fTyrp>mCherry transposons. All melanocytes in this area are labeled either with GFP (green) or mCherry (red). Arrowhead indicates what appears to be a melanocyte of both colors, but in fact is two overlapping red and green melanocytes at different focal depth in the fin. Scale bars: 0.2 mm.
Fig. 6.
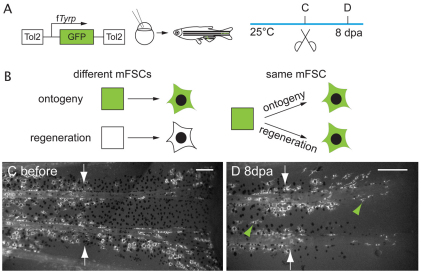
Ontogenetic melanocytes and regeneration melanocytes develop from the same mFSCs. (A) Experimental procedure: kit-ts embryos were injected with the fTyrp>GFP lineage marker transposon and reared to adult stages. Following identification of fin melanocyte clones, fins were amputated and allowed to regenerate for 8 days in 25°C to reveal whether labeled clones also contribute to the regenerate. (B) Cartoon depicting the two possible relationships between ontogenetic and regeneration melanocytes. Model on the left shows predictions if ontogenetic and regeneration melanocytes develop from different mFSCs (square), model on the right shows predictions if ontogenetic and regeneration melanocytes develop from the same mFSCs. (C) Fluorescence image of labeled clone in the caudal fin center stripe before amputation. (D) Fluorescence image of the same fin at 8 dpa. White arrows indicate amputation plane. The regenerate has GFP+ melanocytes (green arrowheads) distal to the GFP+ ontogenetic melanocytes in the stump. Scale bars: 0.2 mm.
Fig. 7.
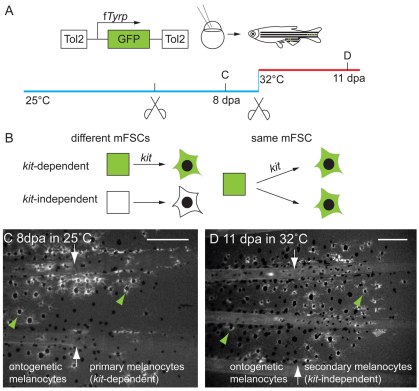
kit-dependent and kit-independent regeneration melanocytes develop from the same mFSC. (A) kit-ts embryos were injected with the fTyrp>GFP lineage marker transposon and reared to adult stage at the permissive temperature. Following identification of fin ontogenetic and primary, kit-dependent regeneration melanocyte clones, fins were amputated again proximal to the original amputation plane and challenged to regenerate at the restrictive temperature for a further 11 days to reveal whether clones also contribute to kit-independent regeneration melanocytes. (B) How the kit-dependent and kit-independent regeneration melanocytes are related to each other: either they arise from different mFSCs (square), shown on the left; or they come from the same mFSC, shown on the right. (C,D) Fluorescence images of the same caudal fin clone regeneration (C) 8 dpa at 25°C and (D) 11 days after subsequent amputation and regeneration at 32°C. At the permissive and restrictive temperatures, GFP+ melanocytes (green arrowheads) regenerated distal to the GFP+ melanocytes in the stump. White arrows indicate amputation planes. Scale bars: 0.2 mm.
Mosaic animals in Fig. 8 were generated with a Tol2 transposon bearing the Xenopus EF1α promoter (Johnson and Krieg, 1995) driving GFP expression (EF1α >GFP, T. Chen and S.L.J., unpublished). We injected 25 pg EF1α >GFP transposon plasmid and 20 pg capped transposase mRNA into one- or two-cell mlpha/mlpha (Sheets et al., 2007) embryos, sorted for GFP+ embryos at 24 hours, and reared these to adult stages before scoring for melanocyte, xanthophore or iridophore clones.
Fig. 8.
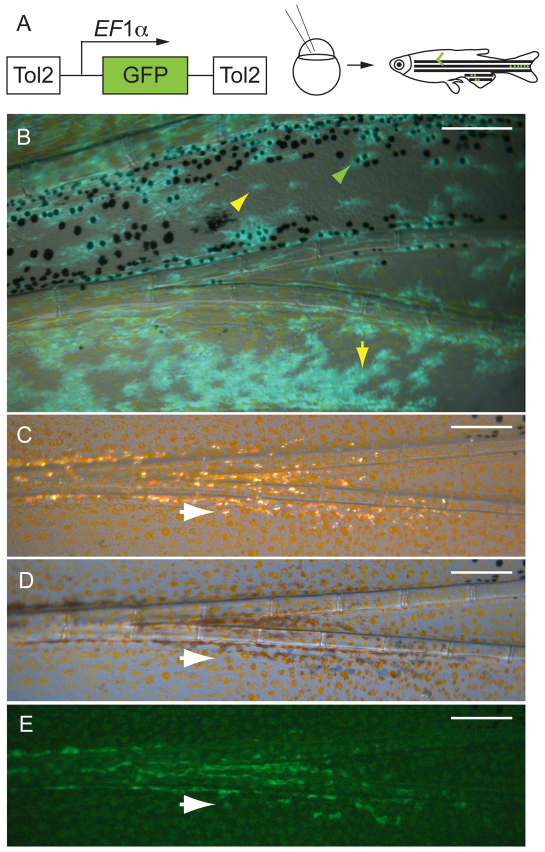
Melanocytes and xanthophores come from the same founding stem cells (mFSCs), and iridophores arise from a distinct founding stem cell (iFSC). (A) EF1α>GFP lineage marker transposon was injected into one- or two-cell stage mlpha embryos. The mosaic embryos were reared to maturity, then screened for GFP+ clones in the fins. (B) Fluorescence image of a labeled caudal fin clone in which both the melanocytes and xanthophores are labeled with GFP. Green arrowhead shows a labeled melanocyte; yellow arrowhead shows a covert xanthophore (lightly pigmented xanthophores within the melanocyte stripe) (Hirata et al., 2003; Hirata et al., 2005) and yellow arrow shows an overt xanthophore. (C-E) An iridophore clone. White arrows indicate the same iridophore in the three light conditions: (C) incident light, (D) transillumination and (E) GFP fluorescence. Scale bars: 0.2 mm.
Light and fluorescence microscopy
Microscopy was performed on an Olympus SZX12 fluorescence stereomicroscope. We used Olympus SZX-MGFP long-pass filter cube for detection of GFP in melanocytes and xanthophores, rather than the narrow band pass Chroma 41017 filter cube we typically use for visualizing GFP, and the Olympus SZX-MG filter for visualizing mCherry. We used a ProgRes digital camera for photography. Images were manipulated in Photoshop by modifying the level of fluorescence across the entire image and converted to gray scale to improve contrast. Fig. 1 shows the schematics of the area of anal and caudal fins in which GFP+ melanocytes and total melanocytes were counted to determine the number of clones that make up the fin melanocytes.
Melanocyte time-of-differentiation assay
Six-week-old mlpha/mlpha; Tg(fTyrp>GFP)j900 fish were kept in 0.2 mM PTU (N-Phenylthiourea, Sigma, P7629) in 1 liter system water for 2 weeks, fed daily, and PTU and water changed every other day. After 2 weeks, the caudal fin of each fish was photographed to reveal the proportion of GFP+, melanin– melanocytes in proximal, middle and distal thirds of the middle stripe.
X-ray induction of albino clones
Five-week-old albino/+; Tg(fTyrp>GFP)j900 fish (∼15.5 mm) were anesthetized and irradiated for 5 minutes with 920 Rads in a Faxitron X-Ray 43855D cabinet (120 volts, 40.6 cm away from the source), then allowed to grow a further 6 weeks before examination for albino clones.
Fin amputation and regeneration
Fins were amputated and allowed to regenerate as described previously (Johnson and Bennett, 1999). For sequential amputations, the second amputation plane was immediately proximal to the previous one.
RESULTS
Transposon-mediated generation of melanocyte clones in the adult fin
We first generated clones of melanocytes expressing GFP under the control of the fugu tyrosinase related protein 1 promoter (Zou et al., 2006). These clones were generated by injecting a Tol2 transposon carrying the fTyrp>GFP expression cassette, which marks differentiated melanocytes, into one- or two-cell embryos (Fig. 2A). The Tol2 transposon generally integrates early in development, with the majority of integration events occurring before the 1000-2000 cell stage (S. Higdon and S.L.J., unpublished), well before the earliest report of anal or caudal fin primordium at 1.5 dpf (days post fertilization) (Hadzhiev et al., 2007). Thus, several cell divisions and extensive cell mixing during gastrulation probably separate the transposon integration event from the time of colonization of the fin primordium by labeled mFSCs. Presumably, other pigmented cells are derived from the same early integration event that gives rise to labeled fin melanocytes. This possibility is explored with a different lineage marker later in this report. To ensure that the labeled cells identified in fins result from single mFSC, we injected less transposon DNA (5 pg/embryo) than we would typically inject to generate transgenic animals (25 pg/embryo). Of 690 embryos injected, 302 survived to adult stage for our analysis. Of these, 35 fish (12%) had GFP+ caudal fin clones and 85 fish (28%) had GFP+ anal fin clones. These numbers include 17 fish that had clones in both fins, similar to that expected (∼10 fish with both fins labeled) if colonization of each fin by labeled FSCs occurs independently. These clones are sufficiently rare to also suggest that most of the labeling observed within a fin is monoclonal, with perhaps 12% of labeled caudal fins and 28% of labeled anal fins resulting from polyclonal events. We also note that the individual clones are each restricted to discrete contiguous regions of the fin (Fig. 2). We rarely find labeling that skip across fin rays (for example labeling in fin rays 1-3 and 5-7), which would be expected if multiple labeled mFSCs contributed significantly to our data set. Thus, these results suggest that multiple mFSCs colonize the fin, and that clone patterns can be used to understand mechanisms of pigment pattern growth (below).
Melanocyte clones grow on the proximal-distal axis of the fin
We were first interested in the axis of growth of the melanocyte pigment pattern. Several possible modes of growth could be revealed by the distribution of GFP+ melanocyte clones. First, melanocyte pattern growth might occur along the longitudinal axis of the fin, or the fin ray. Following colonization of the fin primordium, as the fin grows, proliferation of these cells would extend the clone distally. Such a model predicts that we should find clones that extend the entire length of the fin, with lateral edges of the clone parallel to the fin rays. A second model is that the melanocyte pigment pattern grows radially. As the fin grows, expansion of each clone would result in patches of labeled melanocytes that had proximal or distal boundaries within the fin. We have observed this mode of growth in expansion of skin clones (C. Joyce and S.L.J., unpublished). In both models, the mode of growth is independent of the stripe pattern, which arises from melanocytes after differentiation, either by death of melanocytes from regions that will be xanthophore stripe, or migration from the xanthophore region into the melanocyte stripe, or both (Goodrich and Nichols, 1931). We can consider a third model by which the mechanism of growth directly reflects the organization of the differentiated stripe itself. For this model, imagine that the fin primordium has precursors dedicated to each of the stripes. This predicts that labeled clones might be found completely within a single stripe. This model could be distinguished from the first model by observations in the anal fin, where stripes are nearly perpendicular to the fin rays.
Examination of the clones showed that the melanocyte pattern grows along the proximal-distal axis. Consistent with the first model, in all 35 caudal fin clones, labeled melanocytes were found extending from the base of the fin to its distal tip (Fig. 2B). Where clone margins were apparent within melanocyte stripes, the boundaries of the clone were parallel to fin rays (not shown). This distribution is inconsistent with the predictions of the second model of radial growth. Similarly, in all 85 anal fins with labeled clones, the presence of labeled melanocytes in the proximal stripe was always associated with labeled melanocytes along the same fin ray in the distal stripes (Fig. 2C). Moreover, the boundaries of the labeled clone appear in the same relationship to the fin ray from the proximal to the distal stripe, consistent with clonal expansion of the melanocyte pattern along the proximal-distal axis of fin ray growth, and inconsistent with the models of growth by radial expansion or organized along the stripe identity.
Contributions of distal and intercalatory growth to the melanocyte stripe
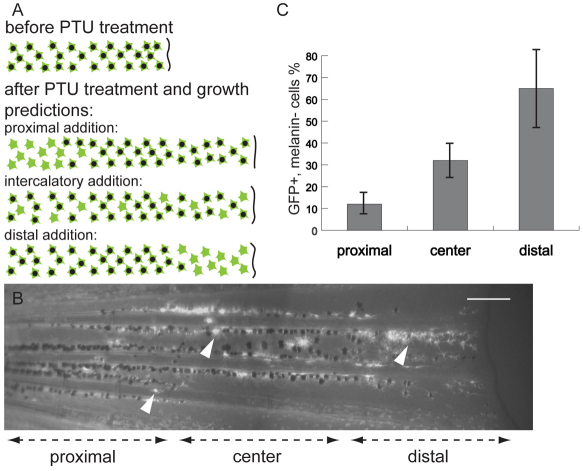
The finding that melanocyte pattern growth is along the proximal-distal axis does not yet tell us whether growth of the pattern is occurring at the distal end of the fin; or from the proximal end of the fin, with growth pushing differentiated melanocytes distally; or whether growth occurs along the entire proximal-distal axis (Fig. 3A). To distinguish possible contributions of each mechanism, we employed a melanocyte time-of-differentiation assay (Hultman and Johnson, 2010) to determine where new melanocytes were differentiating in growing fins. This method uses the tyrosinase inhibitor phenolthiourea (PTU) that blocks melanin synthesis, to render newly differentiating melanocytes unpigmented, and the Tg(fTyrP>GFP)j900 transgene to reveal their presence. Rapidly growing juvenile fish were treated with PTU for 2 weeks, during which time they grew from average 13.5 mm to 18.0 mm in length. They were then examined for the presence of new melanocytes in the proximal, medial or distal third of the caudal fin center stripe. This revealed that all regions contained new melanocytes, but the fraction of new melanocytes was the greatest in the distal third of the stripe, which approximates the region of fin ray growth over the course of PTU treatment. Here, 65% of melanocytes were GFP+ melanin–, compared with 30% and 12% unmelanized melanocytes in the middle and proximal thirds (Fig. 3B,C). This suggests that the majority of melanocyte stripe growth is distal, but that intercalatory growth may also occur. As the fish grow longer, they also gain width and height, and the melanocyte stripe width also increases. This suggests that in addition to melanocyte stem cells (MSCs) contributing to distal addition, MSCs are also set aside to allow for growth in other dimensions. It is likely that these MSCs are the same as those revealed by melanocyte regeneration in the regenerating fin (Rawls and Johnson, 2000).
Fig. 3.
Newly formed melanocytes arise primarily at the distal edge of the fin. (A) Predictions of different models for site of melanocyte growth revealed by melanocyte time-of-differentiation assay (Hultman and Johnson, 2010). This method combines PTU treatment (to suppress melanin synthesis in newly differentiated melanocytes) with the Tg(fTyrp>GFP)j900 transgenic marker to reveal newly differentiating melanocytes. Solid green stars represent newly developed melanin– GFP+ melanocytes. Green stars with black centers represent older melanin+ GFP+ melanocytes. (B) Fluorescence image of central melanocyte stripe in caudal fin of Tg(fTyrp>GFP)j900 transgenic fish following growth for 2 weeks in the presence of PTU. White arrowheads indicate the melanin– GFP+ newly differentiated melanocytes. Near the distal end, almost all melanocytes are melanin– GFP+. Scale bar: 0.2 mm. (C) Quantitative analysis showing percentage of new melanocytes in each of the proximal, center and distal regions of the growing center stripe. Error bars indicate standard deviation.
Melanocyte clones occupy overlapping territories
We were interested to know how the progeny of different mFSCs interact with each other in the fin. One hypothesis is that each clone occupies an exclusive territory, and prevents melanocytes derived from other mFSCs from intermixing with them. This hypothesis predicts that within the border of a labeled clone, 100% of the melanocytes would be GFP+. The alternative hypothesis that each lineage does not colonize an exclusive territory predicts that labeled cells would be interspersed with unlabeled melanocytes.
In our analysis of labeled clones, we found that all of the mosaic fins (85 anal fins, 35 caudal fins) have GFP– melanocytes within the border of the GFP+ clones. Fig. 4A shows a typical clone in the anal fin. As it was possible that transgene silencing was responsible for unlabeled melanocytes within the clone boundaries, we further explored this by co-injecting embryos with two lineage markers. One is the original fTyrp>GFP transposon used above, the second is the same transposon with eGFP replaced by mCherry (fTyrp>mCherry; R. Tryon and S.L.J., unpublished). Fig. 4B shows a fin from such doubly injected embryos, where approximately half of the melanocytes express GFP, and the remainder express mCherry. These differentially labeled clones confirmed that daughters of different mFSCs share overlapping territories.
We were next interested in understanding how many lineages could overlap within a region. To address this, we examined anal fin clones for regions within neighboring fin rays, where the clone extended on each side of the fin rays, providing a natural and unbiased border for our analysis. We then counted labeled and unlabeled melanocytes between the fin rays. Analysis of 21 such regions showed labeled melanocytes contributed 46.7±13.4% of total melanocytes in their territory, suggesting that typically daughters from two different mFSCs share a region.
Interestingly, we never found regions where all melanocytes are derived from a single mFSC. This raises the possibility that the fin melanocyte pattern has two distinct types of melanocytes, each of which is typically present in the stripe, contributing different physiological roles to the stripe that we have not yet discerned.
Number of mFSCs contributing to the anal and caudal fin
We were also interested in how many mFSCs contributed to the melanocyte pattern in the fins. To determine this, we counted labeled and unlabeled melanocytes in a proximal cross-sectional region perpendicular to all the fin rays (Fig. 1, see Materials and methods). We found that clones in the anal fin extend in width from 1 to 10 (average 3.3) fin rays and contribute an average of 11.0±9.2% (n=57) of melanocytes, suggesting, on average, that nine mFSCs colonize the anal fin primordium. Clones in the caudal fin span from 1 to 11 (average 6.6) fin rays, and contribute an average of 16.6±13.5% (n=9) of the melanocytes, suggesting six mFSCs. We note that although clone generation rate is relatively rare (28% for anal fin, 12% for caudal fin), some of the fins may have multiple clones. Proportionally adjusting for this yields an upper estimate of 12 and 7 mFSCs contribute to the anal and caudal fins.
Late labeling by X-irradiation reveals expanded MSC population and different roles for MSCs and melanoblasts
We were next interested in the role of individual MSCs in the melanocyte pattern growth. One possibility is that distal growth of each clone is sustained by a single MSC whose daughters span a territory as wide as 11 fin rays in the caudal fin. Alternatively, the mFSC that colonizes the fin primordium divides symmetrically to give rise to multiple MSCs, which sustain the growth of much smaller territories. We could distinguish between the two models if we could induce clonal labeling at later stages of fin growth. For this, we used fish heterozygous for the albino pigment mutation. Streisinger et al. (Streisinger et al., 1989) have previously shown that they could induced golden clones from heterozygotes with ionizing radiation. We chose to use albino because we had previously shown that albino acts cell autonomously (Parichy et al., 1999) and albino cells remain unpigmented, in contrast to golden melanocytes that become darkly pigmented with time. Thus, when albino/+ cells are X-irradiated, repair or recombination mechanisms would sometimes cause loss-of-heterozygosity (LOH) at the albino locus (by loss or new mutation of the wild-type allele, or by mitotic recombination proximal to the albino locus). In the melanocyte lineage, a LOH event at the albino locus could result in development of unpigmented albino melanocytes. In the Tg(fTyrp>GFP) background, GFP reveals the albino clones.
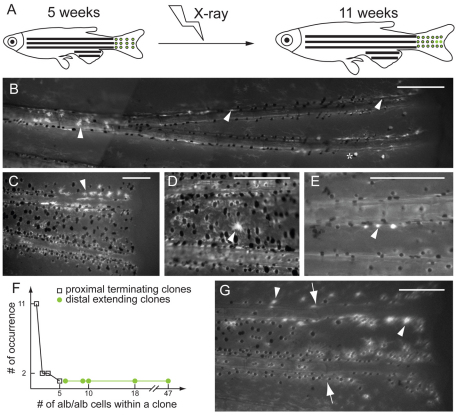
We exposed 5-week-old albino/+; Tg(fTyrp>GFP) fish with 920 Rads of X-rays, and reared them for a further 6 weeks (Fig. 5A). Out of 488 fish examined, we found 22 with albino (melanin–, GFP+) clones in their caudal fins (Fig. 5F). We failed to find albino clones in 121 albino/+ unirradiated siblings, indicating that the albino clones in the 22 fish from the irradiated pool were indeed a result of X-irradiation. These clones were distributed in two classes. One class consisted of 17 clones, ranging from one to five albino melanocytes (Fig. 5D,E). These clones were found at intermediate proximal-distal (PD) positions of the fin, presumably reflecting the position of the target cell at the time of irradiation. That these clones have small numbers of albino melanocytes, and do not extend to the distal, growing edge of the fin argues that the X-ray induced LOH event did not occur in a MSC, but perhaps a melanoblast with the potential for one to three cell divisions prior to terminal differentiation. Fin regeneration following amputations either immediately proximal, internal or immediately distal of the albino melanocytes failed to result in albino melanocytes in the regenerate (not shown). A second class of five clones was also observed with 6 to 47 albino melanocytes (Fig. 5B,C). Like the first class, these clones had proximal borders at intermediate PD positions; however, these clones extended to the distal margin of the fin, indicating that the clone continued to generate new cells throughout growth of the fin. Furthermore, when a member of this class was amputated through the middle of the clone, the fin regenerated albino melanocytes directly distal of albino melanocytes in the stump (Fig. 5G). Because regeneration melanocytes develop from MSCs (Rawls and Johnson, 2000), this result suggests that these distal-extending clones were indeed the result of X-irradiation and LOH at the albino locus in the MSC itself. That these distal-extending clones are generally less than a fin ray wide suggests the mFSCs that colonize the fin primordium initially divide symmetrically several times to generate one or more MSCs per fin ray, to support distal growth of the fin and its pigment pattern.
Fig. 5.
X-ray induction of albino clones in mature stage of albino/+; Tg(fTyrp>GFP)j900 fish reveals growth potential of MSCs and melanoblasts. (A) At 5 weeks, fish are exposed to 920 Rads of X-rays to induce loss-of-heterozygosity at the albino locus. albino melanocytes are revealed by expression from the fTyrp>GFP transgene upon examination 6 weeks later. (B,C) Fluorescence images of two examples of clone class that extends distally. Clones of albino cells begin in the interior of the fin and extend distally to the edge of the fin. Asterisk denotes the white cells, which reflect incident light, rather than fluorescence. (D,E) Fluorescence images of two examples of clone class located in proximal position without extending to distal edge of fin. (F) Graph shows occurrence number of clones versus the number of albino melanocytes for each clone class. (G) Regeneration of fin carrying a distal-extending clone. (B-E,G) Arrowheads indicate albino melanocytes, and (G) arrows indicate the amputation plane. Scale bars: 0.2 mm.
Relationship between different types of fin melanocytes
Several types of melanocytes have been described in the zebrafish fin. These include: (1) the ontogenetic melanocytes; (2) primary (kit-dependent) regeneration melanocytes, which contribute all of the regeneration melanocytes before 8 dpa (days post amputation) and most of the melanocytes that regenerate after 8 days; and (3) secondary (kit-independent) regeneration melanocytes that develop after 8 dpa (Rawls and Johnson, 2000). These melanocyte types can be distinguished by time of development and dependence on kit function. It was unknown whether they arise from the same or different lineages.
To distinguish whether ontogenetic and regeneration melanocytes in the adult fin arise from the same mFSC, we used the fTyrp>GFP transposon to generate clones in kit-ts mutants (Rawls and Johnson, 2001). They were reared at the permissive temperature, examined for clones, and the clone-bearing fins amputated and regenerated at the permissive temperature for a further 8 days (Fig. 6A). In each of 12 regenerated anal and 16 regenerated caudal fins, we found regenerated labeled melanocytes. We have previously shown that melanocytes in the regenerate arise from MSCs, rather than from migration of previously differentiated melanocytes (Rawls and Johnson, 2000). The boundaries of labeled melanocyte clones in the regenerate corresponded exactly to those of labeled melanocytes in the stump (Fig. 6C,D). We failed to observe GFP+ melanocytes arising in 199 regenerates that had no ontogenetic clones (not shown), which argues against transdifferention from other cell types contributing to melanocyte regeneration. Together, these data indicate that fin regeneration melanocytes arise from the same mFSC as ontogenetic melanocytes.
We were also interested in the relationship between primary (kit-dependent) and secondary (kit-independent) regeneration melanocytes. We had previously shown that kit-null mutant fins initially develop or regenerate without melanocytes, then after a delay of ∼1 week, melanocytes develop at more proximal positions (rather than initially differentiating in the distal growth region). We have suggested that these two types of melanocytes reflect different strategies of morphogenesis, the kit-dependent melanocytes providing the bulk of the melanocyte pattern, whereas the kit-independent melanocytes having regulatory or quality control functions, for example, filling in gaps in the kit-dependent melanocyte pattern (Rawls and Johnson, 2000). To determine whether kit-dependent and kit-independent regeneration melanocytes shared a common lineage, we again took advantage of the fTyrp>GFP clones generated and regenerated in the kit-ts mutant (described above). We amputated these fins a second time and shifted them to the restrictive temperature, so that only the secondary (kit-independent) melanocytes could regenerate (Fig. 7A). In 28 fish first identified with labeled ontogenetic and kit-dependent regeneration fin clones (Fig. 7C), all regenerated clones with equivalent labeling and identical clone borders when examined at 11 dpa at the restrictive temperature (Fig. 7D). Thus, we conclude that ontogenetic and kit-dependent and kit-independent regeneration melanocytes develop from the same mFSCs. Our finding with X-irradiation induced albino clones in adult fins (discussed above) now argues that ontogenetic and regeneration melanocytes not only come from the same mFSC that colonizes the fin, but also from the same MSCs responsible for growth and maintenance of the melanocyte pattern.
Melanocytes and xanthophores arise from the same fin progenitors
Clonal analysis has shown that melanocytes and xanthophores that develop in the embryo often arise from the same neural crest cell (Raible and Eisen, 1994). As these embryonic cells do not arise from a self-renewing stem cell (Hultman and Johnson, 2010), it remained an interesting issue whether melanocytes and xanthophores arise from the same FSCs in the adult fin. To address this, we used a transposon with a different lineage marker, EF1α>GFP, that is expressed ubiquitously in the fish and labels all daughters following the integration event. We injected 3917 mlpha embryos with this transposon (Fig. 8A) and screened 845 fish that survived to adulthood for labeled melanocyte clones. Failure of melanosome dispersion in mlpha mutants (Sheets et al., 2007) allows for easier identification of GFP+ melanocytes. We identified 22 fish with EF1α>GFP labeled melanocytes in their fins. Upon rescreening, we found in all 22 cases, the labeled melanocytes were also closely associated with labeled xanthophores (Fig. 8B). This association held for both anal and caudal fins. When we rescreened fins lacking melanocyte clones, we found no additional xanthophore clones. In three cases, fins with melanocyte/xanthophore (MX) clones also had labeled iridophores (see below). We found no other association of MX clones with labeling of other non-pigmented cell types in the fin, including other neural crest derivatives such as Schwann cells (not shown). These results indicate that a common FSC produces the melanocytes and xanthophores progeny of the fin, but no other cell type. Whether, during fin growth, the xanthophore develops from the same adult stem cell as the melanocytes, or whether mFSC segregates distinct MSCs and xanthophore stem cells (XSCs) is not resolved here.
To explore the relationship of iridophores with the MX lineage we also examined fins for labeling in the iridophores. In addition to three fins with labeled iridophores and MX clones described above, we found four additional labeled iridophore clones that had no labeled melanocytes or xanthophores. In fins with both MX clones and labeled iridophores, the boundaries of labeled iridophores was different from the boundaries of the MX clone, suggesting that the iridophore and MX lineages develop from different adult stem cells. The high rate of co-occurrence (3/7) may indicate that fin iridophore and MX lineages have a common precursor, which segregates these fates prior to colonization of the fin.
We were unable to relate a fourth pigment cell, the white cell, a melanocyte-like cell found at the tips of caudal fins (Johnson et al., 1995) to other pigmented cells, because we never found GFP label in the white cells.
Our analysis of melanocytes, xanthophores and iridophores reveals that all fin melanocytes, together with xanthophores, arise from the same mFSC, whereas fin iridophores arise from a distinct progenitor, that we can refer to as the iridophore-producing founding stem cell (iFSC).
DISCUSSION
We have used a variety of clonal and lineage analysis techniques to investigate how the pigment pattern is established and grows in the adult caudal and anal fins. Our methods included generating GFP-labeled clones in the early embryo by: integration of lineage-marker-bearing transposons; generating clones in adult tissue by X-ray induced loss-of-heterozygosity in albino/+ fish; and distinguishing between old and new melanocytes by blocking new melanin synthesis using the tyrosinase inhibitor PTU. These data present a comprehensive picture of the lineage relationships of the pigment cells in the adult fin, and insights into how these lineages are established and grow in the growing or regenerating fin.
Two types of organ founding pigment stem cells contribute to the fin stripe pattern
Clonal analysis shows two distinct lineages that contribute to the fin stripe pattern. One of these lineage types contributes all of the melanocytes and xanthophores of the stripe pattern, whereas the second lineage contributes the iridophores of the fin. That the majority of the iridophore clones occur without MX suggests that they arise from different FSCs. Furthermore, among clones where iridophores co-occur with MX, MX and iridophore labeling occupy different territories. We suggest that the high rate of co-occurrence of MX and iridophore clones reflects a common precursor at earlier stages of embryonic development, which segregates MX and iridophore fates before or concomitant with colonization of the fin primordium. The finding that melanocytes and iridophores arise from distinct FSCs is in contrast to recent reports that suggest that foxd3 and mitfa interactions regulate a choice between melanocyte and iridophore differentiation in the embryonic pigment pattern (Curran et al., 2010). This difference may reflect different strategies for developing pigment cells from stem cell intermediates in the adult and from direct development in early stages (Hultman and Johnson, 2010).
One surprise of this investigation was that all melanocytes develop from the same organ FSC, and probably from the same MSC. We had previously shown that there were two distinct classes of melanocytes, a kit-dependent melanocyte that develops at the growth front of ontogenetic and regenerating fins, and a kit-independent melanocyte that only differentiates in the interior parts of the fin. An attractive model for these different classes was that they developed from distinct stem cells. Clonal analysis in the temperature-sensitive kit mutant revealed that all kit-dependent melanocyte clones also produced kit-independent melanocytes when challenged to regenerate at the restrictive temperature. This tends to rule out that there are two distinct lineages of MSCs, and instead favors a model of different physiologies for recruiting melanocyte differentiation from the MSC. X-ray induced labeling in adult fins suggests that MSCs at the growth front both produce differentiated melanocytes, and lay down quiescent MSCs in their wake. We can now interpret our findings from these and previous studies to suggest a fundamental difference between the physiology of differentiation from a cycling MSC, which requires kit, and a quiescent MSC, which does not. It remains unclear whether melanocyte differentiation from the quiescent MSC uses a different receptor tyrosine kinase, for example, kitb (Mellgren and Johnson, 2005) for its differentiation.
Establishment and growth of the melanocyte pattern in the adult fin
Clonal analysis shows that melanocytes and xanthophores develop from the same FSC. As it is not clear when xanthophore fates segregate from melanocyte fates, and most of our observations are on melanocytes, below we focus on the melanocyte fates and ignore the potential contribution of xanthophores. The use of the terms mFSC and MSC is not meant to exclude that these stem cells do (mFSCs) or might (MSCs) also produce xanthophores.
Morphological evidence for the adult caudal fin primordium is first evident as early as 1.5 days (Hadzhiev et al., 2007), suggesting that the colonization of the fin primordium by fin mFSC is concomitant with, or subsequent to 1.5 dpf. The latest time by which the mFSC colonizes the fin is 1.5 wpf (weeks post fertilization) or 4.9 mm standard length, when post-larval melanocytes are first evident as the fin begins to extend (Parichy et al., 2009). Clonal analysis suggests that during this window on average of six and nine mFSCs colonize the caudal and anal fin primordia. This number is far smaller than the number of melanocyte precursors identified by clonal analysis in the mouse (Wilkie et al., 2002), or in our studies in the zebrafish (R. Tryon and S.L.J., unpublished) that suggest on the order of 100 neural crest precursors contribute to the embryonic melanocyte pattern. Our results suggest that there is a large pool of MSCs that might be available in the embryo, and only a few of these colonize discrete tissue or organ primordia, such as the adult fins.
We suggest that these founding precursors or mFSCs expand their numbers during the fin primordium stage (∼1.5 dpf-1.5 wpf). That the labeled clones extend distally with borders parallel to the fin ray, that each fin ray is colonized by on average two clones, and that the caudal fin has 18 fin rays suggest that by the onset of caudal fin ray outgrowth, these six precursors have now expanded to at least 36 precursors, but probably more. As these cells are now producing differentiated melanocytes, it is reasonable to refer to them as MSCs. Presumably, the small number of founding precursors first use symmetrical divisions to expand their numbers, then transit to start dividing asymmetrically approximately at the onset of fin growth and pigment pattern metamorphosis.
Our data suggest that as the fin rays grow, a front of MSCs keeps pace with the distal growth zone of the fin, dividing either asymmetrically to produce new melanocytes, or symmetrically to expand the MSC population. Evidence for distal asymmetric stem cell divisions is provided by our PTU differentiation assay, which shows that distal melanocytes are typically the most recently differentiated. These divisions produce both MSCs, for self-renewal, and transient amplifying cells, or melanoblasts, that account for most of the differentiated melanocytes of the fin. That new melanocytes also develop at proximal or intermediate positions in this experiment tends to suggest that the MSC at the growth front also divide symmetrically at some frequency, leaving MSCs behind in their wake. Unlike the MSCs at the growth front, which are probably continuously cycling, the MSCs that are left behind are likely quiescent. Further evidence comes from our finding that upon amputation of fTyrp>GFP-labeled ontogenetic clones, the melanocytes that arise from quiescent MSCs in the stump are also labeled.
To address the roles of individual MSCs or transient amplifying cells in the growing pigment pattern, we used X-ray induced LOH at the albino locus for clone generation. Progeny of irradiated albino/+ cells (MSCs or melanoblasts), which have lost their wild-type allele, develop without pigment, but retain expression of the melanocyte-specific vital marker fTyrP>GFP. These experiments showed that there were two discrete classes of cells in the growing fin that could be irradiated to generate labeled clones. One class, which we conclude results from labeling of melanoblasts, generates a few (one to five) albino melanocytes, resides entirely within the interior of the pigment pattern, fails to extend to the distal growing edge of the fin, and leaves no labeled MSC that can be reactivated by amputation and regeneration. The small size of these clones suggests that melanoblasts can divide between one and three times before terminally differentiating. This limited potential for division also explains why this class of cells fails to reach the growing edge of the fin at later stages.
Those results contrast with five larger clones, ranging from six to 47 albino melanocytes. Similar to the previous class, the proximal positions of these clones are in the interior of the fin (suggesting the length of the fin at the time of irradiation), and extend to the distal end of the fin ray. This suggests that the cell division potential of the labeled cell is not limited, as it can continue to generate labeled cells in the growth zone as the fin continues to grow, suggesting that this class of clones identifies labeled MSCs.
We used fin amputation and regeneration to further test whether this second class of distal-extending clone resulted from MSC labeling. This experiment resulted in new albino melanocytes in the regenerate. This result has two consequences for our interpretations. First, it confirms that the distal-extending clones result from MSC labeling, and second, it provides direct evidence that the leading edge MSC in fact does divide symmetrically to leave quiescent MSCs in the interior of the fin and pigment pattern.
Acknowledgments
We thank Erik Sanders, Donald Willis and Joanna Jacobs for fish husbandry, and Jim Skeath, Swathi Arur, Craig Micchelli, Jim Lister, Rob Tryon and Tom O'Reilly-Pol for critical comments on the manuscript. This work was funded by NIH RO1-GM56988. Deposited in PMC for release after 12 months.
Competing interests statement
The authors declare no competing financial interests.
References
- Booker R., Truman J. W. (1987). Postembryonic neurogenesis in the CNS of the tobacco hornworm, Manduca sexta. I. Neuroblast arrays and the fate of their progeny during metamorphosis. J. Comp. Neurol. 255, 548-559 [DOI] [PubMed] [Google Scholar]
- Budi E. H., Patterson L. B., Parichy D. M. (2008). Embryonic requirements for ErbB signaling in neural crest development and adult pigment pattern formation. Development 135, 2603-2614 [DOI] [PMC free article] [PubMed] [Google Scholar]
- Curran K., Lister J. A., Kunkel G. R., Prendergast A., Parichy D. M., Raible D. W. (2010). Interplay between Foxd3 and Mitf regulates cell fate plasticity in the zebrafish neural crest. Dev. Biol. 344, 107-118 [DOI] [PMC free article] [PubMed] [Google Scholar]
- Goodrich H. B., Nichols R. (1931). The development and the regeneration of the color pattern in brachydanio rerio. J. Morphol. Physiol. 52, 513-523 [Google Scholar]
- Hadzhiev Y., Lele Z., Schindler S., Wilson S. W., Ahlberg P., Strahle U., Muller F. (2007). Hedgehog signaling patterns the outgrowth of unpaired skeletal appendages in zebrafish. BMC Dev. Biol. 7, 75 [DOI] [PMC free article] [PubMed] [Google Scholar]
- Hirata M., Nakamura K., Kanemaru T., Shibata Y., Kondo S. (2003). Pigment cell organization in the hypodermis of zebrafish. Dev. Dyn. 227, 497-503 [DOI] [PubMed] [Google Scholar]
- Hirata M., Nakamura K., Kondo S. (2005). Pigment cell distributions in different tissues of the zebrafish, with special reference to the striped pigment pattern. Dev. Dyn. 234, 293-300 [DOI] [PubMed] [Google Scholar]
- Hultman K. A., Johnson S. L. (2010). Differential contribution of direct-developing and stem cell-derived melanocytes to the zebrafish larval pigment pattern. Dev. Biol. 337, 425-431 [DOI] [PMC free article] [PubMed] [Google Scholar]
- Hultman K. A., Budi E. H., Teasley D. C., Gottlieb A. Y., Parichy D. M., Johnson S. L. (2009). Defects in ErbB-dependent establishment of adult melanocyte stem cells reveal independent origins for embryonic and regeneration melanocytes. PLoS Genet. 5, e1000544 [DOI] [PMC free article] [PubMed] [Google Scholar]
- Johnson A. D., Krieg P. A. (1995). A Xenopus laevis gene encoding EF-1 alpha S, the somatic form of elongation factor 1 alpha: sequence, structure, and identification of regulatory elements required for embryonic transcription. Dev. Genet. 17, 280-290 [DOI] [PubMed] [Google Scholar]
- Johnson S. L., Bennett P. (1999). Growth control in the ontogenetic and regenerating zebrafish fin. Methods Cell Biol. 59, 301-311 [DOI] [PubMed] [Google Scholar]
- Johnson S. L., Africa D., Walker C., Weston J. A. (1995). Genetic control of adult pigment stripe development in zebrafish. Dev. Biol. 167, 27-33 [DOI] [PubMed] [Google Scholar]
- Kawakami K. (2004). Transgenesis and gene trap methods in zebrafish by using the Tol2 transposable element. Methods Cell Biol. 77, 201-222 [DOI] [PubMed] [Google Scholar]
- Keller R. E. (1975). Vital dye mapping of the gastrula and neurula of Xenopus laevis. I. Prospective areas and morphogenetic movements of the superficial layer. Dev. Biol. 42, 222-241 [DOI] [PubMed] [Google Scholar]
- Kimmel C. B., Warga R. M., Schilling T. F. (1990). Origin and organization of the zebrafish fate map. Development 108, 581-594 [DOI] [PubMed] [Google Scholar]
- Logan C. Y., McClay D. R. (1997). The allocation of early blastomeres to the ectoderm and endoderm is variable in the sea urchin embryo. Development 124, 2213-2223 [DOI] [PubMed] [Google Scholar]
- Mellgren E. M., Johnson S. L. (2005). kitb, a second zebrafish ortholog of mouse Kit. Dev. Genes Evol. 215, 470-477 [DOI] [PubMed] [Google Scholar]
- O'Reilly-Pol T., Johnson S. L. (2008). Neocuproine ablates melanocytes in adult zebrafish. Zebrafish 5, 257-264 [DOI] [PMC free article] [PubMed] [Google Scholar]
- O'Reilly-Pol T., Johnson S. L. (2009). Melanocyte regeneration reveals mechanisms of adult stem cell regulation. Semin. Cell Dev. Biol. 20, 117-124 [DOI] [PMC free article] [PubMed] [Google Scholar]
- Parichy D. M., Rawls J. F., Pratt S. J., Whitfield T. T., Johnson S. L. (1999). Zebrafish sparse corresponds to an orthologue of c-kit and is required for the morphogenesis of a subpopulation of melanocytes, but is not essential for hematopoiesis or primordial germ cell development. Development 126, 3425-3436 [DOI] [PubMed] [Google Scholar]
- Parichy D. M., Elizondo M. R., Mills M. G., Gordon T. N., Engeszer R. E. (2009). Normal table of postembryonic zebrafish development: staging by externally visible anatomy of the living fish. Dev. Dyn. 238, 2975-3015 [DOI] [PMC free article] [PubMed] [Google Scholar]
- Raible D. W., Eisen J. S. (1994). Restriction of neural crest cell fate in the trunk of the embryonic zebrafish. Development 120, 495-503 [DOI] [PubMed] [Google Scholar]
- Rawls J. F., Johnson S. L. (2000). Zebrafish kit mutation reveals primary and secondary regulation of melanocyte development during fin stripe regeneration. Development 127, 3715-3724 [DOI] [PubMed] [Google Scholar]
- Rawls J. F., Johnson S. L. (2001). Requirements for the kit receptor tyrosine kinase during regeneration of zebrafish fin melanocytes. Development 128, 1943-1949 [DOI] [PubMed] [Google Scholar]
- Sheets L., Ransom D. G., Mellgren E. M., Johnson S. L., Schnapp B. J. (2007). Zebrafish melanophilin facilitates melanosome dispersion by regulating dynein. Curr. Biol. 17, 1721-1734 [DOI] [PMC free article] [PubMed] [Google Scholar]
- Streisinger G., Coale F., Taggart C., Walker C., Grunwald D. J. (1989). Clonal origins of cells in the pigmented retina of the zebrafish eye. Dev. Biol. 131, 60-69 [DOI] [PubMed] [Google Scholar]
- Wilkie A. L., Jordan S. A., Jackson I. J. (2002). Neural crest progenitors of the melanocyte lineage: coat colour patterns revisited. Development 129, 3349-3357 [DOI] [PubMed] [Google Scholar]
- Zackson S. L. (1984). Cell lineage, cell-cell interaction, and segment formation in the ectoderm of a glossiphoniid leech embryo. Dev. Biol. 104, 143-160 [DOI] [PubMed] [Google Scholar]
- Zou J., Beermann F., Wang J., Kawakami K., Wei X. (2006). The Fugu tyrp1 promoter directs specific GFP expression in zebrafish: tools to study the RPE and the neural crest-derived melanophores. Pigment Cell Res. 19, 615-627 [DOI] [PMC free article] [PubMed] [Google Scholar]


