

Abstract
Studies of macroH2A histone variants indicate that they have a role in regulating gene expression. To identify direct targets of the macroH2A1 variants, we produced a genome-wide map of the distribution of macroH2A1 nucleosomes in mouse liver chromatin using high-throughput DNA sequencing. Although macroH2A1 nucleosomes are widely distributed across the genome, their local concentration varies over a range of 100-fold or more. The transcribed regions of most active genes are depleted of macroH2A1, often in sharply localized domains that show depletion of 4-fold or more relative to bulk mouse liver chromatin. We used macroH2A1 enrichment to help identify genes that appear to be directly regulated by macroH2A1 in mouse liver. These genes functionally cluster in the area of lipid metabolism. All but one of these genes has increased expression in macroH2A1 knockout mice, indicating that macroH2A1 functions primarily as a repressor in adult liver. This repressor activity is further supported by the substantial and relatively uniform macroH2A1 enrichment along the inactive X chromosome, which averages 4-fold. Genes that escape X inactivation stand out as domains of macroH2A1 depletion. The rarity of such genes indicates that few genes escape X inactivation in mouse liver, in contrast to what has been observed in human cells.
Nucleosomes, as basic structural units of chromatin, are important targets for modifying chromatin structure and function. One source of nucleosomal functional diversity is the substitution of histone variants for conventional histones. The macroH2A core histone variants appear to be present in most or all vertebrates and some deuterostome invertebrates, such as sea urchins. Three macroH2A variants have been identified in mammals. The macroH2A1 variants, macroH2A1.1 and macroH2A1.2, are produced by alternate splicing, and macroH2A2 is produced by a separate gene (8, 13, 31, 34). They all have a full-length histone H2A domain on their N terminus and a C-terminal nonhistone region that primarily consists of a conserved domain called a macrodomain. Macrodomains are found as stand-alone proteins in bacteria and are embedded in other eukaryotic proteins and in proteins involved in the replication of some RNA viruses (2, 32). Some macrodomains bind ADP-ribose and related molecules (26), and a recent study indicates that ADP-ribose binding by macroH2A1.1 can alter chromatin structure (36).
We estimated that there is approximately 1 macroH2A for every 30 nucleosomes in rat liver, an organ with relatively high macroH2A1 content and very little macroH2A2 (13, 31). Fluorescence studies showed that these nucleosomes are not uniformly distributed across the chromatin. Notably, macroH2A1 is preferentially localized to the inactive X chromosome (8, 13, 14), to centromeric chromatin in some cell types (15, 22), and to transcriptionally silent senescence-associated heterochromatic foci (39), which suggests a role in repression of gene expression. macroH2A1 knockout mice are viable and fertile and show no obvious pathology (11). No defects in X inactivation were detected, consistent with studies that indicate that X inactivation is maintained by multiple mechanisms of repression (16). However, studies of gene expression in the livers of macroH2A1 knockout mice found increased expression of genes that cluster in the area of lipid metabolism, consistent with the idea that macroH2A1 nucleosomes have a role in repressing the expression of specific genes (11).
In order to identify the direct targets of macroH2A, it is important to determine the distribution of macroH2A nucleosomes across individual genes and other genomic elements. Toward this goal, we developed a thio-affinity method that is highly specific for the purification of macroH2A1 nucleosomes from mouse liver (12). Our previous real-time PCR studies using DNA from purified macroH2A1 nucleosomes supported the conclusion that macroH2A1 is enriched on the inactive X chromosome and suggested that many active genes are depleted of macroH2A1. However, this approach was restricted to probing a small number of sites. MacroH2A immunoprecipitation studies by other groups indicated macroH2A1 enrichment in the upstream regions of HSP70.1 and HSP70.2 (30) and the promoter region of interleukin-8 (IL-8) (1). Two recent studies used chromatin immunoprecipitation and microarrays to probe the macroH2A1 content of selected regions of the genome. One study found weak but uniform enrichment of macroH2A1 across the inactive X chromosome (29). The other study examined the ENCODE regions and 10-kb regions around ∼20,000 transcription start sites in cultured fibroblasts and a breast cancer cell line (21). This study, by Gamble et al., found that regions of macroH2A1 enrichment have a positive correlation to regions enriched for the repressive chromatin mark H3K27 trimethylation and that macroH2A1 tends to be depleted in the 3-kb region immediately downstream of the transcriptional start site of active genes. They examined the effect of a macroH2A1 knockdown on the expression of 97 genes and found that 19% had significantly altered expression. Surprisingly, 72% of these macroH2A1-regulated genes had decreased expression in knockdown cells, indicating that macroH2A1 nucleosomes often function to increase gene expression.
Here, we use high-throughput sequencing of macroH2A1 mononucleosomal DNA isolated from female mouse liver to produce the first genome-wide map of macroH2A distribution. We use this map to examine the macroH2A1 content of the transcribed regions of mapped genes, compare the macroH2A1 contents of active and inactive genes, identify genes that appear to be directly regulated by macroH2A1 nucleosomes in mouse liver, and perform a chromosome-wide assessment of genes that escape from X inactivation.
MATERIALS AND METHODS
Purification of macroH2A1 nucleosomes.
Female mouse livers were from Pel-Freez Biologicals. The preparation of solubilized chromatin and purification of macroH2A1 nucleosomes was as described previously (12). Briefly, mono- and oligonucleosomes were prepared by micrococcal nuclease digestion with solubilization facilitated by removing H1 with CM Sepharose. MacroH2A1 nucleosomes were purified by differential thio-affinity chromatography using activated thiol Sepharose (GE Healthcare), which does not bind macroH2A1, followed by thiopropyl Sepharose (GE Healthcare), which binds macroH2A1 nucleosomes. The specificity of this approach was demonstrated by the absence of purified nucleosomes when livers from macroH2A1 knockout mice were used (Fig. 1).
FIG. 1.
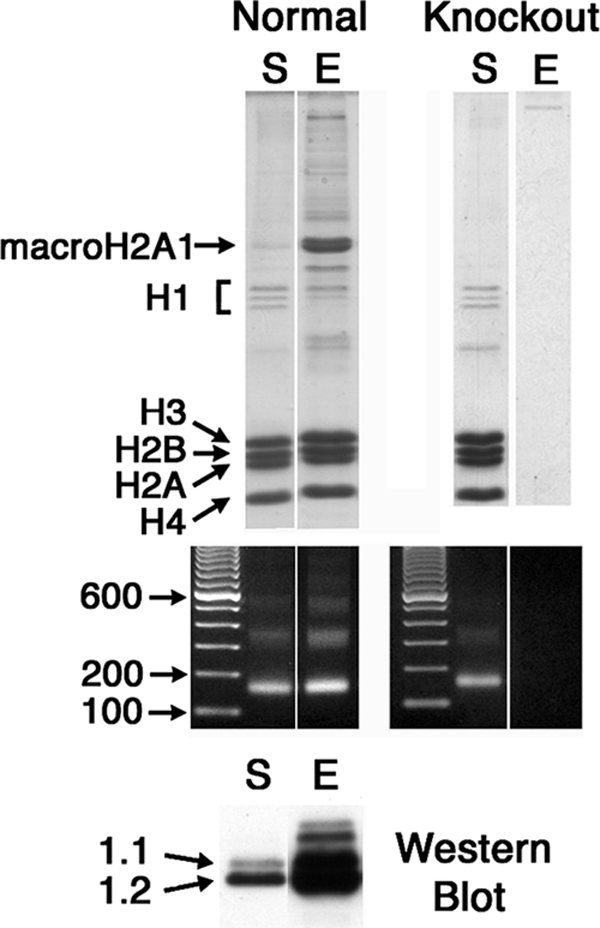
Purification of macroH2A1 nucleosomes. MacroH2A1 nucleosomes were purified by thio-affinity chromatography (see Materials and Methods and reference 12). S, starting-material chromatin; E, eluted fraction of purified macroH2A1 nucleosomes. The protein composition of the fractions is shown on SDS gels (top); DNA gels show mono- and oligonucleosomal DNA, except in the eluted fraction prepared with livers from macroH2A1 knockout mice (middle). A Western blot using macroH2A1.2 antibody shows macroH2A1 enrichment in the eluted fraction of normal liver (bottom). Fractions were prepared from normal female mouse livers or livers from macroH2A1 knockout mice.
High-throughput sequencing, mapping of sequences, and analysis of map.
Nucleosomal DNA was purified using standard procedures. Mononucleosomal DNA from macroH2A1 nucleosomes and from the bulk mouse liver chromatin (starting material) was purified by gel electrophoresis and sequenced using the Solexa genome analyzer following manufacturer protocols. Sequence tags were mapped to the mouse genome (NCBI build 36) using the Solexa analysis pipeline. The tags were also mapped in 200-bp windows (4). Sequences that map to multiple locations were masked from the maps. This leaves gaps or sparse sequence representation in regions that are rich in repetitive sequences. However, most regions have unique sequences that provide information about macroH2A1 distribution. We obtained 12,468,289 unique mapping tags from macroH2A1 mononucleosomes and 12,460,356 from starting-material mononucleosomes.
We analyzed the macroH2A1 content (relative to bulk mouse liver chromatin) of all mapped mouse genes using Partek Genomics Suite software (version 6.5b, release 6.09.0806); the gene list was based on the NCBI February 2006 build of the mouse genome (NCBI36/mm8). For each gene region (including 5′ and 3′ untranslated regions and all introns and exons), the total number of matching sequences was counted from the starting material and macroH2A1 samples. The macroH2A1 content of a gene was calculated by dividing the normalized RPKM (reads per kilobase per million reads) value from the macroH2A1 map by the RPKM value from the map of starting-material nucleosomes. False-discovery-rate-adjusted P values for macroH2A1 enrichment or depletion were calculated for each gene. The University of California Santa Cruz (UCSC) genome browser (27) was used to examine the distribution of sequence tags on specific genomic regions. The housekeeping genes we analyzed came from the study by Hsiao et al. (25). Their list of human housekeeping genes was used to search for the mouse homologues. If a unique mouse homologue could not be identified by the gene symbol or the Affymetrix probe, the entry was left out of the analysis. A similar approach was used for the list of “physiologically biased” nervous system genes from Dorus et al. (20).
Analysis of gene expression and escape from X inactivation.
Total RNA was isolated from 13 normal and 13 macroH2A1 knockout mouse livers using Trizol (Invitrogen). All mice were 2-month-old females in the C57BL/6 background (inbred for 10 generations) that were killed in the midmorning to minimize circadian effects; the mice were maintained on the 2018S Teklad Global 18% protein rodent diet, which contains 5% fat. The preparation of cDNA and the real-time PCR analysis of gene expression were done as previously described (11). Primer sequences are given in Table S5 in the supplemental material. Excel was used for statistical analyses. The University of Pennsylvania Institutional Animal Care and Use Committee approved all animal protocols.
Escape from X inactivation was analyzed in the Patski cell line, which was derived from (C57BL/6J HPRT−/− × Mus spretus)F1 female mice. The cells were drug selected such that the C57BL/6J X chromosome is inactivated in essentially all cells (28, 38). Single nucleotide polymorphisms between C57BL/6J and M. spretus were used to distinguish expression from each X chromosome (38). A cDNA fragment that contained the target polymorphism for a given gene was amplified by reverse transcription-PCR (RT-PCR) and sequenced (primer sequences are given in Table S5 in the supplemental material). Control DNA from the Patski cell line was amplified to confirm the polymorphisms. Genes that escape X inactivation show expression of both the C57BL/6J and Mus spretus alleles, while genes that are subject to X inactivation show no expression from the C57BL/6J allele (38).
Microarray data accession number.
We deposited the short reads, summary BED files, summary GRAPH files, and the Partek gene analysis data set in the Gene Expression Omnibus (GEO) database (accession number GSE18963).
RESULTS
Producing the sequence tag maps.
macroH2A1 nucleosomes were purified from female mouse liver chromatin by thio-affinity chromatography (12). The protein and DNA compositions of the starting-material and purified macroH2A1 nucleosomes are shown in Fig. 1. The specificity of this approach was demonstrated by the absence of purified nucleosomes when livers from macroH2A1 knockout mice were used (Fig. 1). Equal amounts of macroH2A1 nucleosomal DNA from two independent purifications were pooled, and mononucleosomal DNA was purified by gel electrophoresis. Mononucleosomal DNA was also purified from the starting material of both preparations. These fragments were sequenced using the Solexa genome analyzer and mapped across the mouse genome (NCBI build 36) (4). The macroH2A1 content of mapped genes (relative to the starting-material chromatin) was calculated using Partek Genomics Suite software (see Materials and Methods). The total numbers of mapped sequence tags in the two maps differ by less than 0.1%. Sequences that map to multiple locations were masked from the map, which can leave gaps in both the starting-material and macroH2A1 maps in regions that are rich in repetitive sequences.
Validation of the macroH2A1 map.
To examine the validity of the macroH2A1 sequence tag map, we compared it to results obtained by real-time PCR. To test the map's ability to detect local variations in macroH2A1 content, we examined two genes that escape X inactivation, Kdm5c and Eif2s3x (19). The sequence tag and real-time PCR maps both show marked macroH2A1 depletion over the transcribed regions of these genes and macroH2A1 enrichment in the near upstream and downstream regions (Fig. 2). We also compared our sequence tag map to previous PCR data for active and inactive genes (12) and for genes that show altered expression in macroH2A1 knockout mice (11). In all cases, we observed good correspondence between the sequence tag map and the PCR results; for example, Fig. 2 shows strong macroH2A1 enrichment on the sequence tag map and by PCR for Krt1-23, a gene that has increased expression in livers from macroH2A1 knockout mice (11). Our real-time PCR studies were done with four independent purifications of macroH2A1 nucleosomes, two from male mouse liver and two from female mouse liver. Each of these preparations used more than eight livers, and real-time PCR analyses of these preparations were very similar to one another at all sites probed except those on the X chromosome, which differed between males and females due to the inactive X chromosome (11, 12). Based on the similarity of our sequence tag map to our numerous real-time PCR data from four different preparations of liver macroH2A1 nucleosomes, we conclude that the sequence tag map accurately reflects the distribution of macroH2A1 nucleosomes over most regions of the genome.
FIG. 2.

Comparison of the macroH2A1 sequence tag map to real-time PCR data. Quantitative real-time PCR was used to assess the accuracy and resolution of the sequence tag map. Maps for Kdm5c, Eif2s3x, and Krt1-23 are shown. Sequence tag maps for starting-material and macroH2A1 mononucleosomal DNAs are shown at the top, and real-time PCR results are directly below; real-time PCR results show macroH2A1 content relative to starting-material chromatin. The sequence tag data were uploaded in the UCSC browser (27) (NCBI 36/mm8).
MacroH2A1 is depleted from most active genes.
Our previous real-time PCR studies of macroH2A1 nucleosomal DNA suggested that macroH2A1 might be depleted from many active genes (11). To examine this question more broadly, we examined the distribution of macroH2A1 on a large group of housekeeping genes. We chose housekeeping genes because they should be active in all liver cells and therefore give the cleanest result. For this analysis, we used a list of 451 human housekeeping genes that showed expression in all 19 tissue types examined (25). We excluded genes that are X linked because of the inactive X. We also excluded two small genes that had no tags in the starting-material map and genes that did not have a clear single homologue in the mouse or were duplicate entries (see Table S1 in the supplemental material). For the remaining genes, we used Partek Genomic Suite software to calculate their macroH2A1 content relative to the starting-material chromatin. A scatter plot of the results is shown in Fig. 3A, with the genes arranged along the x axis according to the number of tags in the starting-material map. While there is increased scatter for genes with fewer tags, the results clearly show that the majority of housekeeping genes are depleted of macroH2A1, and for most the depletion was more than 4-fold relative to the starting-material chromatin. Statistically significant depletion (step-up P value of <0.05) occurred on 75% of the genes, while only 4% of the genes showed statistically significant enrichment. We also examined 20 nonhousekeeping genes that we expect to be expressed in most hepatocytes. These included genes for blood proteins, such as coagulation factors and serum albumin, and metabolic enzymes involved in glycogen metabolism and the urea cycle. Similar to the housekeeping genes, most of these genes showed a >2-fold depletion of macroH2A1, and only one showed enrichment (see Table S2 in the supplemental material).
FIG. 3.

Relative macroH2A1 content of transcriptionally active and inactive genes. (A) Scatter plots of the macroH2A1 content of selected genes; the macroH2A1 content of each gene relative to starting-material chromatin was calculated using Partek Genomics Suite software. Genes are ordered from left to right by increasing tags in the starting material. X-linked genes and genes with no tags in the starting-material map were excluded. The housekeeping genes are from Hsiao et al. (25) (see Table S1 in the supplemental material) and should be active in most or all liver cells. The brain genes are a physiologically biased subgroup of nervous system genes (20) that consists primarily of genes that should be inactive in liver (see Table S3 in the supplemental material); genes from this list that showed evidence of liver expression in the NCBI UniGene EST database were excluded from the plot. (B) Localized zones of depletion of macroH2A1 over active genes. Two housekeeping genes, Ncor2 and Itpk1, are shown to illustrate the zone of macroH2A1 depletion often seen over the transcribed regions of active genes. Sequence tag maps for starting-material and macroH2A1 mononucleosomal DNAs are shown. Data were uploaded in the UCSC browser (27) (NCBI 36/mm8).
Interestingly, the macroH2A1 depletion associated with active genes often occurs as a relatively uniform domain that is localized to the transcribed region of the gene, extending only a short distance into upstream and downstream regions. Examples of these zones of depletion are shown in Fig. 3B for two genes from the housekeeping list: Ncor2 and Itpk1. This localized pattern of depletion indicates that the mechanism of macroH2A1 depletion over active genes is tied to transcription.
For comparison to the macroH2A1 depletion seen on active genes, we examined the macroH2A1 content of a group of genes that we expect to be inactive in liver. For this purpose, we used a group of 96 physiologically biased nervous system genes (20) that primarily encode proteins directly involved in neuronal or glial cell physiology, such as receptors for neurotransmitters (see Table S3 in the supplemental material). We excluded genes that are X linked, did not have a clear mouse homologue, or showed evidence of liver expression in the NCBI UniGene expressed sequence tag (EST) database. The relative macroH2A1 content of these inactive genes was not strongly biased toward either depletion or enrichment, with none of them showing depletion of 4-fold or more, a level commonly seen in active genes, or enrichment of more than 4-fold (Fig. 3A). We conclude that strong macroH2A1 depletion is a common feature of active genes and that inactive genes as a group do not show a strong bias toward macroH2A1 depletion or enrichment.
Identification of macroH2A1 target genes.
macroH2A1 is enriched on the transcribed regions of 5 of the 6 genes we previously verified as having increased expression in livers from macroH2A1 knockout mice. Two of these genes, Krt1-23 and Scd2, have strong enrichment across their transcribed region (see Fig. 2 for Krt1-23 and Fig. 4 for Scd2), while Atp11a and Cd36 have regional enrichment of macroH2A1 over a sizable section of their transcribed regions (not shown). Serpina7 is X linked, but our PCR studies of male mouse liver showed that it is enriched for macroH2A1 on the active X (11). Of our PCR-confirmed targets of macroH2A1 repression, only Lpl appears to be depleted of macroH2A1, although it shows very strong enrichment in its upstream region (not shown). The enrichment of macroH2A1 on most of our confirmed macroH2A1 targets together with the strong macroH2A1 depletion that occurs on most active genes suggested that we could use macroH2A1 enrichment to help identify new macroH2A1 target genes.
FIG. 4.

Patterns of macroH2A1 enrichment over macroH2A1 target genes. Some targets of macroH2A1-mediated repression show enrichment across the whole gene, as in the case of Scd2 (upper left), while other target genes show macroH2A1 enrichment that is localized to only a part of the gene, as can be seen for Abcc4, Acot1, and Vldlr. Compare these patterns with the uniform macroH2A1 depletion seen over many active genes, such as those shown in Fig. 3B. Sequence tag maps for starting-material and macroH2A1 mononucleosomal DNAs are shown. Data were uploaded in the UCSC browser (27) (NCBI 36/mm8).
To identify new targets of macroH2A-mediated repression, we examined the relative macroH2A1 content of the 61 genes that showed at least a 1.5-fold increase in expression in our previous microarray analysis of livers from macroH2A1 knockout mice (11). We looked for genes that had significant enrichment for macroH2A1 over their transcribed regions and consistent expression between replicates in the microarray. Using these criteria, we selected five genes for real-time PCR analysis, and four of these—Vldlr, Abcc4, Acot1, and Spsb4—showed a significant increase in expression (P < 0.05) in a large independent group of liver samples (13 normal and 13 knockout) (Table 1). Interestingly, the distribution of macroH2A1 over three of these genes is uneven. Abcc4 shows localized enrichment of macroH2A1 over its 5′ transcribed region, while Acot1 and Vldlr have a domain of enrichment in the middle of the gene (Fig. 4). Spsb4 appears to have a more uniform distribution of macroH2A1 across its transcribed region (not shown). These results indicate that macroH2A1 nucleosomes can repress expression even when they are localized to only a part of the gene.
TABLE 1.
Changes in gene expression in livers from macroH2A1 knockout mice
| MacroH2A1 enrichment/depletion region and gene | Ratio of expression (P value) determined by: |
Ratio (P value) of macroH2A contentc | |
|---|---|---|---|
| Microarraya | PCRb | ||
| Enriched on its transcribed region | |||
| Vldlr | 2.1 | 1.6 (<0.007) | 1.4d (<0.4 × 10⁻⁵) |
| Abcc4 | 2 | 1.3 (<0.003) | 1.2d (1.1 × 10⁻⁵) |
| Abcc4 | 1.8e (<0.001) | ||
| Acot1 | 1.6 | 1.4 (<0.03) | 2.4d (<0.3 × 10⁻⁶) |
| BC020535 | 1.6 | 1 | 2.1 (6 × 10⁻⁹) |
| Spsb4 | 1.5 | 1.65 (<0.0001) | 1.4 (<0.2 × 10⁻⁸) |
| Acot2 | 1.1 | 1.2 (<0.02) | 1.3 (0.5) |
| Tmem98 | 0.6 | 0.7 (<0.0006) | 1.6 (<0.0.002) |
| Depleted on its transcribed region, enriched upstream | |||
| Tcp11l2 | 2 | 0.9 | 0.19 (1.3 × 10⁻³⁴) |
| 8430408G22Rik | 1.6 | 0.8 | 0.12 (<0.0.02) |
| Mysm1 | 1.6 | 0.85 | 0.18 (<0.2 × 10⁻²²) |
| Klhl24 | 1.6 | 1 | 0.15 (<0.10−21) |
| Lpin1 | 1.5 | 0.9 | 0.22 (<0.10−36) |
Results are from Changolkar et al. (11).
Ratio of expression in livers from female macroH2A1 knockout mice relative to the expression in the control liver (13 knockout and 13 normal mice examined). P value are from 1-tailed t tests.
MacroH2A1 content relative to that of the starting-material chromatin and the P values for enrichment or depletions were calculated using Partek Genomics Suite software (see Materials and Methods).
The sequence tag map showed evidence of regional macroH2A1 enrichment (see Fig. 4).
Result from the 5′ end of the Abcc4 reference cDNA. All other PCRs targeted the 3′ end.
MacroH2A1 enrichment in a gene's upstream region could affect its expression by altering the chromatin structure of its regulatory regions. To investigate this possibility, we examined five genes that showed increased expression in our previous microarray analysis of knockout mice and macroH2A1 enrichment in their upstream regions but were depleted of macroH2A1 on their transcribed regions. None of these genes showed increased expression in our real-time PCR analysis of liver cDNA from knockout mice (Table 1). While this does not rule out the possibility that upstream macroH2A1 could have a regulatory role for some genes, it indicates that macroH2A1 enrichment that is confined to the upstream region is not a strong marker of macroH2A1-mediated gene regulation.
To examine the possibility that MacroH2A1 nucleosomes increase the expression of some genes, we examined the macroH2A1 content of the 50 genes that showed at least a 1.5-fold decrease in expression in our previous microarray analysis of livers from macroH2A1 knockout mice. Of these, we previously confirmed decreased expression of Ar, Sucnr1, and Gtpbp4 by real-time PCR (11). Our map shows a neutral macroH2A1 content for Sucnr1 and depletion for Gtpbp4 (not shown), suggesting that these genes are indirectly affected by the absence of macroH2A1. Excluding Ar and other X-linked genes, we found statistically significant enrichment of macroH2A1 on only six of the genes on this list—Serpina4-ps1, Zap70, Dntt, Tmem98, Prom1, and Ntrk2. The expression of Serpina4-ps1 and Prom1 was highly variable between replicates in the microarray, indicating that they are likely false positives that would be difficult to validate for small changes in gene expression. Zap70 and Dntt encode proteins involved in T-cell-specific functions and are probably not expressed in the liver; both show very restricted expression patterns in the UniGene EST database and no liver ESTs. Tmem98 showed consistent expression between replicates in the microarray, and we confirmed a significant decrease in its expression by PCR (Table 1). We also attempted to examine Ntrk2 by real-time PCR, but its expression was very low and highly variable between replicate liver samples.
Table 2 shows a list of genes that appear to be direct targets of macroH2A1 based on a change in expression in the livers of macroH2A1 knockout mice confirmed by real-time PCR and the localization of macroH2A1. This list includes one additional gene, Acot2, a neighbor of Acot1 that showed macroH2A1 enrichment and was confirmed by PCR to have increased expression. The genes added by the current study expand our previous connection between macroH2A1 and fatty acid/lipid metabolism (Table 2) (11). Overall, we see increased expression of genes encoding proteins directly involved in the uptake of fatty acids by the liver—Lpl, Vldlr, and Cd36—and genes encoding proteins directly involved in the metabolism of fatty acids inside the cell—Scd2, Acot1, and Acot2. Both of the ATP-dependent membrane transporters—ATP11a (also known as Ih) and Abcc4 (also known as Mrp4)—encode proteins that have direct or inferred connections with the transport of lipids (3, 23, 37). We conclude that in adult liver, macroH2A1 has a role in regulating genes involved in lipid metabolism.
TABLE 2.
Functions of mouse liver macroH2A1 target genesa
| Function | Gene | Target |
|---|---|---|
| Fatty acid metabolism | Lpl | Lipoprotein lipase |
| Vldlr | Very low-density lipoprotein receptor | |
| Cd36 | Fatty acid transporter | |
| Scd2 | Fatty acid desaturase | |
| Acot1 | Acyl CoA thioesterase, cytosolic | |
| Acot2 | Acyl CoA thioesterase, mitochondrial | |
| Membrane transport | Abcc4 | Many targets, including bile acid metabolites |
| Atp11a | Unknown targets, possibly lipid-related molecules | |
| Other | Serpina7 | Blood transporter of thyroid hormones |
| Krt1-23 | Cytokeratin | |
| Spsb4 | Possible component of ubiquitin ligase complex | |
| Tmem98b | Possible transmembrane protein |
Includes genes identified by Changolkar et al. (11) and in the present study.
This gene showed decreased expression in the livers of macroH2A1 knockout mice.
MacroH2A1 enrichment on the inactive X chromosome.
Our immunofluorescence studies of female mouse liver and other tissues indicated that macroH2A1 is strongly enriched on the inactive X chromosome (13-15). However, a recent study using chromatin immunoprecipitation and microarrays reported that this enrichment is only about 1.5-fold relative to the active X or autosomes (29). Consistent with our immunofluorescence studies, our sequence tag maps show that macroH2A1 is substantially enriched across nearly the entire X chromosome (Fig. 5A). The normalized number of X-chromosome sequence tags from the macroH2A1 sample was approximately 2.5-fold greater than that from the starting material. In contrast, autosomes show an overall neutral distribution of macroH2A1, with regions of localized enrichment or depletion. The map for chromosome 6 is shown in Fig. 5A, and the maps for the other autosomes are shown in Fig. S1 in the supplemental material. Assuming a neutral distribution of macroH2A1 tags across the active X, the 2.5-fold enrichment we observed on the X chromosome indicates an overall enrichment of approximately 4-fold on the inactive X. We conclude that substantial macroH2A1 enrichment occurs across nearly the entire inactive X chromosome.
FIG. 5.

Distribution of macroH2A1 across the X chromosome and chromosome 6 in female mouse liver. (A) Sequence tag maps for the X chromosome and chromosome 6. The gaps in the X chromosome map correspond to regions that are masked due to repetitive sequences or sequences that appear as Ns in the database. The count levels in these large-scale maps were averaged, which evens out localized variations. Sequence tag maps for starting-material and macroH2A1 mononucleosomal DNAs are shown. Data were uploaded in the UCSC browser (27) (NCBI 36/mm8). (B) Scatter plots of the macroH2A1 content of all mapped genes on the X chromosome and chromosome 6; the macroH2A1 content relative to starting-material chromatin was calculated using Partek Genome Suite software. Genes are ordered from left to right by increasing tags in the starting material. Genes with no tags in the starting-material map are not included. Six small genes that showed >6-fold enrichment were omitted from the X chromosome plot in order to keep the scales of the two plots the same.
We also calculated the macroH2A1 content (relative to the starting chromatin) of all mapped genes on the X chromosome using the Partek Genomic Suite software. A scatter plot of these results is shown in Fig. 5B, with the genes arranged along the x axis according to the number of tags in their starting-material map. Although there is increased scatter for genes with fewer tags, nearly all X-linked genes are enriched for macroH2A1. The average enrichment is close to the 2.5-fold average observed over the entire X chromosome, which indicates an average enrichment of ∼4-fold for genes on the inactive X. MacroH2A1 enrichment of 4-fold or greater is very rare for genes on chromosome 6 (Fig. 5B) and was not seen on the inactive brain genes we examined (Fig. 3A). This supports previous studies indicating that macroH2A1 is specifically targeted to the inactive X by an Xist RNA-dependent mechanism (5, 17). Interestingly, the plot for chromosome 6 shows an obvious cluster of genes that are strongly depleted of macroH2A1 (Fig. 5B), which may represent a cluster of active genes similar to what we found in our analysis of housekeeping genes (Fig. 3A).
Genes that escape X inactivation.
Previous studies of cultured cell lines indicate that very few genes (3%) escape X inactivation in mouse cells (38), which contrasts with the 10 to 15% of X-linked genes that escape in human cells (7). Our results with two known escape genes, Kdm5c and Eif2s3x (Fig. 2), indicated that macroH2A1 depletion could provide a novel marker of escape that could be used to screen the entire X chromosome and to assess the prevalence of escape genes in adult mouse liver. Interestingly, only 18 X-linked genes showed macroH2A1 depletion in mouse liver after removing duplicate entries and small genes that had 3 or fewer tags in the starting-material map (Fig. 5B; see also Table S4 in the supplemental material). Six of these 18 genes correspond to genes that have been shown to escape in the Patski mouse cell line: Kdm5c, Eif2s3x, Xist, Kdm6a, Ddx3, and 2610029G23Rik (38). Among the remaining 12 genes showing macroH2A1 depletion, 5530601H04Rik, Jpx (also known as 2010000I03Rik), and Ftx (also known as B230206F22Rik) show highly significant depletion. 5530601H04Rik occurs in a domain of macroH2A1 depletion that includes 2610029G23Rik and Magee1 (Fig. 6A). To confirm escape from X inactivation, we used the Patski cell line, which is derived from (C57BL/6J × Mus spretus)F1 mice and has totally skewed inactivation of the C57BL/6J X chromosome (28). Numerous single nucleotide polymorphisms differentiate the mouse species and can thus be used to test for expression from the inactive C57BL/6J X chromosome. Our analysis showed that 5530601H04Rik and 2610029G23Rik have bi-allelic expression and thus escape X inactivation, while Magee1 is expressed only from the active X (Fig. 6B). We did not find single nucleotide polymorphisms to examine escape for Jpx and Ftx, but these genes, located next to Xist and the X inactivation center (Fig. 6A), both show discrete zones of macroH2A1 depletion, suggesting that they are strong candidates for escape from X inactivation.
FIG. 6.

Two regions of the X chromosome map showing evidence of escape from inactivation. (A) A region of macroH2A1 depletion containing 5530601H04Rik, 2610029G23Rik, and Magee1 is shown on the left. Another region of macroH2A1 depletion including Xist, Jpx, and Ftx located around the X inactivation center is shown on the right. Sequence tag maps for starting-material and macroH2A1 mononucleosomal DNAs are shown. Data were uploaded in the UCSC browser (27) (NCBI 36/mm8). (B) Single nucleotide polymorphism analysis of escape from X inactivation. Genomic DNA or RNA from the Patski cell line was amplified by PCR or RT-PCR using primers specific for 5530601H04Rik, 2610029G23Rik, and Magee1 (gels shown in left panels). The cDNA lane marked with a minus sign represents a control reaction without reverse transcriptase. Sequencing chromatograms from the PCR products are shown in the right panels. The polymorphic nucleotide is evidenced by overlapping peaks in the chromatograms from genomic DNA (gDNA; indicated by an arrow); in all three cases, the T polymorphic sequence is from the inactive C57BL/6J chromosome. Analysis of the chromatograms from cDNA shows evidence of bi-allelic expression for 5530601H04Rik and 2610029G23Rik but not for Magee1.
Seven of the 14 genes that have been shown to escape X inactivation in Patski cells show macroH2A1 depletion in mouse liver (Table 3), which indicates that these genes escape in both Patski cells and mouse liver. The 7 genes that escape in Patski cells but show macroH2A1 enrichment in liver may represent cell type-specific differences in X inactivation. This idea is supported by the study of Yang et al. (38), which showed that 4 of these 7 genes are enriched for H3K27me3 in female mouse liver (see Table 3), an indication that these genes do not escape inactivation in mouse liver. Taken together, these data indicate that macroH2A1 depletion is a strong marker for genes that escape X inactivation. The rarity of X-linked genes showing macroH2A1 depletion indicates that very few genes escape X inactivation in mouse liver.
TABLE 3.
MacroH2A1 and genes that escape X inactivation in mouse cells
| Type | Gene | Ratio of macroH2A1 content (liver)b | H3K27me3 status (liver)c |
|---|---|---|---|
| Genes that escape in Patski cellsa | Kdm5c | 0.17 | Depleted |
| Eif2s3x | 0.28 | Depleted | |
| 5530601H04Rik | 0.36 | Depleted | |
| Xist | 0.55 | Depleted | |
| 2610029G23Rik | 0.58 | Depleted | |
| Ddx3x | 0.64 | Depleted | |
| Kdm6a | 0.78 | Depleted | |
| 6720401G13Rik | 1.4 | Depleted | |
| Mid1 | 1.8 | Depleted | |
| BC022960 | 2.3 | Depleted | |
| Shroom4 | 2.4 | Enriched | |
| Car5b | 2.6 | Enriched | |
| 1810030O07Rik | 3.1 | Enriched | |
| Bgn | 3.5 | Enriched | |
| Unconfirmed candidates from the liver macroH2A1 map | Jpx | 0.14 | Depleted |
| Ftx | 0.3 | Depleted |
Genes come from Yang et al. (38), except 5530601H04Rik, which was identified in the present study; 2610029G23Rik was independently identified by Yang et al. (38) and in the present study.
MacroH2A1 content relative to that of the starting-material chromatin was calculated using Partek Genomics Suite software (see Materials and Methods).
H3K27me3 status in female mouse liver from Yang et al. (38).
DISCUSSION
In developing a model of how macroH2A histone variants function in the chromatin, it is important to determine how macroH2A nucleosomes are distributed across the genome. Here, we provide the first genome-wide map of macroH2A1 nucleosomes. One striking feature of this map is the depletion of macroH2A1 over most active genes, with depletion of 4-fold or more being common (Fig. 3A). Based on our estimate that bulk rat and mouse liver chromatin contain approximately one macroH2A1 per 30 nucleosomes (31, 33), 4-fold depletion indicates roughly one macroH2A1 per 24 kb. These domains of macroH2A1 depletion often closely correspond to the transcribed region of the gene (Fig. 3B). One explanation for this zone of localized depletion is that the histone exchange processes associated with transcription (18) of these genes do not efficiently insert macroH2A1 into chromatin. The low macroH2A1 content of most active genes could protect them from macroH2A1-mediated repression that can then be targeted to specific genes.
Unlike macroH2A1 depletion, domains of macroH2A1 enrichment do not closely correspond to the transcribed regions of genes. In some cases, enrichment occurs in large domains that encompass many genes, with the inactive X being an extreme example. In other cases, localized regions of enrichment may include only part of a gene, as in the case of Abcc4 (Fig. 4). The magnitude of enrichment within these domains is variable. The inactive X chromosome has an average enrichment of ∼4-fold or approximately one macroH2A1 nucleosome per 1,500 bp, which is consistent with the striking macroH2A1 immunofluorescence staining we observed for the inactive X in mouse liver (14). Two examples of autosomal domains of strong macroH2A1 enrichment involve Igf1r and a region containing the imprinted genes H19 and Igf2 (Fig. 7). MacroH2A1 enrichment reaches as high as 10-fold within these two domains. This level of enrichment is not common, with only 107 autosomal genes showing enrichment of 4-fold or greater. The mechanisms of establishing and maintaining these domains are not well understood. In the case of the inactive X, Xist RNA has a critical role in maintaining macroH2A1 enrichment (5, 17). Noncoding RNAs could have an important role in other domains of macroH2A1 enrichment, although there is no demonstrated example of this. Recent studies connecting macroH2A1.1 to poly(ADP-ribose) polymerase and poly(ADP-ribose) metabolism provide another potential mechanism for controlling macroH2A1.1 distribution and function (36).
FIG. 7.

Domains of strong macroH2A1 enrichment over the H19/Igf2 locus and Igf1r. MacroH2A1 enrichment within these domains reaches nearly 10-fold, a level not commonly seen across the genome (see the plot of the relative macroH2A1 content of the genes on chromosome 6 in Fig. 5B). Data were uploaded in the UCSC browser (27) (NCBI 36/mm8).
Interestingly, genes with macroH2A1 enrichment over their transcribed regions appear to be more likely targets of macroH2A1-mediated repression than genes in which macroH2A1 enrichment is confined to their upstream regions (Table 1). This suggests that macroH2A1 nucleosomes may repress expression by inhibiting transcriptional elongation or an RNA processing event such as splicing or release of the transcript. These types of mechanisms might not require the localization of macroH2A1 nucleosomes to specific sites on the gene. This seems consistent with our map, which indicates that macroH2A1 nucleosomes are typically organized in domains of enrichment rather than being targeted to specific DNA sequences. The magnitude of macroH2A1 enrichment we detect indicates that macroH2A1 nucleosomes are highly intermixed with nucleosomes that contain conventional H2As, even in regions of relatively high enrichment, such as the inactive X. Intermixing could also occur within the nucleosome, and in vitro studies indicate that macroH2A1 may preferentially pair with a conventional H2A (10).
Several aspects of our macroH2A1 map support our working model that macroH2A1 nucleosomes have a role in repressing gene expression. These include the marked enrichment of macroH2A1 on the inactive X chromosome, except for on genes that escape inactivation, the marked depletion of macroH2A1 from most active genes, and the enrichment of macroH2A1 on genes that show increased expression in livers from macroH2A1 knockout mice. MacroH2A1-mediated activation of gene expression appears to be substantially less frequent, being seen only for Tmem98 among the macroH2A1 target genes identified in our studies of adult mouse liver (Table 2). This result differs from a recent study by Gamble et al. (21) that found that decreased gene expression was much more common than increased expression when macroH2A1 was knocked down in the cultured breast cancer cell line MCF-7. They also found significant changes in 19% of the genes they probed, while our studies suggest that relatively few genes are directly regulated by macroH2A1 in mouse liver (present study and reference 11). In part, these differences may be related to the use of very different target cells. Transformation and cell proliferation could have effects on macroH2A expression and function (35), with adult liver having few dividing cells in contrast to the cancer cell line. Proliferation levels are much higher in fetal and neonatal tissues, and we found that macroH2A1.1 is nearly absent from fetal and neonatal liver and that the amount of macroH2A1.2 is reduced compared to that in adult liver (11, 33). Furthermore, genes regulated by macroH2A1 in adult liver were not affected by the absence of macroH2A1 in newborn liver (11). The relative macroH2A1 content of MCF-7 cells was not reported, but macroH2A1.1 was not expressed in these cells (21).
Our studies indicate that macroH2A1 has a role in regulating genes involved in fatty acid/lipid metabolism in adult liver. It is unclear whether macroH2A1 has a related role in other cell types. Studies of macroH2A1 in cultured cells have not detected a connection to lipid metabolism, which could in part reflect substantial differences in the metabolic and proliferative states of cultured cells in comparison to adult liver. In cultured breast cancer cells, macroH2A1-regulated genes clustered in the area of cell-cell signaling (21). In contrast, none of the genes we identified as macroH2A1 targets in mouse liver have a known direct connection to cell-cell signaling. Agelopoulos and Thanos found that a macroH2A1 knockdown caused dramatic derepression of IL-8 in Namalwa cells, a human B-cell line that does not normally express IL-8 (1). While IL-8 is not present in mouse, our analysis of gene expression in macroH2A1 knockout mouse liver did not find evidence for the derepression of genes that should not be active in liver. The mild phenotype of macroH2A1 knockout mice (11) suggests that the absence of macroH2A1 does not lead to the widespread derepression of tissue-specific genes. Knockdown of macroH2A expression in the NT2 embryonic carcinoma cell line and zebrafish embryos indicated that macroH2A1 and macroH2A2 are important regulators of key developmental genes and that macroH2A2 is essential for normal zebrafish development (6). We have not seen evidence of obvious developmental defects in macroH2A1 or macroH2A2 knockout mice (11; unpublished observations). However, we have observed metabolic effects in macroH2A1 knockout mice (11), with a decrease in glucose tolerance likely being related to an increased uptake of fatty acids by the liver brought about by increased expression of Lpl, CD36, and Vldlr (Table 2).
Although cultured cells have important advantages for studies of chromatin structure and function, we have focused our studies of macroH2A on mouse tissues in order to get an in vivo view of the distribution and functions of these histone variants. In our experience, the macroH2A content of adult liver is substantially higher than it is in most cultured cells, and the level of macroH2A1.1 in particular appears to be much higher in postmitotic cells (33, 35). In addition, postmitotic tissues, such as adult liver, avoid heterogeneity of gene expression and chromatin structure associated with different stages of the cell cycle. For instance, the localization of macroH2A1 to the inactive X changes significantly in the cell cycle (9). However, animal organs have multiple cell types that have different patterns of gene expression. Hepatocytes are the major cell type in liver, and they contain high levels of macroH2A1 and low levels of macroH2A2 (13). Bile duct epithelial cells also contain significant amounts of macroH2A1, while most other liver cells contain very little macroH2A1 (13). Although cell type heterogeneity undoubtedly affects our results, the prevalence of hepatocytes among macroH2A1-containing liver cells and the consistent depletion of macroH2A1 we see in hepatocyte-expressed genes (see Table S2 in the supplemental material) lead us to believe that our map primarily reflects the distribution of macroH2A1 in hepatocytes.
Although macroH2A1 enrichment is a useful marker for identifying genes that appear to be directly regulated by macroH2A1 nucleosomes, there also are many genes that have strong macroH2A1 enrichment that appear to be unaffected by the knockout of macroH2A1. These include Igf2, Igf1r (expression data not shown), and the genes of the inactive X chromosome (11). Many of these genes may be silent in normal hepatocytes and remain silent in the absence of macroH2A1 due to independent mechanisms of repression, such as DNA methylation, histone deacetylation, and H3K27 methylation. This view is supported by studies that revealed a role for macroH2A1 in maintaining X inactivation only when cells are treated with histone deacetylase inhibitors and inhibitors of DNA methylation (24). MacroH2A2 could have overlapping functions with macroH2A1, since both proteins are preferentially localized to the inactive X (8, 13) and may colocalize to other regions of chromatin. For some genes with macroH2A1 enrichment, the potential effects of macroH2A1 nucleosomes on expression may be neutralized by a local mechanism, such as posttranslational modification of macroH2A1. Such genes could be poised for macroH2A1 repression or activation in response to specific signals. It is also possible that some domains of macroH2A1 enrichment have functions not directly related to the regulation of gene expression.
Supplementary Material
Acknowledgments
We thank John Tobias and Iouri Chepelev for assistance with data analysis.
This work was supported by Public Health Service grants GM49351 (J.R.P.) and GM046883 (C.M.D.) from the National Institute of General Medical Sciences, by the Division of Intramural Research Program of the National Heart, Lung and Blood Institute, NIH (K.Z.), and by NRSA 1F32HD060402-01A1 (J.B.B.).
Footnotes
Published ahead of print on 11 October 2010.
Supplemental material for this article may be found at http://mcb.asm.org/.
REFERENCES
- 1.Agelopoulos, M., and D. Thanos. 2006. Epigenetic determination of a cell-specific gene expression program by ATF-2 and the histone variant macroH2A. EMBO J. 25:4843-4853. [DOI] [PMC free article] [PubMed] [Google Scholar]
- 2.Allen, M. D., A. M. Buckle, S. C. Cordell, J. Lowe, and M. Bycroft. 2003. The crystal structure of AF1521, a protein from Archaeoglobus fulgidus with homology to the non-histone domain of macroH2A. J. Mol. Biol. 330:503-511. [DOI] [PubMed] [Google Scholar]
- 3.Assem, M., E. G. Schuetz, M. Leggas, D. Sun, K. Yasuda, G. Reid, N. Zelcer, M. Adachi, S. Strom, R. M. Evans, D. D. Moore, P. Borst, and J. D. Schuetz. 2004. Interactions between hepatic Mrp4 and Sult2a as revealed by the constitutive androstane receptor and Mrp4 knockout mice. J. Biol. Chem. 279:22250-22257. [DOI] [PubMed] [Google Scholar]
- 4.Barski, A., S. Cuddapah, K. Cui, T. Y. Roh, D. E. Schones, Z. Wang, G. Wei, I. Chepelev, and K. Zhao. 2007. High-resolution profiling of histone methylations in the human genome. Cell 129:823-837. [DOI] [PubMed] [Google Scholar]
- 5.Beletskii, A., Y.-K. Hong, J. Pehrson, M. Egholm, and W. M. Strauss. 2001. PNA interference mapping demonstrates functional domains in the noncoding RNA Xist. Proc. Natl. Acad. Sci. U. S. A. 98:9215-9220. [DOI] [PMC free article] [PubMed] [Google Scholar]
- 6.Buschbeck, M., I. Uribesalgo, I. Wibowo, P. Rue, D. Martin, A. Gutierrez, L. Morey, R. Guigo, H. Lopez-Schier, and L. Di Croce. 2009. The histone variant macroH2A is an epigenetic regulator of key developmental genes. Nat. Struct. Mol. Biol. 16:1074-1079. [DOI] [PubMed] [Google Scholar]
- 7.Carrel, L., and H. F. Willard. 2005. X-inactivation profile reveals extensive variability in X-linked gene expression in females. Nature 434:400-404. [DOI] [PubMed] [Google Scholar]
- 8.Chadwick, B. P., and H. F. Willard. 2001. Histone H2A variants and the inactive X chromosome: identification of a second macroH2A variant. Hum. Mol. Genet. 10:1101-1113. [DOI] [PubMed] [Google Scholar]
- 9.Chadwick, B. P., and H. F. Willard. 2002. Cell cycle-dependent localization of macroH2A in chromatin of the inactive X chromosome. J. Cell Biol. 157:1113-1123. [DOI] [PMC free article] [PubMed] [Google Scholar]
- 10.Chakravarthy, S., and K. Luger. 2006. The histone variant macro-H2A preferentially forms “hybrid nucleosomes.” J. Biol. Chem. 281:25522-25531. [DOI] [PubMed] [Google Scholar]
- 11.Changolkar, L. N., C. Costanzi, N. A. Leu, D. Chen, K. J. McLaughlin, and J. R. Pehrson. 2007. Developmental changes in histone macroH2A1-mediated gene regulation. Mol. Cell Biol. 27:2758-2764. [DOI] [PMC free article] [PubMed] [Google Scholar]
- 12.Changolkar, L. N., and J. R. Pehrson. 2006. macroH2A1 histone variants are depleted on active genes but concentrated on the inactive X. Mol. Cell Biol. 26:4410-4420. [DOI] [PMC free article] [PubMed] [Google Scholar]
- 13.Costanzi, C., and J. R. Pehrson. 2001. MACROH2A2, a new member of the MACROH2A core histone family. J. Biol. Chem. 276:21776-21784. [DOI] [PubMed] [Google Scholar]
- 14.Costanzi, C., and J. R. Pehrson. 1998. Histone macroH2A1 is concentrated in the inactive X chromosome of female mammals. Nature 393:599-601. [DOI] [PubMed] [Google Scholar]
- 15.Costanzi, C., P. Stein, D. M. Worrad, R. M. Schultz, and J. R. Pehrson. 2000. Histone macroH2A1 is concentrated in the inactive X chromosome of female preimplantation embryos. Development 127:2283-2289. [DOI] [PubMed] [Google Scholar]
- 16.Csankovszki, G., A. Nagy, and R. Jaenisch. 2001. Synergism of Xist RNA, DNA methylation, and histone hypoacetylation in maintaining X chromosome inactivation. J. Cell Biol. 153:773-783. [DOI] [PMC free article] [PubMed] [Google Scholar]
- 17.Csankovszki, G., B. Panning, B. Bates, J. R. Pehrson, and R. Jaenisch. 1999. Conditional deletion of Xist disrupts histone macroH2A localization but not maintenance of X inactivation. Nat. Genet. 22:323-324. [DOI] [PubMed] [Google Scholar]
- 18.De Koning, L., A. Corpet, J. E. Haber, and G. Almouzni. 2007. Histone chaperones: an escort network regulating histone traffic. Nat. Struct. Mol. Biol. 14:997-1007. [DOI] [PubMed] [Google Scholar]
- 19.Disteche, C. M., G. N. Filippova, and K. D. Tsuchiya. 2002. Escape from X inactivation. Cytogenet. Genome Res. 99:36-43. [DOI] [PubMed] [Google Scholar]
- 20.Dorus, S., E. J. Vallender, P. D. Evans, J. R. Anderson, S. L. Gilbert, M. Mahowald, G. J. Wyckoff, C. M. Malcom, and B. T. Lahn. 2004. Accelerated evolution of nervous system genes in the origin of Homo sapiens. Cell 119:1027-1040. [DOI] [PubMed] [Google Scholar]
- 21.Gamble, M. J., K. M. Frizzell, C. Yang, R. Krishnakumar, and W. L. Kraus. 2010. The histone variant macroH2A1 marks repressed autosomal chromatin, but protects a subset of its target genes from silencing. Genes Dev. 24:21-32. [DOI] [PMC free article] [PubMed] [Google Scholar]
- 22.Grigoryev, S. A., T. Nikitina, J. R. Pehrson, P. B. Singh, and C. L. Woodcock. 2004. Dynamic relocation of epigenetic chromatin markers reveals an active role of constitutive heterochromatin in the transition from proliferation to quiescence. J. Cell Sci. 117(Pt. 25):6153-6162. [DOI] [PubMed] [Google Scholar]
- 23.Halleck, M. S., J. J. Lawler, S. Blackshaw, L. Gao, P. Nagarajan, C. Hacker, S. Pyle, J. T. Newman, Y. Nakanishi, H. Ando, D. Weinstock, P. Williamson, and R. A. Schlegel. 1999. Differential expression of putative transbilayer amphipath transporters. Physiol. Genomics 1:139-150. [DOI] [PubMed] [Google Scholar]
- 24.Hernandez-Munoz, I., A. H. Lund, P. van der Stoop, E. Boutsma, I. Muijrers, E. Verhoeven, D. A. Nusinow, B. Panning, Y. Marahrens, and M. van Lohuizen. 2005. Stable X chromosome inactivation involves the PRC1 polycomb complex and requires histone MACROH2A1 and the CULLIN3/SPOP ubiquitin E3 ligase. Proc. Natl. Acad. Sci. U. S. A. 102:7635-7640. [DOI] [PMC free article] [PubMed] [Google Scholar]
- 25.Hsiao, L. L., F. Dangond, T. Yoshida, R. Hong, R. V. Jensen, J. Misra, W. Dillon, K. F. Lee, K. E. Clark, P. Haverty, Z. Weng, G. L. Mutter, M. P. Frosch, M. E. Macdonald, E. L. Milford, C. P. Crum, R. Bueno, R. E. Pratt, M. Mahadevappa, J. A. Warrington, G. Stephanopoulos, and S. R. Gullans. 2001. A compendium of gene expression in normal human tissues. Physiol. Genomics 7:97-104. [DOI] [PubMed] [Google Scholar]
- 26.Karras, G. I., G. Kustatscher, H. R. Buhecha, M. D. Allen, C. Pugieux, F. Sait, M. Bycroft, and A. G. Ladurner. 2005. The macro domain is an ADP-ribose binding module. EMBO J. 24:1911-1920. [DOI] [PMC free article] [PubMed] [Google Scholar]
- 27.Kent, W. J., C. W. Sugnet, T. S. Furey, K. M. Roskin, T. H. Pringle, A. M. Zahler, and D. Haussler. 2002. The human genome browser at UCSC. Genome Res. 12:996-1006. [DOI] [PMC free article] [PubMed] [Google Scholar]
- 28.Lingenfelter, P. A., D. A. Adler, D. Poslinski, S. Thomas, R. W. Elliott, V. M. Chapman, and C. M. Disteche. 1998. Escape from X inactivation of Smcx is preceded by silencing during mouse development. Nat. Genet. 18:212-213. [DOI] [PubMed] [Google Scholar]
- 29.Mietton, F., A. K. Sengupta, A. Molla, G. Picchi, S. Barral, L. Heliot, T. Grange, A. Wutz, and S. Dimitrov. 2009. Weak but uniform enrichment of the histone variant macroH2A1 along the inactive X chromosome. Mol. Cell Biol. 29:150-156. [DOI] [PMC free article] [PubMed] [Google Scholar]
- 30.Ouararhni, K., R. Hadj-Slimane, S. Ait-Si-Ali, P. Robin, F. Mietton, A. Harel-Bellan, S. Dimitrov, and A. Hamiche. 2006. The histone variant mH2A1.1 interferes with transcription by down-regulating PARP-1 enzymatic activity. Genes Dev. 20:3324-3336. [DOI] [PMC free article] [PubMed] [Google Scholar]
- 31.Pehrson, J. R., and V. A. Fried. 1992. MacroH2A, a core histone containing a large nonhistone region. Science 257:1398-1400. [DOI] [PubMed] [Google Scholar]
- 32.Pehrson, J. R., and R. N. Fuji. 1998. Evolutionary conservation of macroH2A subtypes and domains. Nucleic Acids Res. 26:2837-2842. [DOI] [PMC free article] [PubMed] [Google Scholar]
- 33.Pehrson, J. R., C. Costanzi, and C. Dharia. 1997. Developmental and tissue expression patterns of histone macroH2A1 subtypes. J. Cell. Biochem. 65:107-113. [DOI] [PubMed] [Google Scholar]
- 34.Rasmussen, T. P., T. Huang, M. A. Mastrangelo, J. Loring, B. Panning, and R. Jaenisch. 1999. Messenger RNAs encoding mouse histone macroH2A1 isoforms are expressed at similar levels in male and female cells and result from alternative splicing. Nucleic Acids Res. 27:3685-3689. [DOI] [PMC free article] [PubMed] [Google Scholar]
- 35.Sporn, J. C., G. Kustatscher, T. Hothorn, M. Collado, M. Serrano, T. Muley, P. Schnabel, and A. G. Ladurner. 2009. Histone macroH2A isoforms predict the risk of lung cancer recurrence. Oncogene 28:3423-3428. [DOI] [PubMed] [Google Scholar]
- 36.Timinszky, G., S. Till, P. O. Hassa, M. Hothorn, G. Kustatscher, B. Nijmeijer, J. Colombelli, M. Altmeyer, E. H. Stelzer, K. Scheffzek, M. O. Hottiger, and A. G. Ladurner. 2009. A macrodomain-containing histone rearranges chromatin upon sensing PARP1 activation. Nat. Struct. Mol. Biol. 16:923-929. [DOI] [PubMed] [Google Scholar]
- 37.Van Dyck, F., C. V. Braem, Z. Chen, J. Declercq, R. Deckers, B. M. Kim, S. Ito, M. K. Wu, D. E. Cohen, M. Dewerchin, R. Derua, E. Waelkens, L. Fiette, A. Roebroek, F. Schuit, W. J. Van de Ven, and R. A. Shivdasani. 2007. Loss of the PlagL2 transcription factor affects lacteal uptake of chylomicrons. Cell Metab. 6:406-413. [DOI] [PubMed] [Google Scholar]
- 38.Yang, F., T. Babak, J. Shendure, and C. M. Disteche. 2010. Global survey of escape from X inactivation by RNA-sequencing in mouse. Genome Res. 20:614-622. [DOI] [PMC free article] [PubMed] [Google Scholar]
- 39.Zhang, R., M. V. Poustovoitov, X. Ye, H. A. Santos, W. Chen, S. M. Daganzo, J. P. Erzberger, I. G. Serebriiskii, A. A. Canutescu, R. L. Dunbrack, J. R. Pehrson, J. M. Berger, P. D. Kaufman, and P. D. Adams. 2005. Formation of macroH2A-containing senescence-associated heterochromatin foci and senescence driven by ASF1a and HIRA. Dev. Cell 8:19-30. [DOI] [PubMed] [Google Scholar]
Associated Data
This section collects any data citations, data availability statements, or supplementary materials included in this article.