Abstract
Stem-cell based therapies have emerged as a promising approach in regenerative medicine. In the development of such therapies, the demand for imaging technologies that permit the noninvasive monitoring of transplanted stem cells in vivo is growing. Here, we report the performance of gadolinium-containing carbon nanocapsules, or gadonanotubes (GNTs), as a new T1-weighted magnetic resonance imaging (MRI) intracellular labeling agent for pig bone marrow mesenchymal stem cells (MSCs). Without the use of a transfection agent, micromolar concentrations of GNTs can deliver up to 109 Gd3+ ions per cell without compromising cell viability, differentiation potential, proliferation pattern, and phenotype. Imaging 10×106 GNT-labeled MSCs demonstrates a nearly two-fold reduction in T1 relaxation time when compared to unlabeled MSCs at 1.5 T in a clinical MRI scanner, which easily permits the discrimination of GNT-labeled MSCs in a T1-weighted MR image. It is anticipated that GNTs will allow in vivo tracking of GNT-labeled MSCs, as well as other mammalian cell types, by T1-weighted imaging with greater efficacy than other current technologies now allow.
Keywords: Stem cell, MRI (magnetic resonance imaging), nanoparticle, cell labeling, carbon nanotubes, gadonanotubes (GNTs)
1. Introduction
The demand for advanced cell tracking technologies is increasing in the field of stem cell therapy. While currently relying on the immunohistochemistry of extracted tissue samples to visualize cells within a living system, investigators desire a noninvasive and more accurate means of imaging transplanted stem cells in vivo to better examine their regenerative abilities, monitor their retention rate in the target tissue, and determine the biodistribution of the remaining cells lost post-transplantation.
Recent efforts have been made to develop nanoparticle-based stem cell labeling techniques using magnetic resonance imaging (MRI) [1-18]. Among the various medical diagnostic imaging modalities available, MRI is ideal for tracking stem cells in vivo as it allows for serial imaging acquisitions that provide high spatial resolution in a noninvasive and non-ionizing manner. In 2007, approximately 43% of the 27.5 million clinical MRI procedures performed in the U.S. use contrast agents (CAs) to alter MR signals [19]. In general, paramagnetic T1-weighted CAs, which enhance MR signals to produce bright positive contrast, are preferred over superparamagnetic T2-weighted CAs, which decrease MR signals to produce dark negative contrast. The hypointensity caused by T2-weighted CAs may make it more difficult to distinguish them from the inherently low signals caused by other tissues or imaging artifacts [20]. Most available T1-weighted CAs are based on the Gd3+ ion because of its high magnetic moment and symmetric electronic ground state [21]. However, these FDA-approved gadolinium-based CAs (GBCAs) are restricted to extracellular space and, in general, lack the ability to accumulate within cells to produce signal intensity enhancement for their detection on the cellular level [22].
A primary focus in GBCA advancement is the development of new CAs that possess greater water-proton relaxation efficacy, or relaxivity, than that of current CAs to improve image contrast. Because biological constraints limit the number of CAs that can be delivered to the surface of a single cell to the nanomolar (nM) range [23], the visualization of individual cells and their tissues requires that each unit of a particular CA must produce high enough signal intensity to be detected at nanomolar concentrations. In addition to their performance, an ideal CA must also be biologically inert and nontoxic at appropriate dosage levels for a clinical setting.
To address these concerns, we have developed a new high-performance carbon nanotube-based GBCA that effectively labels cells at low loading concentrations. These CAs, known as gadonanotubes (GNTs, Figure 1), are short (20-80 nm) segments of single-walled carbon nanotubes (SWNTs) encapsulating small clusters of Gd3+ ions [24-26]. The GNTs exhibit a T1 relaxivity (r1) greater than that of any known material to date, with values of 170 mM−1 s−1 (40 °C, 1.5 T) and >600 mM−1 s−1 (40 °C, 0.4 T) per Gd3+ ion [24]. At clinically-used magnetic field strengths (1.5 T), the GNTs outperform commercially-available GBCAs, e.g., gadopentetate dimeglumine (Gd-DTPA or Magnevist®), by nearly 40-fold [24-26].
Figure 1.

A representative illustration of a gadonanotube (GNT). Clusters of internally-loaded Gd3+ ions are located at defect sites along the nanocapsule sidewalls.
This report describes the in vitro magnetic cell labeling performance and biological effects of GNTs in pig bone marrow-derived mesenchymal stem cells (MSCs) for T1-weighted cellular MRI. Because of their extremely high relaxivity and tendency to readily translocate through the cellular membrane in the absence of a transfection agent, the GNTs are superior candidates for the magnetic labeling and monitoring of stem cells, and other mammalian cell types, such as cancer cells [27], by T1-weighted MRI.
2. Materials and methods
2.1. Sample Preparation
Full-length SWNTs produced by the electric-arc discharge method were cut into ultra-short SWNTs (US-tubes, 20-80 nm in length) by fluorination and pyrolysis at 1000 °C under inert atmosphere [28]. US-tubes were then reduced using Na0/THF to produce individualized or small bundles of US-tubes [29]. The reduced US-tubes were sonicated in an aqueous GdCl3 solution for 60 min, which was then left undisturbed overnight to allow for the GNTs to flocculate from the solution. The GNTs were collected by filtration, washed multiple times with deionized water to remove excess external Gd3+ ions, and dried at 60 °C.
Stock solutions were made by suspending dry GNTs in 0.17% (w/v) Pluronic F-108 via probe sonication for 6 min, followed by centrifugation at 3200 rpm for 10 min to remove unsuspended GNTs. For all studies, the Gd3+-ion concentration of the stock solutions was maintained at 76 μM, as confirmed by inductive-coupled plasma optical emission spectrometry (ICP-OES). Prior to their addition to cell cultures, stock solutions were sterilized under UV light for 3 h while rocking.
2.2. Cell Culture Studies
MSCs were harvested and isolated from the bone marrow of male pigs as described elsewhere [30]. MSCs were expanded in two successive passages at 20×103 cells/cm2. Cells in the second passage (P2) were then frozen in cryovials, and at appropriate times, MSCs were thawed and expanded (P3) prior to labeling. Cell cultures were incubated at 37 °C (95% relative humidity in 5% CO2). Unless otherwise specified, MSCs were grown and maintained in alpha minimal essential medium (αMEM) containing 10% fetal bovine serum (FBS) and 1% antibiotic supplement (200 mM L-glutamine, 10,000 units/mL penicillin, and 10 mg/mL streptomycin). All labeling studies were performed with P3 MSCs.
2.2.1. Label Concentration
To determine the optimal labeling concentration, MSCs were initially plated on 6-well tissue culture plates at 2×10⁴ cells/well and were allowed to reach 70% confluence. The medium was removed, and the attached cells were co-cultured with GNTs in αMEM at various Gd3+-ion concentrations (15-42 μM). After 24 h, the cells were washed with phosphate buffered saline (1×PBS) and exposed to a mild ice-cold acid-strip buffer solution (50 mM glycine-HCl, 100 mM NaCl, and 2 mg/mL polyvinylpyrrolidone at pH 3.0) for 10 min at 4 °C. This has been previously shown to remove up to 95% of membrane-bound ligands without affecting cell viability [31]. The cells were washed again with 1×PBS and lifted upon exposure to trypsin-EDTA for 5 min. The cell suspension of GNT-labeled MSCs was then passed through a 70 μm nylon filter to eliminate large cell-GNT aggregates and transferred to a 50 mL centrifuge tube. To isolate “cleaned” cells (GNT-labeled MSCs without GNTs on their cellular membranes) from excess GNTs in solution, a density gradient centrifugation was performed. Briefly, Histopaque 1077 (Sigma, 25 °C) was slowly added in a 1:2 volume ratio (Histopaque:cells) to the bottom of the tube. The sample was then centrifuged at 400 × g for 20 min. Upon successful separation, GNT-labeled MSCs were located at the interface of the αMEM and Histopaque phases. The cells were then isolated and washed twice with αMEM and centrifugation at 1500 rpm for 10 min. Light microscopy images of the cells during the cleaning protocol are documented in Figure S2 in the Supplementary Data. The cells were counted (Beckman Coulter MultiSizer 3) and prepared for ICP-OES analysis.
2.2.2. Incubation Time
MSCs were plated and grown as described above. The medium was removed, and the cells were co-cultured with GNTs (27 μM Gd3+) in αMEM. The cells were then incubated and collected at various times (1, 2, 4, 8, 12, and 24 h). Upon collection, cells were cleaned, isolated, counted, and prepared for ICP-OES analysis.
2.2.3. Cell Viability
GNT-labeled MSCs were prepared and co-cultured with GNTs (27 μM Gd3+) as described above. Positive controls (unlabeled MSCs) and negative controls (unlabeled MSCs treated with 70% methanol for 30 min) were also cultured. A LIVE/DEAD viability/cytotoxicity assay kit (Invitrogen) was used to determine the viability of the GNT-labeled MSCs. The LIVE/DEAD reagents consist of calcein AM, which fluoresces green upon being cleaved from esterase activity in viable cells, and ethidium homodimer-1, which fluoresces red and can only enter cells with a compromised cellular membrane. To each well, the LIVE/DEAD reagents were added and the culture plates were incubated in the dark for 30 min at room temperature. Fluorescence-activated cell sorting (BD Excalibur Flow Cytometer) was used to measure fluorescence intensities.
2.2.4. Label Retention
MSCs were plated and grown as previously mentioned above. A pulse-chase protocol was then performed on the MSCs, which includes cell labeling in αMEM containing GNTs (27 μM Gd3+) for 24 h (pulse), removal of non-incorporated GNTs, and incubating the cells in fresh αMEM without GNTs (chase). In Group A, the culture medium remained unchanged for the entire chase time, while in Group B media changes occurred every 24 h during the entire chase time (72 h). The cells and supernatant media were separately collected at 24, 48, and 72 h after initiating the chase. The cell and media samples of each group were then prepared for ICP-OES analysis.
2.2.5. Colony-Forming Unit Fibroblast Assay
MSCs were labeled with GNTs (27 μM Gd3+) for 24 h and processed as described above. GNT-labeled MSCs were plated in 75 cm2 tissue culture flasks at 1000 cells/flask in 12 mL growth medium. The cells were cultured for 7 days, with medium replacement every 3-4 days. Control flasks were plated with unlabeled MSCs. To enumerate CFU-F content, cultures were washed with 1×PBS, fixed with methanol, and stained with Giemsa stain. Colonies with 40 or more cells were counted under a stereomicroscope (2-5×).
2.2.6. Population Doubling Time (PDT) Assay
MSCs were labeled with GNTs (27 μM Gd3+) for 24 h and processed as described above. The GNT-labeled cells were replated on 96-well tissue culture plates at 1×10³ cells/well. Control wells with unlabeled MSCs were also plated and analyzed concurrently. Cell proliferation was measured using a CyQUANT proliferation assay kit (Invitrogen) during the cell growth long lag phase as described by Griffiths et al [32]. At specific time points, the medium was aspirated from the wells and replaced with the CyQUANT reagent. Fluorescence detection was measured on a microplate reader (TECAN Safire2™) with filters appropriate for 485/528 nm (excitation/emission). This assay is designed to produce a linear analytical response; therefore, a standard curve was generated by plating known numbers of MSCs on 96-well tissue culture plates and the fluorescence intensity values obtained from them after labeling with the CyQUANT reagent were used to calculate cell numbers.
2.2.7. Cell Differentiation
MSCs were labeled with GNTs (27 μM Gd3+) for 24 h and processed as described above. GNT-labeled MSCs were grown under adipogenic, osteogenic, or chondrogenic conditions for 14 to 21 days to evaluate their differentiation potential. The differentiation of positive controls (unlabeled MSCs exposed to differentiation conditions) and negative controls (unlabeled MSCs exposed to αMEM) were also prepared and monitored.
For adipogenic differentiation, GNT-labeled MSCs were plated and grown in 6-well tissue culture plates at 2×10⁴ cells/well. Once 70% confluence was reached, the cells were first grown in adipogenic differentiation medium (10 μg/mL insulin, 10% FBS, 1 μM dexamethasone, 0.5 mM methyl-isobutylxanthine, and 100 μM indomethacine in high glucose DMEM) for 3 days and then grown in adipogenic maintenance medium (10 μg/mL insulin and 10% FBS in high glucose DMEM) for another 3 days. This alternating treatment was repeated twice more to obtain full adipogenic differentiation. The adipogenic cultures were stained with Oil Red O, which identifies the presence of lipid vacuoles within the MSCs.
For osteogenic differentiation, GNT-labeled MSCs were plated and grown in 6-well tissue culture plates at 3×10⁴ cells/well. Once 70% confluence was reached, the cells were cultured in osteogenic differentiation medium (10% FBS, 50 μg/mL ascorbate 2 phosphate, 0.1 μM dexamethasone, and 10 mM β-glycerol phosphate in high glucose DMEM) for 21 days, with media replacement every 3 to 4 days. Upregulated alkaline phosphatase activity, a characteristic of early osteocytes, was observed in GNT-labeled MSCs upon staining the cultures with a Vector Red Alkaline Phosphatase Substrate Kit (Vector Laboratories) with a fluorescent microscope.
For chondrogenic differentiation, 2×10⁵ GNT-labeled MSCs were transferred into 15-mL conical tubes and centrifuged at 450 rpm for 5 min. The cell pellets were then cultured in the tubes for 21 days in chondrogenic differentiation medium (40 μg/mL proline, 100 μg/mL sodium pyruvate, 10 ng/mL TGF-β3, 0.1 μM dexamethasone, 50 μg/mL ascorbate 2 phosphate, 500 mg/mL BMP-6, and 1% ITS+premix in high glucose DMEM), with media replacement every 3 to 4 days. The MSCs formed a small spherical mass at the bottom of the tube and were then fixed with 4% paraformaldehyde, embedded in paraffin, and stained with Alcian Blue, which identifies glycosaminoglycans.
2.2.8. Cell Adhesion
MSCs were labeled with GNTs (27 μM Gd3+) for 24 h as described above. Another set of MSCs were co-cultured with 0.17% Pluronic F-108 in αMEM (35% v/v) for 24 h. Unlabeled, Pluronic-treated, and GNT-labeled MSCs were each then split into two groups. The first group was processed without the acid-strip buffer solution, while the second group was treated with the acid-strip buffer solution as described above.
All groups of MSCs were exposed to calcein-AM (Invitrogen) for 30 min at 37 °C. The cells were then centrifuged for 3 min at 1500 rpm and resuspended in medium. Cells were plated at 2×10⁵ cells/well on a 96-well plate treated with various concentrations of either human plasma fibronectin (0-10 μg/mL) or pig collagen I (0-100 μg/mL) and blocked with 2% bovine serum albumin in tris-buffered saline (pH 7.5). After incubating for 30 min at 37 °C, the plate was then gently washed three times with 1×PBS (0.6 mM MgCl2, 1.2 mM CaCl2) to remove unattached cells. A lysis buffer (50 mM Tris pH 7.5, 1% NP-40, and 5 mM EDTA) was added to allow the fluorescent dye to be released from the cells. Fluorescence measurements were performed on a microplate reader (TECAN Safire2™) with filters appropriate for 485/530 nm (excitation/emission).
2.2.9. Flow Cytometry
Unlabeled and GNT-labeled MSCs were labeled with FITC mouse anti-pig CD45 primary antibody (clone K252-1E4; AbD Serotec, Oxford, UK), PECy5 mouse anti-human CD90 (clone 5E10, BD Pharmingen), FITC mouse anti-human CD105 (clone MEM-229; Abcam), and FITC mouse anti-pig CD29 primary antibody (clone NaM160-1A3, BD Pharmingen). Data acquisition was performed on a FACS Calibur Flow Cytometer (Becton Dickinson). Unlabeled and GNT-labeled MSCs were analyzed for the expression of various factors, including CD29, CD45, CD90, and a secondary antibody.
2.3. Magnetic Resonance Imaging
Unlabeled and GNT-labeled MSCs were centrifuged into cell pellets in Eppendorf tubes at 10 × 106 cells/tube with 1 mL αMEM. Another cell pellet of MSCs labeled with Gd-DTPA (27 μM Gd3+) was also prepared. A 1.5 T MRI scanner (Achieva, Philips Health Care, The Netherlands) was used for the in vitro cellular MRI studies at room temperature (25 °C). A transmit-receiver head coil was used for the acquisitions. An inversion recovery prepared turbo-spin sequence was used to measure the T1 relaxation times of the samples (TR = 2500 ms; TE = 13 ms;). The acquisition matrix resolution was 0.5×0.5×2.5 mm acquired over a field-of-view of 45 × 45 mm. Acquisitions were made at 8 different inversion times (TI) from 50 ms to 2200 ms and T1 was calculated using the standard inversion recovery equation.
2.4. Transmission Electron Microscopy (TEM)
GNT-labeled (co-cultured with GNTs at 27 μM Gd3+) and unlabeled MSCs (2× 10⁵ each sample) were centrifuged at 1500 rpm for 10 min to form a cell pellet. The cell pellet was then fixed in 4%, glutaraldehyde for 2 days, washed with 1×PBS, post-fixed with 1% OsO4 for 1 h, dehydrated through a series of graded alcohol washes, infiltrated with acetone and Epon 812 plastic resin, and embedded with 100% Epon 812 in a mold. Several 1 μm sections (thick sections) were cut and stained with 1% methylene blue and 1% basic fuchsin. Ultra-thin sections (80 nm) were cut from the sample block using a RMC MTXL ultra microtome and mounted on 100-mesh copper grids. The grids were stained with 2% alcoholic uranyl acetate and Reynold’s lead citrate. The samples were examined with a JEOL 1250 TEM and equipped with an AMTV 540 digital imaging system at St. Luke’s Episcopal Hospital (Houston, TX).
2.5. Inductively-Coupled Plasma-Optical Emission Spectrometry (ICP-OES)
ICP-OES analyses were performed by a PerkinElmer Optima 4300 DV Inductively-Coupled Plasma Optical Emission Spectrometer. Five scans were performed for each sample. Gadolinium concentration was detected at 342.247 nm, while yttrium (371.029 nm) was used as the internal drift standard. To prepare samples for analysis, the collected cell samples were transferred to glass vials and heated with 500 μL 25% HClO3 until boiling. Once the samples turned from yellow to colorless, an additional aliquot of HClO3 was added and heated to evaporation. The samples were then diluted to 10 mL with 2% HNO3 and filtered through a syringe filter.
2.6. Statistical Analysis
Unless otherwise noted, all experiments were conducted in triplicate. Single-factor analysis of variance (ANOVA) tests were used to determine statistical significance of comparisons with a 95% confidence interval (P < 0.05). All data are reported as means ± standard deviation.
3. Results & discussion
3.1 Magnetic Cell Labeling
Optimal conditions were determined for the magnetic labeling of MSCs with GNTs. Figure 2 shows cellular uptake as a function of GNT concentration. The most efficient labeling concentration was found to be at 27 μM Gd3+, which delivered 0.98 pg or approximately 109 Gd3+ ions per cell, without affecting cell viability (98% based on calcein AM-positive cells, LIVE/DEAD assay; Figure S1 in the Supplementary Data). Complete labeling was achieved by 4 h and remained constant for up to 24 h of incubation, as shown in Figure 3. This efficient accumulation of GNTs is similar to that observed for recent studies involving the cellular loading of other nanoparticles. A recent study recorded up to 20 pg of magnetite cationic liposomes (MCLs), or approximately 1011 Fe atoms, were uptaken per human MSC after 4 h [33]. Similarly, Gd3+ ion-encapsulated C60 fullerenes (Gd@C60) internalized up to 133.6 pg, or 1011 Gd3+ ions, per mouse MSC within 2-8 h of incubation [8]. However, a direct comparison cannot be made between the present GNT-MSCs system and other nanoparticle-based MSC labeling studies, since cellular uptake is highly dependent on the type of nanoparticle, as well as their preparation and administration in cell cultures.
Figure 2.
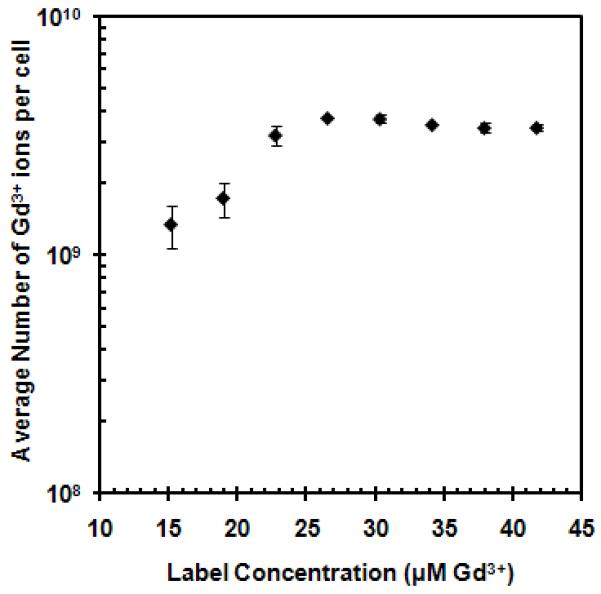
MSC uptake of GNTs as a function of GNT concentration. The graph is plotted on a logarithmic scale with error bars being standard deviations Note: error bars may be smaller than the symbols.
Figure 3.
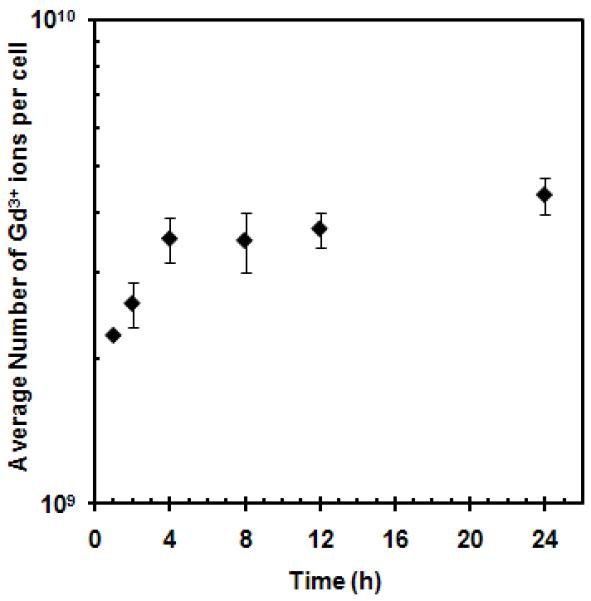
MSC uptake of GNTs as a function of incubation time. The graph is plotted on a logarithmic scale with error bars being standard deviations Note: error bars may be smaller than the symbols.
Transmission electron microscopy (TEM) visually confirmed the cellular uptake of the GNTs, which appear as irregular electron-dense aggregates within the cytoplasm, as depicted in Figure 4. The substantial intracellular accumulation of GNTs suggests that an active form of endocytosis is involved. However, there is no clear indication of vesicular membranes enclosing any GNT aggregates or of GNTs translocating into the nucleus. More comprehensive studies of the exact mechanism of GNT uptake into MSCs are currently underway.
Figure 4.
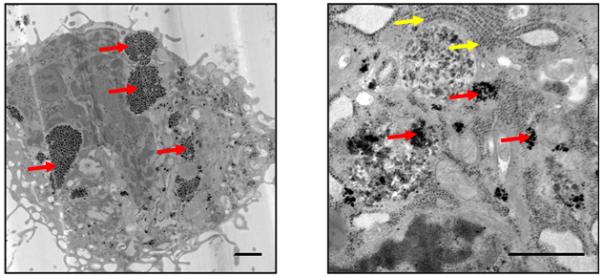
TEM images of a GNT-labeled MSC. Red arrows point to GNT aggregates in the cytoplasm. Yellow arrows point to ribosomes of the endoplasmic reticulum. Scale bar = 1 μm.
3.2. Label Retention
In addition to understanding their mechanism of uptake, the eventual release of GNTs from cells must be considered. To determine whether the GNTs “leak” from the MSCs over time, a pulse-chase study was performed (Figure 5). The Gd3+-ion content of the GNT-labeled cells and their culture medium were analyzed under two different experimental conditions. In one set of cultures (Group A, gray) no medium changes were performed during the entire chase period (72 h), while in a second set (Group B, black) the medium was replaced every 24 h during the chase period. As seen in Figure 5a and 5b, a decrease in Gd3+-ion content in the cell samples occurred at 24 h but remained unchanged in both groups for up to 72 h. Conversely, an increase in Gd3+-ion content in the media samples was observed at 24 h. However, the quantity of Gd3+ ions in the media of Group B decreased to an undetectable level by 72 h upon replenishing the media every 24 h, while the quantity found in the media of Group A remained unchanged.
Figure 5.
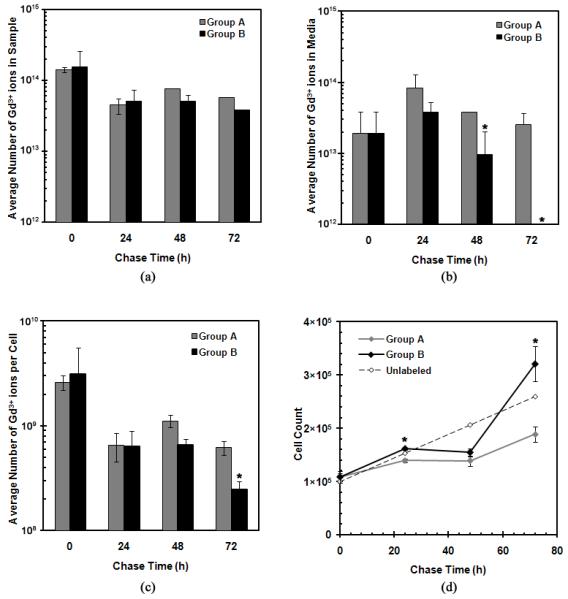
GNT retention in MSCs as a function of chase time: (a) the total average number of Gd3+ ions found in the cell samples, (b) the total average number of Gd3+ ions in the media, (c) the total average number of Gd3+ ions per GNT-labeled cell, and (d) the cell count of each cell sample upon collection. All graphs are plotted on a logarithmic scale with error bars being standard deviations. Note: error bars may be smaller than the symbols; * represents statistical difference (P < 0.05).
This observed loss of Gd3+-ion content in the cell samples and the respective increase in their media at 24 h may be attributed to a combination of: (1) the expulsion of GNTs from the cells, (2) cell detachment, and/or (3) cell death. To better understand the dynamics of the GNTs within the cell cultures, the average amount of Gd3+ ions uptaken per cell in each group was calculated (Figure 5c) based on the cell population of each group over time (Figure 5d).
Assuming that the expulsion of GNTs from the cells occurs due to concentration gradient diffusion, it is expected that the quantity of Gd3+ ions of the GNTs found in each cell would decrease and the amount in the respective media samples would increase over time upon replenishing the media every 24 h in Group B. However, the average quantity of Gd3+ ions in each cell remains constant between 24 and 48 h, as the cell populations remain static when compared to the proliferation rate of unlabeled cells. This stunted growth in cell population suggests that the Gd3+-ion content detected in the media may be attributed to cell death and/or cell detachment 24 to 48 h after labeling. However, the quantification of dead cells in the media during the chase period proved to be difficult, as cell debris was mostly found.
GNT-labeled MSCs from both groups exhibited increased growth rates after 48 h, which may imply that the cells eventually adjusted to the presence of the foreign GNT nanoparticles. Additionally, Group B proliferated faster than Group A, suggesting that changing the media, hence removing dead GNT-labeled cells and replenishing nutrients, results in a healthier environment that promoted cell growth. This accelerated proliferation rate corresponded to the decrease in Gd3+-ion content per cell at 72 h. The undetectable amount of Gd3+ ions in the media at 72 h also suggests that no significant intracellular Gd3+-ion loss occurred. Nevertheless, the Gd3+-ion content in each cell remained high even after 72 h, with approximately 108 Gd3+ ions per cell in both Groups A and B.
Although the above results suggest that the loss of Gd3+ ions into the media over time is more likely due to cell death and cell detachment rather than to the movement of GNTs across cellular membranes, the expulsion of GNTs from the cells may still possibly occur. Because it is crucial to ensure the GNT-labeled cells lack membrane-bound GNTs, an extensive cell cleaning and separation protocol was used for these studies; however, it is still not certain whether the protocol successfully eliminates all GNTs that had not been completely incorporated into the cells. Additionally, the eventual release of GNTs from MSCs due to cell death and their eventual redistribution could have an impact on their performance as in vivo magnetic labeling agents and therefore must be further studied.
3.3. Cell Characteristics after GNT Labeling
To evaluate the self-renewal properties and proliferation kinetics of GNT-labeled MSCs, colony-forming unit fibroblast (CFU-F) and population doubling time (PDT) assays were performed. As seen in Table 1, both studies suggest that GNTs do not impair either the self-renewal or the proliferation kinetics of MSCs. In fact, the GNT labeling increased the self-renewal rate of MSCs by 20% after 7 days (unlabeled CFU: 252 ± 11; labeled CFU: 319 ± 9). This increased growth rate is further confirmed by the calculated PDT of both cultures, being 7.36 h for GNT-labeled cells and 9.31 h for unlabeled cells.
Table 1.
Population doubling time (PDT) and colony forming unit-fibroblast (CFU-F) results of GNT-labeled MSCs
| Cells | PDT* (h) |
Plating Density (cells/well) |
CFU-F* After 7 Days |
|---|---|---|---|
| Unlabeled | 9.31 | 1000 | 252 ± 11 |
| GNT-Labeled | 7.36 | 1000 | 319 ± 9 |
Statistical differences (P < 0.05) were observed for both PDT and CFU-F comparisons.
As multipotent progenitor cells, MSCs have the ability to differentiate into a variety of cell types. As seen in Figure 6, GNT-labeled cultures successfully differentiated into adipocytes, osteocytes, and chondrocytes. Upon appropriate induction, intracellular lipid vacuoles, alkaline phosphatase activity, and glycosaminoglycans were evidenced, respectively demonstrating adipo-, osteo-, and chondrogenic differentiation capacity of GNT-labeled MSCs. This establishes that the magnetic labeling of MSCs with GNTs did not affect the differentiation potential of the MSCs, which suggests that GNT-labeled MSCs may retain their therapeutic potential, which is critical for stem cell therapy. Quantitative analyses will be required to further corroborate the differentiation abilities of GNT-labeled MSCs.
Figure 6.
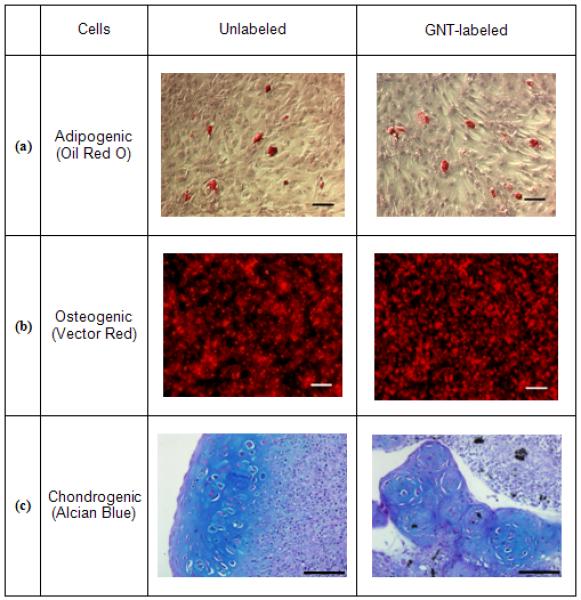
Histochemical stains of unlabeled and GNT-labeled MSCs exposed to (a) adipogenic, (b) osteogenic, or (c) chondrogenic media. In (a), the presence of intracellular lipid vacuoles is stained with Oil Red O; in (b), Vector red fluorescence marks the presence of alkaline phosphatase; in (c), Alcian blue stains the presence of glycosaminoglycans. Scale bar = (a) 50 μm, (b) 50 μm, and (c) 100 μm.
Another important cell characteristic is the cell surface marker expression on GNT-labeled MSCs. As such, flow cytometry was used to evaluate the expression of cell surface markers typically used to phenotype human MSCs (CD45, a marker for myeloid cells; CD90, a marker of primitive progenitor cells, and CD105, a truncated TGF-β receptor) upon the GNT-labeled pig MSCs. As seen in Figure 7, MSCs are CD45−CD90+, as expected; however, a small fraction of pig MSCs were CD105+, which differs from human MSCs. Labeled cells displayed similar rates of expression for CD45−CD90+ (GNT-labeled MSCs: 94.40%; unlabeled MSCs: 94.13%) and also for CD105 (GNT-labeled MSC: 10.80%; unlabeled MSCs: 12.62%) to their unlabeled counterparts. CD29+ (β1 integrin), a ubiquitous cell marker, was expressed by the majority of both unlabeled (97.57%) and GNT-labeled MSCs (96.29%). According to these findings, GNT labeling does not affect the expression of cell surface markers, but a more comprehensive analysis of gene and protein expression is necessary to validate GNTs as innocuous agents for cell labeling. Currently, the effect of GNT labeling on gene expression is being investigated in our laboratories by microarray analysis [34].
Figure 7.
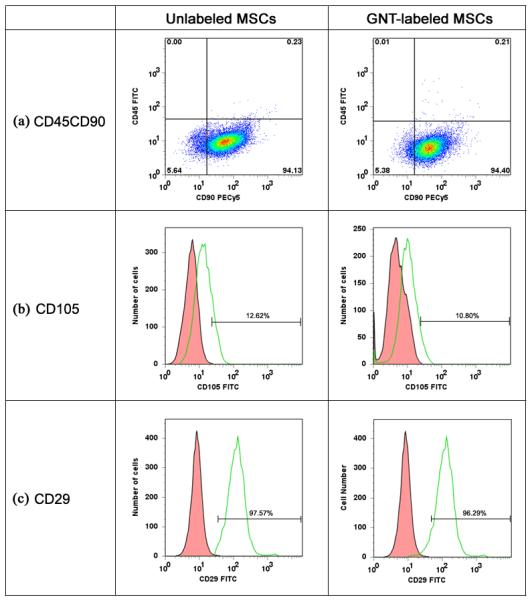
Flow cytometry analysis performed on both unlabeled and GNT-labeled MSCs to determine the expression of CD45, CD90, CD105, and CD29. Histograms represent (a) cells incubated with FITC-labeled mouse anti-pig CD45 and PECy5-labeled mouse anti-human CD90, (b) cells incubated with the FITC-labeled CD105, and (c) cells incubated with FITC-labeled mouse anti-pig CD29. Isotype control, red; MSC samples, green.
Finally, the effects of GNT labeling on MSC adhesion properties were studied. A cell adhesion assay was used to evaluate the interaction of unlabeled, Pluronic-treated, and GNT-labeled MSCs with collagen I and fibronectin, which are two major components of the extracellular matrix (ECM). Besides serving as structural support for cell adhesion, fibronectin and collagen I are involved in vital cell signaling pathways through their interactions with cell adhesion receptors, such as integrins [35, 36]. Ideally, a dose response curve is observed when measuring the intensity of fluorescently-labeled MSCs that successfully bind to culture plates treated with increasing ECM protein concentration. Although it has been previously established that the class of Pluronic surfactants can be used as excellent anti-adhesives for cell cultures [37], Figures 8a and 8b suggest that Pluronic F-108 does not significantly hinder cell adhesion to ECM proteins as GNTs do. MSCs incubated with Pluronic F-108 behaved similarly to unlabeled MSCs, while GNT-labeled MSCs showed a decreased response to both fibronectin and collagen I. This observation that Pluronic F-108 does not inhibit cell adhesion while in the presence of ECM proteins has similarly been evidenced with neuroblastoma cells [38]. Additional studies are currently underway to determine whether the GNTs are physically blocking cell adhesion receptor sites or chemically altering the cell adhesion properties of the labeled MSCs.
Figure 8.
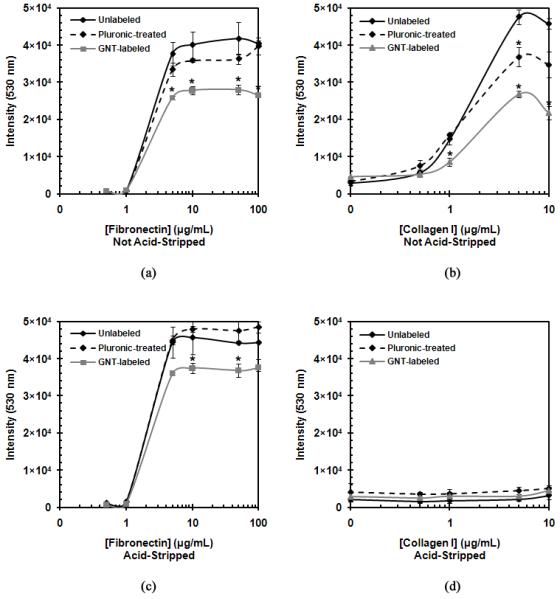
Cell adhesion properties of unlabeled, Pluronic-treated, and GNT-labeled MSCs. Non-acid-stripped MSC response to (a) fibronectin and (b) collagen I. (d) Acid-stripped MSC response to (c) fibronectin and (d) collagen I. Note: error bars may be smaller than the symbols; * represents statistical difference (P < 0.05).
However, it was determined that the acid-stripping protocol used to clean the GNT-labeled MSCs deterred cell adhesion to collagen I (Figure 8d). The unlabeled, Pluronic-treated, and GNT-labeled MSCs all lost their ability to adhere to collagen I when treated with the acid-strip buffer solution, while those not treated with the acid-strip buffer solution retained their cell adhesion properties. Additionally, the acid-stripping protocol did not affect the cell adhesion response to fibronectin (Figure 8c). This suggests that the acid-stripping protocol may be removing the integrins involved in collagen I adhesion and not those involved in fibronectin adhesion. While the loss of collagen I adhesion may be disadvantageous in some respects, our studies demonstrated that the acid-stripped GNT-labeled MSCs do not lose their important stem cell characteristics.
3.4. Magnetic Resonance Imaging
To simulate the number of MSCs in a single injection that will be delivered for the treatment acute myocardial infarction [39], MR images were taken of GNT-labeled MSCs, Gd-DTPA-labeled MSCs, and unlabeled MSCs (10×106 MSCs/pellet) at various inversion delay (Ti) times (Figure 9). Substantial MR signal contrast was generated between the labeled and the unlabeled cells. The T1 of GNT-labeled MSCs was 494.9 ms (CB: 95%, 378-610 ms), the T1 of Gd-DTPA-labeled MSCs was 1079 ms (CB: 95%, 698-1461 ms), and the T1 of unlabeled MSCs was 875.9 ms (CB: 95%, 595-1157 ms).
Figure 9.
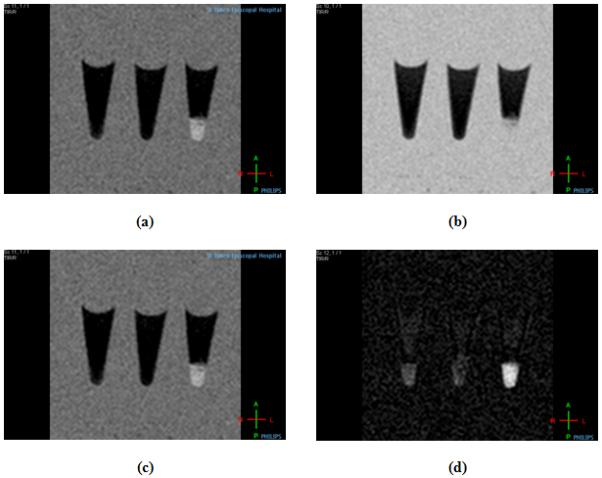
T1-weighted MR images at 1.5 T and 25 °C of (left to right) unlabeled MSCs, Gd-DTPA-labeled MSCs, and GNT-labeled MSCs at (a) Ti = 150 ms, (b) Ti = 300 ms, (c) Ti = 500 ms, and (d) Ti = 800 ms.
With a nearly two-fold decrease in the measured T1 relaxation time of GNT-labeled MSCs compared to unlabeled MSCs, the GNTs serve as effective in vitro magnetic labeling agents, even at low loading concentrations. In comparison to Gd-DTPA, which did not label cells at all, GNTs caused a much larger contrast enhancement, even under identical labeling concentrations. However, several challenges will need to be addressed when proceeding to in vivo MRI, such as longer relaxation times and lower contrast produced by tissues, the presence of imaging artifacts, and the inherently low sensitivity of clinical MRI scanners to image on the cellular level. Regardless, the significant T1 reduction of GNT-labeled MSCs and the lack of cytotoxicity of the GNTs make these carbon nanostructures serious candidates as MRI cell labeling agents for in vivo cell monitoring studies.
4. Conclusion
With over 2,000 stem cell-based clinical trials currently underway, the need for better in vivo cell tracking technologies is apparent. With such technologies in place, the development of stem cell-based therapeutics for the prevention, detection, and treatment of human diseases should progress more rapidly, since cell tracking helps elucidate stem cell migration and tissue integration, determine the effective dose of delivered stem cells to a target organ, and monitor cell-based therapeutic delivery. As demonstrated by the present in vitro studies, GNTs can successfully be internalized by MSCs without affecting cell viability, differentiation, or self-renewal abilities. However, observations about GNT-labeled MSC interaction with fibronectin- and collagen-coated surfaces suggest a change in cell adhesion properties upon GNT labeling. Finally, the present study also demonstrates that a GNT-labeled MSC pellet produces a brighter T1-weighted MR phantom image than an unlabeled MSC pellet, implying that the GNTs represent a new, high-performance biotechnology for stem-cell labeling and possibly in vivo cell tracking by real-time MRI.
Supplementary Material
Acknowledgment
The authors thank Wendy Schober-Ditmore (MD Anderson Cancer Center, Houston, TX, USA) for flow cytometry analysis, Dr. Deborah Vela (St. Luke’s Episcopal Hospital, Houston, TX, USA) for the histological analyses, Ralph Nichols (St. Luke’s Episcopal Hospital, Houston, TX, USA) for acquiring the TEM images, and Dr. Maximillian Buja (University of Texas Health Science Center of Houston, Houston, TX, USA) for his assistance with TEM analysis. This work was supported by grants from the National Institutes of Health (1RC1EB010791-01), the National Science Foundation (DGE-0940902), the Robert A. Welch Foundation (C-0627), and the Nanoscale Science and Engineering Initiative of the National Science Foundation at Rice University (EEC-0647452).
Appendix
Additional figures documenting cell viability (Figure S1) and acid-stripping protocol (Figure S2) can be found in the Supplementary Data section.
Footnotes
Publisher's Disclaimer: This is a PDF file of an unedited manuscript that has been accepted for publication. As a service to our customers we are providing this early version of the manuscript. The manuscript will undergo copyediting, typesetting, and review of the resulting proof before it is published in its final citable form. Please note that during the production process errors may be discovered which could affect the content, and all legal disclaimers that apply to the journal pertain.
REFERENCES
- 1.Kraitchman DL, Bulte JW. Imaging of stem cells using MRI. Basic Res Cardiol. 2008;103(2):105–113. doi: 10.1007/s00395-008-0704-5. [DOI] [PMC free article] [PubMed] [Google Scholar]
- 2.Acton PD, Zhou R. Imaging reporter genes for cell tracking with PET and SPECT. Q J Nucl Med Mol Imaging. 2005;49(4):349–360. [PubMed] [Google Scholar]
- 3.Bulte JW, Kostura L, Mackay A, Karmarkar PV, Izbudak I, Atalar E, et al. Feridex-labeled mesenchymal stem cells: cellular differentiation and MR assessment in a canine myocardial infarction model. Acad Radiol. 2005;12(Suppl 1):S2–6. doi: 10.1016/j.acra.2005.02.014. [DOI] [PubMed] [Google Scholar]
- 4.Kraitchman DL, Tatsumi M, Gilson WD, Ishimori T, Kedziorek D, Walczak P, et al. Dynamic imaging of allogeneic mesenchymal stem cells trafficking to myocardial infarction. Circulation. 2005;112(10):1451–1461. doi: 10.1161/CIRCULATIONAHA.105.537480. [DOI] [PMC free article] [PubMed] [Google Scholar]
- 5.Shah BS, Clark PA, Moioli EK, Stroscio MA, Mao JJ. Labeling of mesenchymal stem cells by bioconjugated quantum dots. Nano Lett. 2007;7(10):3071–3079. doi: 10.1021/nl071547f. [DOI] [PMC free article] [PubMed] [Google Scholar]
- 6.Chang E, Thekkek N, Yu WW, Colvin VL, Drezek R. Evaluation of quantum dot cytotoxicity based on intracellular uptake. Small. 2006;2(12):1412–1417. doi: 10.1002/smll.200600218. [DOI] [PubMed] [Google Scholar]
- 7.Hsiao JK, Tai MF, Chu HH, Chen ST, Li H, Lai DM, et al. Magnetic nanoparticle labeling of mesenchymal stem cells without transfection agent: cellular behavior and capability of detection with clinical 1.5 T magnetic resonance at the single cell level. Magn Reson Med. 2007;58(4):717–724. doi: 10.1002/mrm.21377. [DOI] [PubMed] [Google Scholar]
- 8.Sitharaman B, Tran LA, Pham QP, Bolskar RD, Muthupillai R, Flamm SD, et al. Gadofullerenes as nanoscale magnetic labels for cellular MRI. Contrast Media Mol Imaging. 2007;2(3):139–146. doi: 10.1002/cmmi.140. [DOI] [PubMed] [Google Scholar]
- 9.Song YS, Ku JH. Monitoring transplanted human mesenchymal stem cells in rat and rabbit bladders using molecular magnetic resonance imaging. Neurourol Urodyn. 2007;26(4):584–593. doi: 10.1002/nau.20351. [DOI] [PubMed] [Google Scholar]
- 10.Ferreira L, Karp JM, Nobre L, Langer R. New opportunities: the use of nanotechnologies to manipulate and track stem cells. Cell Stem Cell. 2008;3(2):136–146. doi: 10.1016/j.stem.2008.07.020. [DOI] [PubMed] [Google Scholar]
- 11.Shapiro EM, Sharer K, Skrtic S, Koretsky AP. In vivo detection of single cells by MRI. Magn Reson Med. 2006;55(2):242–249. doi: 10.1002/mrm.20718. [DOI] [PubMed] [Google Scholar]
- 12.Rogers WJ, Meyer CH, Kramer CM. Technology insight: in vivo cell tracking by use of MRI. Nat Clin Pract Cardiovasc Med. 2006;3(10):554–562. doi: 10.1038/ncpcardio0659. [DOI] [PubMed] [Google Scholar]
- 13.Hill JM, Dick AJ, Raman VK, Thompson RB, Yu ZX, Hinds KA, et al. Serial cardiac magnetic resonance imaging of injected mesenchymal stem cells. Circulation. 2003;108(8):1009–1014. doi: 10.1161/01.CIR.0000084537.66419.7A. [DOI] [PMC free article] [PubMed] [Google Scholar]
- 14.Hinds KA, Hill JM, Shapiro EM, Laukkanen MO, Silva AC, Combs CA, et al. Highly efficient endosomal labeling of progenitor and stem cells with large magnetic particles allows magnetic resonance imaging of single cells. Blood. 2003;102(3):867–872. doi: 10.1182/blood-2002-12-3669. [DOI] [PubMed] [Google Scholar]
- 15.Wang L, Neoh KG, Kang ET, Shuter B, Wang SC. Biodegradable magnetic-fluorescent magnetite/poly(dl-lactic acid-co-alpha,beta-malic acid) composite nanoparticles for stem cell labeling. Biomaterials. 2010;31(13):3502–3511. doi: 10.1016/j.biomaterials.2010.01.081. [DOI] [PubMed] [Google Scholar]
- 16.Wilhelm C, Gazeau F. Universal cell labelling with anionic magnetic nanoparticles. Biomaterials. 2008;29(22):3161–3174. doi: 10.1016/j.biomaterials.2008.04.016. [DOI] [PubMed] [Google Scholar]
- 17.Thorek DL, Tsourkas A. Size, charge and concentration dependent uptake of iron oxide particles by non-phagocytic cells. Biomaterials. 2008;29(26):3583–3590. doi: 10.1016/j.biomaterials.2008.05.015. [DOI] [PMC free article] [PubMed] [Google Scholar]
- 18.Tseng CL, Shih IL, Stobinski L, Lin FH. Gadolinium hexanedione nanoparticles for stem cell labeling and tracking via magnetic resonance imaging. Biomaterials. 2010;31:5427–5435. doi: 10.1016/j.biomaterials.2010.03.049. [DOI] [PubMed] [Google Scholar]
- 19.IMV 2007 MRI Market Summary Report. 2008 June; [cited 2010 April 28]; Available from: http://www.imvinfo.com/index.aspx?sec=mri&sub=dis&itemid=200085.
- 20.Brown MA, Semelka RC. MRI: Basic Principles and Applications. 2nd ed. John Wiley & Sons; New York: 1999. [Google Scholar]
- 21.Caravan P, Ellison JJ, McMurry TJ, Lauffer RB. Gadolinium(III) chelates as MRI contrast agents: Structure, dynamics, and applications. Chem Rev. 1999;99(9):2293–2352. doi: 10.1021/cr980440x. [DOI] [PubMed] [Google Scholar]
- 22.Caravan P. Physiochemical Principles of MR Contrast Agents. In: Modo MMJ, Bulte JWM, editors. Molecular and Cellular MR Imaging. CRC Press; Boca Raton: 2007. pp. 13–36. [Google Scholar]
- 23.Nunn AD, Linder KE, Tweedle MF. Can receptors be imaged with MRI agents? Q J Nucl Med. 1997;41(2):155–162. [PubMed] [Google Scholar]
- 24.Sitharaman B, Kissell KR, Hartman KB, Tran LA, Baikalov A, Rusakova I, et al. Superparamagnetic gadonanotubes are high-performance MRI contrast agents. Chem Commun. 2005;31:3915–3917. doi: 10.1039/b504435a. [DOI] [PubMed] [Google Scholar]
- 25.Hartman KB, Wilson LJ, Rosenblum MG. Detecting and treating cancer with nanotechnology. Mol Diagn Ther. 2008;12(1):1–14. doi: 10.1007/BF03256264. [DOI] [PubMed] [Google Scholar]
- 26.Hartman KB, Laus S, Bolskar RD, Muthupillai R, Helm L, Toth E, et al. Gadonanotubes as ultrasensitive pH-smart probes for magnetic resonance imaging. Nano Lett. 2008;8(2):415–419. doi: 10.1021/nl0720408. [DOI] [PubMed] [Google Scholar]
- 27.Hassan AA, Chan BT, Tran LA, Hartman KB, Ananta JS, Mackeyev Y, et al. Serine-derivatized gadonanotubes as magnetic nanoprobes for intracellular labeling. Contrast Media Mol Imaging. 2010;5(1):34–38. doi: 10.1002/cmmi.293. [DOI] [PubMed] [Google Scholar]
- 28.Gu Z, Peng H, Hauge RH, Smalley RE, Margrave JL. Cutting single-wall carbon nanotubes through fluorination. Nano Lett. 2002;2(9):1009–1013. [Google Scholar]
- 29.Ashcroft JM, Hartman KB, Mackeyev Y, Hofmann C, Pheasant S, Alemany LB, et al. Functionalization of individual ultra-short single-walled carbon nanotubes. Nanotechnology. 2006;(17):5033–5037. [Google Scholar]
- 30.Bosch P, Pratt SL, Stice SL. Isolation, characterization, gene modification, and nuclear reprogramming of porcine mesenchymal stem cells. Biol Reprod. 2006;74(1):46–57. doi: 10.1095/biolreprod.105.045138. [DOI] [PubMed] [Google Scholar]
- 31.Wiley HS, Herbst JJ, Walsh BJ, Lauffenburger DA, Rosenfeld MG, Gill GN. The role of tyrosine kinase activity in endocytosis, compartmentation, and down-regulation of the epidermal growth factor receptor. J Biol Chem. 1991;266(17):11083–11094. [PubMed] [Google Scholar]
- 32.Griffiths B. Scaling-Up of Animal Cell Cultures. Animal Cell Culture: A Practical Approach. Oxford University Press; Oxford: 2000. pp. 19–68. [Google Scholar]
- 33.Ito A, Hibino E, Honda H, Hata K, Kagami H, Ueda M, et al. A new methodology of mesenchymal stem cell expansion using magnetic nanoparticles. Biochem Eng J. 2004;20(2-3):119–125. [Google Scholar]
- 34.Pittenger MF, Martin BJ. Mesenchymal stem cells and their potential as cardiac therapeutics. Circ Res. 2004;95(1):9–20. doi: 10.1161/01.RES.0000135902.99383.6f. [DOI] [PubMed] [Google Scholar]
- 35.Leiss M, Beckmann K, Giros A, Costell M, Fassler R. The role of integrin binding sites in fibronectin matrix assembly in vivo. Curr Opin Cell Biol. 2008;20(5):502–507. doi: 10.1016/j.ceb.2008.06.001. [DOI] [PubMed] [Google Scholar]
- 36.Heino J. The collagen family members as cell adhesion proteins. Bioessays. 2007;29(10):1001–1010. doi: 10.1002/bies.20636. [DOI] [PubMed] [Google Scholar]
- 37.Liu VA, Jastromb WE, Bhatia SN. Engineering protein and cell adhesivity using PEO-terminated triblock polymers. J Biomed Mater Res. 2002;60(1):126–134. doi: 10.1002/jbm.10005. [DOI] [PubMed] [Google Scholar]
- 38.Corey JM, Gertz CC, Sutton TJ, Chen Q, Mycek KB, Wang BS, et al. Patterning N-type and S-type neuroblastoma cells with Pluronic F108 and ECM proteins. J Biomed Mater Res A. 2010;93(2):673–686. doi: 10.1002/jbm.a.32485. [DOI] [PMC free article] [PubMed] [Google Scholar]
- 39.Perin EC, Silva GV, Assad JA, Vela D, Buja LM, Sousa AL, et al. Comparison of intracoronary and transendocardial delivery of allogeneic mesenchymal cells in a canine model of acute myocardial infarction. J Mol Cell Cardiol. 2008;44(3):486–495. doi: 10.1016/j.yjmcc.2007.09.012. [DOI] [PubMed] [Google Scholar]
Associated Data
This section collects any data citations, data availability statements, or supplementary materials included in this article.


