

Abstract
Empirical evidences suggest that both common and rare variants contribute to complex disease etiology. Although the effects of common variants have been thoroughly assessed in recent genome-wide association studies (GWAS), our knowledge of the impact of rare variants on complex diseases remains limited. A number of methods have been proposed to test for rare variant association in sequencing-based studies, a study design that is becoming popular but is still not economically feasible. On the contrary, few (if any) methods exist to detect rare variants in GWAS data, the data we have collected on thousands of individuals. Here we propose two methods, a weighted haplotype-based approach and an imputation-based approach, to test for the effect of rare variants with GWAS data. Both methods can incorporate external sequencing data when available. We evaluated our methods and compared them with methods proposed in the sequencing setting through extensive simulations. Our methods clearly show enhanced statistical power over existing methods for a wide range of population-attributable risk, percentage of disease-contributing rare variants, and proportion of rare alleles working in different directions. We also applied our methods to the IFIH1 region for the type 1 diabetes GWAS data collected by the Wellcome Trust Case-Control Consortium. Our methods yield p values in the order of 10−3, whereas the most significant p value from the existing methods is greater than 0.17. We thus demonstrate that the evaluation of rare variants with GWAS data is possible, particularly when public sequencing data are incorporated.
Main Text
Recent studies suggest that rare variants play an important role in the etiology of complex traits,1,2 revealing that rare variants generally have larger genetic effects than common variants.3–6 There is also evidence that multiple rare variants together influence the risk of complex diseases, making it sensible to combine information across them. Although there is a lingering debate over the two schools of hypothesis for the genetics underlying complex traits, namely common disease common variants and common disease rare variants, the community has now gradually reached a consensus that both common and rare variants contribute to the underlying genetic mechanism.7
However, unlike common variants, whose impact on human diseases has been thoroughly evaluated in the recent wave of genome-wide association studies (GWAS), rare variants are largely waiting for the evaluation of their impact. Rare variants are attracting increasing attention from researchers for two major reasons. First, common variants identified through GWAS only explain a small proportion of the overall heritability, and rare variants hold the promise to explain some of the missing heritability.8–10 Second, massively parallel sequencing technologies have made it feasible to search after rare variants.2,11
In preparation for the coming wave of sequencing-based studies, a number of methods have been proposed to test for the effect of rare variants in aggregate.12–18 However, whole-genome sequencing is still cost prohibitive, and only a few groups can afford to sequence a relatively small number of samples, limiting the statistical power to detect association. On the other hand, little, if any, attention has been given to GWAS data for the evaluation of rare variants. There are good reasons for the lack of methods targeting at GWAS data. Analysis of directly assayed rare variants is challenging statistically because methods developed for common variants are underpowered. Commercial genotyping panels employed by GWAS were designed to cover most of the common variants but have poor coverage of rare variants, making the analysis even more challenging. Now, with the publicly available data from the 1000 Genomes Project being rapidly generated and released,19,20 an attempt to detect rare variants with GWAS data is worthy and holds promise before study-specific sequencing data become widely available. We note that, with GWAS data alone, extremely rare variants (for example, singletons or study population private variants) still cannot be evaluated. Our focus is on the analysis of variants in the frequency range of 0.1%–5%, which have not been adequately assessed in GWAS but can be better captured either by haplotyping or with the aid of external sequencing data by multimarker imputation.21–23
Here we propose two methods to search for the aggregated effect of rare variants with GWAS data. Our approaches do not rely on the availability of external sequencing data, but they can incorporate such information when available. Moreover, our methods make no assumption on the direction of association of rare alleles with disease risk. We applied our methods, along with existing methods proposed in the sequencing context, to simulated data sets. Our methods demonstrated better performance across a wide range of scenarios with an average power improvement of 8.6% (31.6%) in the absence (presence) of external sequencing data. We also applied our methods to the Wellcome Trust Case-Control Consortium (WTCCC) type 1 diabetes (T1D [MIM 222100]) GWAS data set in the IFIH1 (MIM 606951) gene region, where both common and multiple rare variants have been found to influence the risk of T1D.2,24,25
Our first test is a weighted haplotype test. Assume a sample of N diploid individuals is collected, among which Ncs are affected cases and Nct are unaffected controls. Let m denote the number of genotyped markers in a region of interest. Further denote haplotypes of the N individuals by H = (H1, H2, …, Hi, …, HN)t, where Hi = {Hi,1, Hi,2} are the two haplotypes carried by the ith individual, consisting of the m markers in the region. For each individual i, we define a weighted haplotype score as follows:
in which the sum is taken over the two haplotypes of individual i. Wh stands for the weight of haplotype h and is defined as
in which C is the set of disease-contributing haplotypes including both risk and protective haplotypes, P is the set of disease-protective haplotypes (note that P is a subset of C), and Sh is a score assigned to haplotype h. Following the weighting scheme proposed by Madsen and Browning13 for SNPs, we define Sh as
in which fct,h denotes the adjusted frequency of haplotype h among controls and is defined as
in which Cct,h is the number of haplotype h among controls. The rationale of using such a score is that a rare variant (most likely untyped in GWAS) is more likely to be tagged by a rare haplotype than by a common haplotype, and thus rare haplotypes should receive more weight in the analysis.
To define the sets of the disease-contributing and disease-protective haplotypes, we first split the data into a testing set and a training set and then compared the haplotype frequencies between cases and controls in the training set according to the formula below:
| (Equation 1) |
with tr standing for the training set. Here, μ is a constant that is determined by a prespecified type I error rate. For example, μ = 1.28 (1.64) corresponds to a type I error of 0.2 (0.1). Following Zhu et al.,14 we set μ = 1.28 and randomly selected 30% of the samples for training in the analysis.
We note that by explicitly modeling the two sets of haplotypes as described above, we do not need to make assumptions about the direction of association between rare alleles and disease risk. Weighted haplotype scores are calculated in the testing set after identifying the two sets of haplotypes with the training set. To assess whether the rare variants are significantly associated with the disease, we can perform a standard Wilcoxon26 test on the weighted haplotype scores and assess the significance of the test by permutations. For each permuted data set, the training set and the testing set will be obtained in a similar fashion as the original data set.
Because typical GWAS data consist of genotypes rather than haplotypes, we need to infer haplotypes from unphased genotypes. This step can be done via standard phasing methods, including PHASE, fastPHASE, MaCH, and Beagle.22,27–29 We used MaCH, which allows the incorporation of external genotyping, haplotyping, or sequencing data. Our weighted haplotype approach can be applied to haplotypes consisting of GWAS markers alone or to haplotypes including additional markers via incorporation of external reference data.
Our second test is a weighted imputation dosage test. Following the notations defined above, we assume that there are a total of M markers genotyped or sequenced after the incorporation of one or more external data sets (e.g., the International HapMap Project30,31 or the 1000 Genomes Project19). We have previously described a hidden Markov model-based method that imputes untyped markers in study samples by exploiting external data as reference, which was implemented in software MaCH and has become standard in GWAS analysis.32 Let D = (D1, D2, …, Di, …, DN)t denote the dosage matrices across M markers for the N study subjects, in which Di = (Di,1, Di,2, …, Di,j, …, Di,M) denotes the dosages of the ith individual. Here Dij is the dosage for the ith individual at marker j, which is defined as the expected number of the rare allele at marker j. Now we define the weighted dosage score for each individual i as
in which the summation is taken over all M markers with genotype dosage scores. Here MC is the set of markers with the rare allele that contributes to disease risk, and MP is the set of markers with the rare allele that decreases disease risk. We define these two sets by examining frequency difference between cases and controls, similar to Equation 1 for the weighted haplotype test. After obtaining the scores, the standard Wilcoxon test is applied to test for association with the disease, and its significance is assessed via permutation.
We compared our proposed methods with the following three methods proposed in the sequencing context. (1) Weighted SNP Test (denoted by WS)13 is a weighted-sum method in which rare alleles are aggregated and weighted according to a function of minor allele frequency among controls. Despite the fact that the method was proposed as a test for “rare mutations,” it indeed sums over all markers by giving smaller weight to alleles with higher frequency. Although an omnibus regional-based test that evaluates both common and rare variants is sometimes desired, here we are interested in a regional-based test for rare variants only, assuming that common variants have been thoroughly evaluated by large-scale GWAS. Because of this, we compared our methods with both the originally proposed test (denoted by WSall) and a modified version of it (denoted by WSrare), in which only markers with minor allele frequency (MAF) < 5% are included. (2) Zhu and colleagues proposed a haplotype grouping method (denoted by HG)14 that counts the number of rare risky haplotypes for each individual and uses a Fisher's exact test for testing. (3) We also applied the rare variant collapsing method (denoted by RVC) proposed by Li and Leal,12 which groups each individual into one of two groups: carrying any rare allele or not. Together with case-control status, a 2 × 2 table is generated, and a standard test for contingency table (e.g., chi-square test for independence) is applied. Table 1 lists the above-described tests and their abbreviations.
Table 1.
Abbreviation and Description of Tests Applied
| Test Abbreviation | Description |
|---|---|
| WDS | Weighted dosage test on genotyped plus imputed SNPs with external sequencing data |
| WHS | Weighted haplotype test on genotyped plus imputed SNPs with external sequencing data |
| WHG | Weighted haplotype test on genotyped SNPs only |
| HG | Haplotype grouping test proposed by Zhu et al.14 |
| WSall | Original weighted SNP test aggregating evidence over all (regardless of MAF) SNPs proposed by Madsen and Browning13 |
| WSrare | Modified weighted SNP test aggregating evidence over rare (MAF < 5%) SNPs only |
| RVC | Rare variant collapsing method proposed by Li and Leal12 |
We simulated 10,000 chromosomes for a series of 100 1 Mb regions with a coalescent model that mimics linkage disequilibrium (LD) in real data, accounts for variations in local recombination rates, and models population history, consistent with the HapMap CEU (CEPH people from Utah, USA) samples.33 We then took a random subset of 1000 simulated chromosomes (i.e., 500 individuals) to serve as the external reference, mimicking the targeting sample size for the 1000 Genomes Project. To generate a set of GWAS markers in each region, we first randomly picked 120 chromosomes, mimicking Phase II HapMap CEU data. We then ascertained and thinned polymorphic sites to match marker density and allele frequency spectrum of their real-data counterparts. Based on LD measures calculated with the 120 chromosomes, we selected a set of 100 SNPs for each region that included 90 tagSNPs tagging the largest number of SNPs and 10 additional SNPs picked at random among the remaining SNPs. The final set of retained SNPs (GWAS markers in the region) captured ∼78% of the common variants (MAF > 5%) at a conventional r2 cutoff of 0.8, similar to the real-data performance of the Illumina HumanHap300 BeadChip SNP genotyping platform.
Within each simulated 1 Mb region, we picked an ∼50 kb region as the causal region in which we assume only rare variants (variants with population MAF between 0.1% and 5%) contribute to the disease risk. We randomly selected d% of the rare variants in the causal region to be causal, i.e., to influence disease risk. Among these rare variants, we further assume that r% of them increase disease risk, whereas the remaining (100 – r)% decrease disease risk. To ensure that each variant only has a small contribution to the overall disease risk, we followed a model similar to that proposed by Madsen and Browning.13 Specifically, the contribution of each causal variant j to the overall genotype relative risk (GRR) is defined as
in which PAR is the population attributable risk and indicates that the rare allele of marker j decreases disease risk. Following Madsen and Browning,13 we used the same marginal PAR for each causal variant, which intrinsically assumes that alleles with lower frequency have higher GRR than alleles with higher frequency. In our 50 kb core region, there are ∼500 SNPs with MAF < 5%; the distributions of MAFs and GRRs (without loss of generality, assuming all rare alleles increase disease risk) are shown in Figure S1 available online.
To generate the chromosomes for an individual, we randomly selected two chromosomes {H1, H2} from the remaining 9000 chromosomes that were not selected as external reference. The disease status of the individual was assigned according to
in which is the baseline penetrance and was fixed at 10% in our simulations (1% and 5% were also evaluated and resulted in similar patterns but with slight power loss), mc is the number of causal SNPs, and aj is the rare allele of SNP j. Sampling was repeated until the desired number of cases and controls was reached. In our simulations, d took values from 10% to 50% by an increment of 10%. Among the disease risk influencing loci, we set the value of r, the percentage of rare alleles increasing disease risk, at 5%, 20%, 50%, 80%, and 100%, respectively.
For each of the 100 regions, two independent data sets with 1000 cases and 1000 controls were simulated with the model described above. In addition, five independent null data sets of the same sample size were simulated, assuming no genetic effect by randomly sampling 4000 chromosomes (i.e., 2000 individuals) from the pool of 9000 chromosomes. Average power was estimated based on the 100 regions, which represent a wide range of LD patterns. To account for local LD differences, we permuted each of the null sets 200 times to obtain region-specific empirical significant threshold. For the weighted haplotype analysis, we considered two versions: WHG, which uses haplotypes consisting of GWAS SNPs only, and WHS, which uses haplotypes encompassing both genotyped and imputed SNPs. For both the weighted haplotype tests and the weighted dosage test, untyped SNPs with Rsq (estimated imputation quality) < 0.3 were discarded from subsequent analysis.22 In all analyses, we used haplotypes reconstructed from the unphased genotypes and imputed genotypes for markers that are not included on the GWAS chip. Our methods (WHG, WHS, and WDS), together with WSall, WSrare, HG, and RVC, were applied to the 1000 null data sets within each region to determine the region-specific empirical significance threshold, ensuring the correct type I error rate of 0.05 for all tests.
Figure 1 shows the empirical power of our methods relative to the other four methods proposed in the sequencing context as a function of r, the proportion of rare alleles increasing disease risk, which ranges from 5% to 100%. We fixed PAR at 0.5% and d (percent of disease-influencing rare variants) at 50%. Although the synergy assumption is more reasonable for rarer alleles than for common alleles because rarer alleles tend to disrupt gene function, our knowledge regarding the direction of rarer alleles is still limited. Therefore, methods robust to such an assumption are desirable. Although all methods have decreased power when rare alleles work in different directions, our methods performed better by explicitly modeling the direction of association. For example, compared with the haplotype grouping (HG) method, the advantage of our weighted haplotype method (WHG, on GWAS SNPs only without the aid of external sequencing data) manifests more when a larger proportion of the rare alleles is protective: power gain is 9.1% when all of the rare alleles at disease-contributing loci increase disease risk, and the power gain increases to 20.7% when only 5% of the rare alleles increase disease risk.
Figure 1.
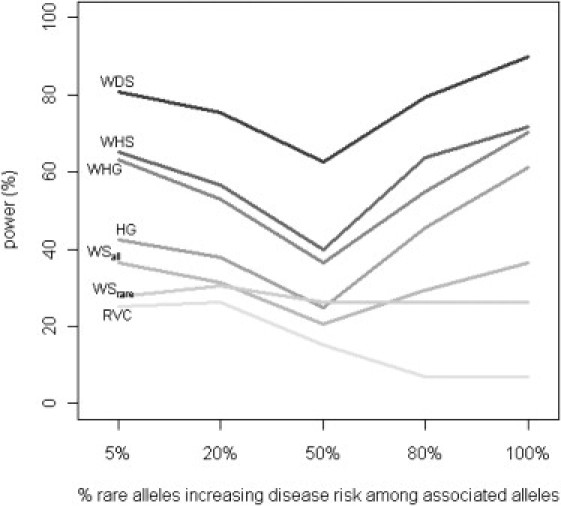
Comparison of Power by r, Percent of Rare Alleles in the Causal Region that Increase Disease Risk
Power of all tests was assessed at the 5% level by using empirical significance threshold determined by 1000 null data sets per region. 50% of the rare alleles in the causal region were assumed to contribute to disease risk (i.e., d fixed at 50%), and the PAR of each contributing SNP was fixed at 0.5%.
Our proposed tests increase power through two different mechanisms: by using haplotypes to better capture information for rare variants (mostly untyped in GWAS) and by using external sequencing data to impute rare variants. Let us consider the first mechanism by examining tests on GWAS data alone, namely WHG, HG, WSall, WSrare, and RVC. At GWAS level, haplotype-based methods clearly manifest their advantages. Among the five methods, the two haplotype-based methods (WHG and HG) rank as the best two across the five scenarios presented in Figure 1. Note that WSall and WSrare can be viewed as special cases of WDS, where the dosages only take values 0, 1, or 2 at directly genotyped markers. Therefore, at the GWAS level, haplotype-based methods are preferred over single-marker dosage-based tests. This is because causal rare variants are better captured by haplotypes constructed from GWAS SNPs than by those SNPs themselves. Between the two haplotype-based methods, our weighted haplotype method (WHG) increases power by an average of 13.2% over HG by weighting individual haplotypes (instead of lumping them together into groups) and by explicitly modeling the direction of association.
Next we consider the second mechanism by looking at tests that incorporate external sequencing data, namely WHS and WDS. Both are more powerful than WHG, the best test based on GWAS data alone. The average power gain of WHS and WDS over WHG is 3.8% and 22.0%, respectively. At this pseudosequencing level (i.e., study subjects imputed with SNPs of sequencing density), a single-marker dosage-based test is more powerful than haplotype-based methods. This is not surprising because, at the pseudosequencing level, causal rare variants are better captured by their imputed counterpart than by haplotypes. The same applies to data at the sequencing level (i.e., when study subjects are directly sequenced). Of course, if there are genuine haplotype effects, we anticipate that WHS will perform better. To quantify the extent of better performance, we need more empirical data on the distribution of genuine haplotype effects, which is beyond the scope of this paper. Currently, we have little evidence even to convincingly conclude the presence of genuine haplotype effects. Therefore, with the presence of external sequencing data and under the assumption that single variants cumulatively contribute to disease risk, we recommend WDS over WHS.
Figure 2 and Figure 3 show the power of different tests under situations with varying PAR and varying percentage of disease-contributing rare variants. We fixed the value of d (percentage of rare alleles influencing disease risk) at 100%. The value of r (percent of causal alleles increasing disease risk) was fixed at 50% for Figure 2, and the per SNP PAR was fixed at 0.5% for Figure 3. Although the power decreases with decreasing PAR or decreasing percentage of disease-contributing variants for all methods, our WHG and WHS are comparable, if not slightly better, than other alternatives, and our WDS is more powerful than the other methods by utilizing sequencing information from external data and explicitly modeling the SNP-level dosages.
Figure 2.
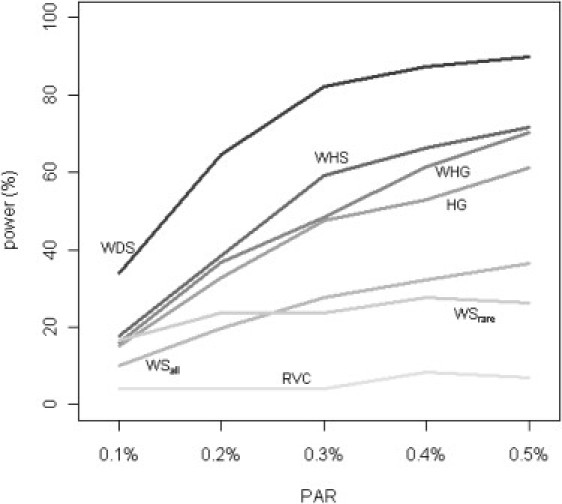
Comparison of Power by PAR
Power of all tests was assessed at the 5% level by using empirical significance threshold determined by 1000 null data sets per region. 50% of the rare alleles in the causal region were assumed to contribute to disease risk (i.e., d fixed at 50%), and all contributing rare alleles were assumed to increase disease risk (i.e., r fixed at 100%).
Figure 3.
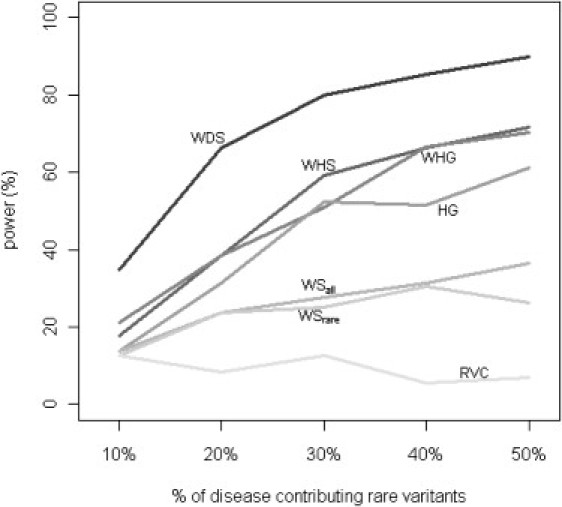
Comparison of Power by d, Percent of Disease-Contributing Rare Variants
Power of all tests was assessed at the 5% level by using empirical significance threshold determined by 1000 null data sets per region. All rare alleles in the causal region were assumed to increase disease risk (i.e., r fixed at 100%), and the PAR of each contributing SNP was fixed at 0.5%.
We note that tests on rare GWAS SNPs only (WSrare and RVC) are less powerful in general, because at GWAS marker density, a typical gene region may contain few, if any, directly genotyped rare variants. In our simulations, 64 out of the 100 regions have no rare variants within the ∼50 kb core causal regions. These tests, proposed in the sequencing context, are thus not suitable for analyzing GWAS data.
Encouraged by results from simulations, we applied our methods to real data. Multiple common and rare variants in IFIH1, a cytoplasmic helicase that mediates induction of interferon response to viral RNA, have been established to influence risk of T1D. In particular, variants disrupting IFIH1 function have been suggested to confer protection from T1D.2 We took the WTCCC T1D data to search for rare variants associated with T1D susceptibility. In the WTCCC GWAS data set, 10 SNPs were found in the IFIH1 region, with four being monomorphic in both the T1D set and the two control sets (NBS and 58C), leaving six SNPs for analysis. These six SNPs and their allele frequencies among cases and controls are tabulated in Table 2. We applied our methods, along with the others, to this data set. Because the common SNP rs1990760 (MAF > 30%) in IFIH1 has been found to influence T1D risk,24,25 we restricted our analysis to SNPs or haplotypes with frequency < 5% to rule out signals due to LD with rs1990760. Our goal is to assess whether there is any residual association with T1D because of rare variants, which have been ignored in the previous GWAS analysis. We used the March 2010 release of 60 CEU individuals from the 1000 Genomes Project as reference for imputation. We used SNPs in the ∼50 kb IFIH1 gene region plus 2 Mb flanking on each side for phasing and imputation. Again, we discarded imputed SNPs with Rsq < 0.3. For the haplotype grouping method, the original test failed in this data set because rare alleles in IFIH1 are associated with decreased risk of T1D. P values based on 100,000 permutations are shown in Table 3. The p values from our methods are in the order of 10−3, whereas the most significant p value from existing methods is >0.17. This example clearly demonstrates the importance of using appropriate methods when searching for the effect of rare variants with GWAS data.
Table 2.
Allele Frequencies of the Six Polymorphic SNPs in IFIH1
| SNP | 58C | NBS | T1D |
|---|---|---|---|
| rs3747517 | 27.66% | 26.31% | 24.16% |
| rs41463049 | 1.12% | 1.06% | 1.02% |
| rs6432714 | 1.18% | 1.06% | 1.02% |
| rs13023380 | 48.88% | 47.46% | 45.24% |
| rs7559103 | 0.17% | 0.10% | 0.00% |
| rs12479125 | 1.18% | 1.06% | 1.02% |
Table 3.
Permutation p Values, Based on 100,000 Permutations, for the Association of Rare Variants in IFIH1 with T1D Risk in WTCCC Data Set
| Test | p Value |
|---|---|
| WDS | 0.00431 |
| WHS | 0.00738 |
| WHG | 0.00746 |
| HG | 1.000 |
| WSrare | 0.329 |
| RVC | 0.179 |
In summary, we have proposed two tests to assess the impact of multiple rare variants on disease risk. We show through simulations and a real-data example that by maximally extracting information from GWAS data, as well as the incorporation of publicly available sequencing data, our methods provide an intermediate solution for the analysis of rare variants before study-specific sequencing data become available. Our results suggest that at the GWAS level, haplotype-based methods are more powerful, but at the pseudosequencing level (i.e., GWAS data imputed with publicly available sequencing data), a test based on weighted sum of single-marker dosages is more powerful.
By assuming that we know the 50 kb causal region a priori, we may have overestimated the power in the simulations. We thus repeated the experiment by extending the test region to 100 kb (25 kb flanking region on either side of the core region) and to 200 kb (75 kb flanking on either side) to mimic the lack of knowledge on the lengths of regulatory regions flanking a gene or an exon. We found that the power difference is within 2%. In most situations, power was slightly lower, but in a few situations, power was slightly higher, because some variants in the noncausal flanking region happen to tag the causal variants better because of LD. These results are not surprising, because our methods can eliminate irrelevant SNPs or haplotypes by comparing frequency differences between cases and controls in the training data set.
The analysis of rare variants with GWAS data is challenging because of several reasons. First, SNPs picked by the commonly used GWAS genotyping platforms have poor coverage for rare variants in general. Second, we have no catalog of rare variants in our genome, and our knowledge regarding their impact on phenotypic variations is still limited. Third, traditional association tests are suitable for the analysis of common variants but are generally underpowered for the analysis of rare variants. By utilizing LD information and incorporating publicly available sequencing data, we show that hunting for rare variants with GWAS data is possible.
Our methods are proposed for GWAS data, which are still the most commonly available type of data for gene mapping studies. In both our simulations and the real data analysis of T1D with gene IFIH1, we only have GWAS data on the study subjects. We compared our methods with alternatives proposed for sequencing data and demonstrated that methods that are specifically targeted for the analysis of rare variants in GWAS settings such as ours perform much better than methods that are developed for sequencing data. We note that our targeted “rare” variants (MAF 0.1%–5%) differ from those in methods developed in the sequencing context (including extremely rare variants with MAF < 0.5% or 0.1%). For extremely rare variants (MAF < 0.5%), our methods are expected to have low power because of low phasing and imputation quality with GWAS data. Although our methods are proposed for GWAS data, they can be applied directly to sequence data or to partially sequenced data in which selected individuals under study are sequenced. Therefore, our methods provide a useful alternative but are not meant to replace existing methods, given fundamental differences in their targeted data type (GWAS versus sequencing) and targeted MAF range. Because the performance of our weighted imputation dosage test depends critically on the imputation quality of rare variants (MAF < 5%), we decided to evaluate the quality in real data from the FUSION project34 by masking and imputing all rare variants in a subset of individuals with constructed haplotypes encompassing both common and rare variants from an independent set of FUSION individuals (of varying sizes) as reference. We found that imputation quality for rare variants improves when the sample size in the reference panel increases. For example, the accuracy among the heterozygotes (r2) increases from 83.4% (74.3%) to 97.0% (92.9%) when the number of reference haplotypes increases from 60 to 1000 (Figure S2).
Our methods and others evaluated in this study were developed for the analysis of rare variants, but we have found that inclusion of common variants can increase the power (data not shown). This is demonstrated by the superior performance of WSall (test that includes all variants) over WSrare (test that only includes rare variants), even though only rare variants that contribute to disease risk were included in our simulations. This is not entirely surprising, because common variants or haplotypes can carry some information of untyped rare variants. One major issue of including common variants in testing is misclassification, that is, inclusion of variants that do not contribute to disease risk. However, by searching for frequency difference in a training set, our methods can alleviate this misclassification issue. In general, we recommend testing common variants first, for instance, via standard single-marker test. If there is no evidence of association with common variants, we then search the entire MAF space for the effect of rare variants. When common variants are found to be associated (such as in the IFIH1 example), we should restrict our attention to rare variants or haplotypes only to alleviate the residual effects of common variants.
Both of our tests assess the effect of multiple variants in aggregate in a predefined genomic region, typically a known gene annotated by RefSeq or other gene annotations. For real-life GWAS data, we recommend performing the tests for all known genes if no prior knowledge exists or for a list of one or more candidate genes in the presence of such knowledge. We note that the weighted dosage-based test is more flexible than the haplotype-based test in that it can be used to test for an arbitrary set of SNPs (for example, nonsynonymous rare SNPs in a pathway), which may involve SNPs on different chromosomes.
One issue with the haplotype-based test is that the haplotypes are not known but instead are inferred with uncertainty. Fortunately, most phasing methods, including PHASE and MaCH, can estimate the probabilities of possible haplotype configurations for each individual in addition to providing the best-guess haplotypes. With these estimates, we can easily model the phasing uncertainty into our weighted haplotype test by allowing possible haplotype configurations of each individual to contribute to the haplotype frequency estimates, as well as to the weighted haplotype score, according to their estimated probabilities. An alternative approach is to perform multiple imputation on 5–10 imputed data sets.35 Note that each imputed data set has to be drawn from a different posterior distribution to ensure proper multiple imputation. This can be achieved either by imputing from different reference sets (for example, from bootstrap samples of the HapMap or 1000 Genomes reference set) or by drawing from different iteration in a full Bayesian framework in which the model parameters are also updated in each iteration. Neither approach had noticeable impact on the IFIH1 real data set, but further work is warranted.
Both of our proposed tests can be extended to analyze quantitative traits and to accommodate covariates. Both of our tests, in a nutshell, derive one “genetic score” for each individual and assess the association between the genetic score and phenotype of interest. The genetic score is a weighted sum of contributing SNP dosages or haplotypes. Although the weights are defined for dichotomous trait in this work, we can easily extend the work to quantitative traits by first estimating the weights, for the very simple example, via regression, then deriving the genetic score accordingly, and finally performing the association testing. In the above general setting, covariates can be conveniently incorporated.
Acknowledgments
We thank Mike Boehnke, Karen Mohlke, Laura Scott, and Ethan Lange for helpful discussions. We also thank the FUSION and WTCCC research teams for providing their GWAS data. Y.L. is partially supported by DK078150 and CA082659. M.L. is supported by R01HG004517 and R01HG005854.
Supplemental Data
Web Resources
The URLs for data presented herein are as follows:
1000 Genomes Project, http://www.1000genomes.org/
1000 Genomes Reference March 2010 Release Original Data, ftp://ftp.1000genomes.ebi.ac.uk/vol1/ftp/pilot_data/release/2010_03/pilot1/
1000 Genomes Reference March 2010 Release MaCH Format Data, http://www.sph.umich.edu/csg/abecasis/mach/download/
MaCH: Markov Chain-Based Haplotyper, http://www.sph.umich.edu/csg/abecasis/mach/
Online Mendelian Inheritance in Man (OMIM), http://www.ncbi.nlm.nih.gov/Omim/
The International HapMap Project, http://hapmap.ncbi.nlm.nih.gov/
WHaIT: Weighted Haplotype and Imputation-Based Test, http://www.sph.umich.edu/csg/yli/whait/
References
- 1.Cohen J.C., Kiss R.S., Pertsemlidis A., Marcel Y.L., McPherson R., Hobbs H.H. Multiple rare alleles contribute to low plasma levels of HDL cholesterol. Science. 2004;305:869–872. doi: 10.1126/science.1099870. [DOI] [PubMed] [Google Scholar]
- 2.Nejentsev S., Walker N., Riches D., Egholm M., Todd J.A. Rare variants of IFIH1, a gene implicated in antiviral responses, protect against type 1 diabetes. Science. 2009;324:387–389. doi: 10.1126/science.1167728. [DOI] [PMC free article] [PubMed] [Google Scholar]
- 3.Pritchard J.K. Are rare variants responsible for susceptibility to complex diseases? Am. J. Hum. Genet. 2001;69:124–137. doi: 10.1086/321272. [DOI] [PMC free article] [PubMed] [Google Scholar]
- 4.Pritchard J.K., Cox N.J. The allelic architecture of human disease genes: Common disease-common variant…or not? Hum. Mol. Genet. 2002;11:2417–2423. doi: 10.1093/hmg/11.20.2417. [DOI] [PubMed] [Google Scholar]
- 5.Kryukov G.V., Pennacchio L.A., Sunyaev S.R. Most rare missense alleles are deleterious in humans: Implications for complex disease and association studies. Am. J. Hum. Genet. 2007;80:727–739. doi: 10.1086/513473. [DOI] [PMC free article] [PubMed] [Google Scholar]
- 6.Frazer K.A., Murray S.S., Schork N.J., Topol E.J. Human genetic variation and its contribution to complex traits. Nat. Rev. Genet. 2009;10:241–251. doi: 10.1038/nrg2554. [DOI] [PubMed] [Google Scholar]
- 7.Schork N.J., Murray S.S., Frazer K.A., Topol E.J. Common vs. rare allele hypotheses for complex diseases. Curr. Opin. Genet. Dev. 2009;19:212–219. doi: 10.1016/j.gde.2009.04.010. [DOI] [PMC free article] [PubMed] [Google Scholar]
- 8.Gibson G. Hints of hidden heritability in GWAS. Nat. Genet. 2010;42:558–560. doi: 10.1038/ng0710-558. [DOI] [PubMed] [Google Scholar]
- 9.Manolio T.A., Collins F.S., Cox N.J., Goldstein D.B., Hindorff L.A., Hunter D.J., McCarthy M.I., Ramos E.M., Cardon L.R., Chakravarti A. Finding the missing heritability of complex diseases. Nature. 2009;461:747–753. doi: 10.1038/nature08494. [DOI] [PMC free article] [PubMed] [Google Scholar]
- 10.Maher B. Personal genomes: The case of the missing heritability. Nature. 2008;456:18–21. doi: 10.1038/456018a. [DOI] [PubMed] [Google Scholar]
- 11.Shendure J., Ji H.L. Next-generation DNA sequencing. Nat. Biotechnol. 2008;26:1135–1145. doi: 10.1038/nbt1486. [DOI] [PubMed] [Google Scholar]
- 12.Li B.S., Leal S.M. Methods for detecting associations with rare variants for common diseases: Application to analysis of sequence data. Am. J. Hum. Genet. 2008;83:311–321. doi: 10.1016/j.ajhg.2008.06.024. [DOI] [PMC free article] [PubMed] [Google Scholar]
- 13.Madsen B.E., Browning S.R. A groupwise association test for rare mutations using a weighted sum statistic. PLoS Genet. 2009;5:e1000384. doi: 10.1371/journal.pgen.1000384. [DOI] [PMC free article] [PubMed] [Google Scholar]
- 14.Zhu X.F., Feng T., Li Y.L., Lu Q., Elston R.C. Detecting rare variants for complex traits using family and unrelated data. Genet. Epidemiol. 2010;34:171–187. doi: 10.1002/gepi.20449. [DOI] [PMC free article] [PubMed] [Google Scholar]
- 15.Morris A.P., Zeggini E. An evaluation of statistical approaches to rare variant analysis in genetic association studies. Genet. Epidemiol. 2010;34:188–193. doi: 10.1002/gepi.20450. [DOI] [PMC free article] [PubMed] [Google Scholar]
- 16.Li Q., Zhang H., Yu K. Approaches for evaluating rare polymorphisms in genetic association studies. Hum. Hered. 2010;69:219–228. doi: 10.1159/000291927. [DOI] [PMC free article] [PubMed] [Google Scholar]
- 17.Han F., Pan W. A data-adaptive sum test for disease association with multiple common or rare variants. Hum. Hered. 2010;70:42–54. doi: 10.1159/000288704. [DOI] [PMC free article] [PubMed] [Google Scholar]
- 18.Price A.L., Kryukov G.V., de Bakker P.I., Purcell S.M., Staples J., Wei L.J., Sunyaev S.R. Pooled association tests for rare variants in exon-resequencing studies. Am. J. Hum. Genet. 2010;86:832–838. doi: 10.1016/j.ajhg.2010.04.005. [DOI] [PMC free article] [PubMed] [Google Scholar]
- 19.Kaiser J. DNA sequencing. A plan to capture human diversity in 1000 genomes. Science. 2008;319:395. doi: 10.1126/science.319.5862.395. [DOI] [PubMed] [Google Scholar]
- 20.The 1000 Genomes Project A map of human genome variation from population scale sequencing. Nature. 2010;467:1061–1073. doi: 10.1038/nature09534. [DOI] [PMC free article] [PubMed] [Google Scholar]
- 21.Pe'er I., de Bakker P.I., Maller J., Yelensky R., Altshuler D., Daly M.J. Evaluating and improving power in whole-genome association studies using fixed marker sets. Nat. Genet. 2006;38:663–667. doi: 10.1038/ng1816. [DOI] [PubMed] [Google Scholar]
- 22.Li Y., Willer C., Sanna S., Abecasis G. Genotype imputation. Annu. Rev. Genomics Hum. Genet. 2009;10:387–406. doi: 10.1146/annurev.genom.9.081307.164242. [DOI] [PMC free article] [PubMed] [Google Scholar]
- 23.Marchini J., Howie B. Genotype imputation for genome-wide association studies. Nat. Rev. Genet. 2010;11:499–511. doi: 10.1038/nrg2796. [DOI] [PubMed] [Google Scholar]
- 24.Barrett J.C., Clayton D.G., Concannon P., Akolkar B., Cooper J.D., Erlich H.A., Julier C., Morahan G., Nerup J., Nierras C., Type 1 Diabetes Genetics Consortium Genome-wide association study and meta-analysis find that over 40 loci affect risk of type 1 diabetes. Nat. Genet. 2009;41:703–707. doi: 10.1038/ng.381. [DOI] [PMC free article] [PubMed] [Google Scholar]
- 25.Smyth D.J., Cooper J.D., Bailey R., Field S., Burren O., Smink L.J., Guja C., Ionescu-Tirgoviste C., Widmer B., Dunger D.B. A genome-wide association study of nonsynonymous SNPs identifies a type 1 diabetes locus in the interferon-induced helicase (IFIH1) region. Nat. Genet. 2006;38:617–619. doi: 10.1038/ng1800. [DOI] [PubMed] [Google Scholar]
- 26.Wilcoxon F. Individual comparisons by ranking methods. Biom. Bull. 1945;1:80–83. [Google Scholar]
- 27.Stephens M., Scheet P. Accounting for decay of linkage disequilibrium in haplotype inference and missing-data imputation. Am. J. Hum. Genet. 2005;76:449–462. doi: 10.1086/428594. [DOI] [PMC free article] [PubMed] [Google Scholar]
- 28.Scheet P., Stephens M. A fast and flexible statistical model for large-scale population genotype data: Applications to inferring missing genotypes and haplotypic phase. Am. J. Hum. Genet. 2006;78:629–644. doi: 10.1086/502802. [DOI] [PMC free article] [PubMed] [Google Scholar]
- 29.Browning S.R. Multilocus association mapping using variable-length Markov chains. Am. J. Hum. Genet. 2006;78:903–913. doi: 10.1086/503876. [DOI] [PMC free article] [PubMed] [Google Scholar]
- 30.International HapMap Consortium A haplotype map of the human genome. Nature. 2005;437:1299–1320. doi: 10.1038/nature04226. [DOI] [PMC free article] [PubMed] [Google Scholar]
- 31.Frazer K.A., Ballinger D.G., Cox D.R., Hinds D.A., Stuve L.L., Gibbs R.A., Belmont J.W., Boudreau A., Hardenbol P., Leal S.M., International HapMap Consortium A second generation human haplotype map of over 3.1 million SNPs. Nature. 2007;449:851–861. doi: 10.1038/nature06258. [DOI] [PMC free article] [PubMed] [Google Scholar]
- 32.de Bakker P.I.W., Ferreira M.A.R., Jia X.M., Neale B.M., Raychaudhuri S., Voight B.F. Practical aspects of imputation-driven meta-analysis of genome-wide association studies. Hum. Mol. Genet. 2008;17(R2):R122–R128. doi: 10.1093/hmg/ddn288. [DOI] [PMC free article] [PubMed] [Google Scholar]
- 33.Schaffner S.F., Foo C., Gabriel S., Reich D., Daly M.J., Altshuler D. Calibrating a coalescent simulation of human genome sequence variation. Genome Res. 2005;15:1576–1583. doi: 10.1101/gr.3709305. [DOI] [PMC free article] [PubMed] [Google Scholar]
- 34.Scott L.J., Mohlke K.L., Bonnycastle L.L., Willer C.J., Li Y., Duren W.L., Erdos M.R., Stringham H.M., Chines P.S., Jackson A.U. A genome-wide association study of type 2 diabetes in Finns detects multiple susceptibility variants. Science. 2007;316:1341–1345. doi: 10.1126/science.1142382. [DOI] [PMC free article] [PubMed] [Google Scholar]
- 35.Little R.J.A., Rubin D.B. Second Edition. J. Wiley & Sons; New York: 2002. Statistical Analysis with Missing Data. [Google Scholar]
Associated Data
This section collects any data citations, data availability statements, or supplementary materials included in this article.