

Abstract
NHERF1 is a multidomain scaffolding protein that assembles signaling complexes, and regulates the cell surface expression and endocytic recycling of a variety of membrane proteins. The ability of the two PDZ domains in NHERF1 to assemble protein complexes is allosterically modulated by the membrane-cytoskeleton linker protein ezrin, whose binding site is located as far as 110 Ångstroms away from the PDZ domains. Here, using neutron spin echo (NSE) spectroscopy, selective deuterium labeling, and theoretical analyses, we reveal the activation of interdomain motion in NHERF1 on nanometer length-scales and on submicrosecond timescales upon forming a complex with ezrin. We show that a much-simplified coarse-grained model suffices to describe interdomain motion of a multidomain protein or protein complex. We expect that future NSE experiments will benefit by exploiting our approach of selective deuteration to resolve the specific domain motions of interest from a plethora of global translational and rotational motions. Our results demonstrate that the dynamic propagation of allosteric signals to distal sites involves changes in long-range coupled domain motions on submicrosecond timescales, and that these coupled motions can be distinguished and characterized by NSE.
Introduction
Protein dynamics can initiate and control protein function. Protein motion regulates the transition-state dynamics of enzyme catalysis (1,2), and protein motion is proposed to contribute significantly to the propagation of allosteric signals (3). Information arising from ligand binding can be communicated to a distal site in a protein by altering internal dynamic modes (4). Much has been learned about local side-chain dynamics and backbone motion within a single protein domain, which are essential elements to facilitate large functional conformational changes. However, protein motion on nanometer length-scales and on nanosecond-to-microsecond timescales remains an elusive goal, because this is a spatial-temporal regime that has not been reached by existing biophysical techniques. Currently, there is an important information gap, on nanoscales, between the structural dynamics occurring at atomic resolution and the cellular organization and dynamics on the much larger micron length-scales and slower timescales. We stress that this information gap is both spatial and temporal.
To illustrate the importance of this spatiotemporal regime, we consider a specific problem. A critical phenomenon in cells is the clustering of receptors and channels in cell membranes, an event that is employed by diverse biological processes including receptor signaling, cell homeostasis, synaptic neuronal activities, and the activation of immune response (5). The assembled macromolecular complexes control the speed, the duration, and the strength of signal transduction, and organize biochemical reactions into hierarchical signaling pathways and networks. Adapters and scaffolding proteins, composed of multiple protein-protein interaction modular domains, have emerged as important molecular mediators and switches that control the association/dissociation and clustering of macromolecular signaling complexes (6). Although we know much about the structure and function of individual modules that compose adapters and scaffolding proteins, their overall dynamic architectures, and in particular the long-range motion properties of scaffolding proteins that control the function of assembled macromolecular signaling complexes, remain a largely unexplored territory. Protein motions on nanoscales are indispensible for relaying signals allosterically in the cellular networks (7). This concept is emerging as a powerful theme in cell signaling.
The mammalian Na+/H+ exchange regulatory factor 1 (NHERF1) is a multidomain scaffolding protein that assembles membrane protein complexes (8,9). NHERF1 consists of two PDZ-1 and PDZ-2 domains, and a C-terminal (CT) domain (see Fig. 1). The PDZs are modular protein-protein interaction domains that bind the cytoplasmic tails of a number of important transmembrane proteins. Notable functions of NHERF1 include assembling signaling complexes and regulating the cell surface expression and endocytic recycling of cystic fibrosis transmembrane conductance regulators, cell surface adhesion and antiadhesion proteins, G-protein coupled receptors, and tyrosine kinase receptors. NHERF1 thus participates in regulating multiple signaling pathways.
Figure 1.
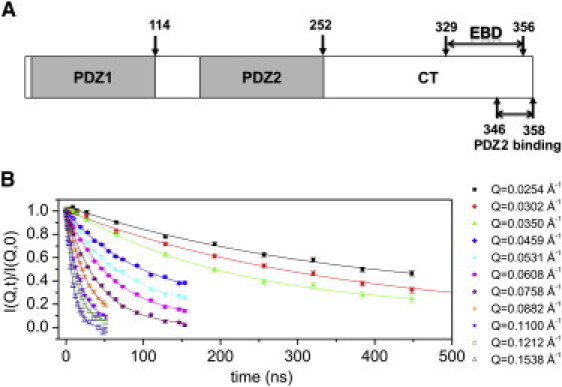
Multidomain scaffolding protein NHERF1 and NSE experiments. (A) A schematic representation of the different domains in NHERF1. The C-terminal 13-amino-acid residues (aa residue 346–358) of CT, which largely overlap with the ezrin-binding domain (EBD), interact with the ligand-binding pocket of the PDZ2 domain (17). (B) I(Q,t)/I(Q,0) of NHERF1 from NSE in solution. The lines are single exponential fits to I(Q,t)/I(Q,0). The legend on the right gives the Q value at which each I(Q,t)/I(Q,0) is measured. The I(Q,t)/I(Q,0) of NHERF1·hFERM or NHERF1·dFERM also shows single exponential behavior (Fig. S1).
An important feature of NHERF1 is its CT domain binding to ezrin and to other ezrin-radixin-moesin (ERM) proteins. Ezrin is a member of the ezrin/radixin/moesin family of proteins that function as linkers between the cell membranes and the actin cytoskeleton (10,11). ERM proteins are regulated by head-to-tail intramolecular interactions between the N-terminal FERM domain and the C-terminal actin-binding domain. Upon activation, the FERM domain binds to target membrane proteins either directly or indirectly through NHERF1, while the C-terminus of ezrin interacts with the actin filament. Because NHERF1 and ezrin link membrane proteins to the actin cytoskeletal network, they form a communication bridge between the plasma membrane proteins and the actin cytoskeleton.
Recent studies reveal that the ability of NHERF1 to assemble protein complexes is allosterically regulated (12–15). Ezrin positively modulates the cooperative interactions of NHERF1 with target membrane proteins. We have previously shown that when the FERM domain of ezrin is bound to the ezrin-binding domain (EBD) of NHERF1, the binding affinity of PDZ2 for the C-terminal domain of CFTR increases 24-fold (12). Moreover, the binding affinity of PDZ1 for the target protein also increases 18-fold upon FERM binding, even though PDZ1 is 110 Å away from the ezrin-binding binding site. Ezrin binding can also activate NHERF1 to assemble a heterogeneous complex, PTEN at PDZ1 and β-catenin at PDZ2 (13). A more recent study shows that ezrin binding to NHERF1 positively regulates the interactions of NHERF1 with PDZK1, which is a four-PDZ domain scaffolding protein that belongs to the NHERF family of proteins (15). Further, the allosteric communication between the two PDZ domains of NHERF1 is demonstrated by mutations in PDZ1 that reduces the binding affinity of PDZ2, or occupancy of a ligand in PDZ1 that enhances the binding capability of PDZ2 (15).
Our solution small angle x-ray (SAXS) and neutron scattering (SANS) and NMR studies reveal that NHERF1 alone adopts an elongated structure of 140 Å with three domains (Fig. 1) (12,14,16,17). The PDZ2 and CT domains of NHERF1 are in close contact with each other through weak intramolecular interactions between PDZ2 and a PDZ-binding motif at the C-terminus of the largely disordered but collapsed CT domain. Here we point out that, because NHERF1 adopts an elongated shape with PDZ1 well separated from the CT domain, PDZ1 is unlikely to interact directly with the CT domain through intramolecular interactions. Upon binding to the FERM domain of ezrin, both NMR and contrast variation SANS show that the intramolecular domain-domain interactions between PDZ2 and CT are released. The CT domain becomes largely unfolded, and the linker region between PDZ1 and PDZ2 becomes extended. Together with the biochemical studies, these studies suggest that ezrin binding to NHERF1 induces long-range interdomain allostery in NHERF1. NHERF1 transmits allosteric signals from the ezrin-binding site in the CT domain to both PDZ domains over a long distance of ∼110 Å so as to assemble protein complexes (see Fig. 1). NHERF1 and ezrin thus allosterically relay the signals from the F-actin cytoskeletal network to control the assembly of protein complexes at the cell membrane.
Here we use neutron spin echo (NSE) spectroscopy to reveal the activation of long-range, nanoscale interdomain motion in this multidomain scaffolding protein. NSE spectroscopy is a quasielastic neutron scattering technique that determines the time-space correlation function on timescales from subnanosecond to submicrosecond, and on length-scales from several Ångstroms to several hundred Ångstroms (18). NSE can determine long-range relaxation processes in a macromolecule (19). NSE has the potential to reveal the global shape fluctuations and protein domain motions in a protein or within a protein complex on length-scales comparable to their overall sizes (20–22), thus filling an important spatial-temporal gap in the study of protein dynamics.
Previously, we have applied NSE to determine internal motion in Taq polymerase (21). In that study, we explained how NSE reveals protein domain motion by allowing one to test models of the mobility tensors for protein domains. Here we employ NSE spectroscopy and selective deuteration to reveal the activation of long-range protein domain motions in a multidomain scaffolding protein Na+/H+ exchange regulatory factor 1 (NHERF1) upon forming a complex with ezrin. We present an improved theoretical framework for interpreting the NSE results.
Methods and Materials
Protein preparation
The proteins used in this study were expressed in bacteria and purified as described previously (12,14,16). For producing deuterated FERM, bacteria cells were grown at 37°C in sterile M9 D2O medium (99.9% D2O; Cambridge Isotope Laboratories, Andover, MA) until O.D.600nm reaches 0.8. The cells were induced with 0.25 mM IPTG. The deuterium content of dFERM was measured by matrix-assisted laser desorption time-of-flight mass spectrometry (12,14,16). The nonexchangeable deuterium content determined by mass spectroscopy is 75% for dFERM. With this deuterium content, the scattering length density of the deuterated protein matches that of 100% D2O buffer (14).
The NHERF1·hFERM or NHERF1·dFERM complex was formed by incubating NHERF1 with hFERM or dFERM at 1:1 molar ratio. The formed complexes were further purified by gel filtration. All samples are exchanged into 99.9% D2O buffer containing 30 mM deuterated glycine, 5 mM deuterated Tris, and 150 mM NaCl for NSE experiments. For both NMR and NSE experiments, the protein concentrations were NHERF1 at 11.9 mg/mL, NHERF1·hFERM at 6.5 mg/mL, and NHERF1·dFERM at 3.4 mg/mL.
Pulsed field gradient NMR experiments
Spectra were acquired at 10°C on an Avance 600 MHz spectrometer (Bruker BioSpin, Billerica, MA) equipped with a 5 mm z-axis gradient, triple resonance, cryogenic probe head. Self-diffusion rates were measured using a pulsed-field gradient-stimulated spin echo technique (23). Each dataset contained 75 gradient experiments with the gradient strengths increased linearly from 5 to 60 G/cm, and all other delays and pulses held constant. Gradient pulses were applied for 5 ms with a diffusion delay of 80 ms. Sixteen transients were acquired per gradient experiment. The buffer condition is the same as in the NSE experiments.
Data were analyzed using the variable gradient least-square fitting routines in NMRPipe (24), and, in all cases, protein resonances were fit with a single-exponential decay function using peak intensities for determination of the translational self-diffusion coefficient. The results represent average values obtained using intensities from a minimum of seven separate peaks in both the aromatic and aliphatic regions. The reported error contains the standard deviations in the diffusion coefficients obtained by fitting these individual resonances of each sample. The self-diffusion rates can be estimated from the Stokes-Einstein equation which assumes spherical molecules much larger than the solvent molecules. The fitting was calibrated using solvent signals and numerous known protein samples with a wide range of molecular mass.
NSE experiments
The NSE experiments were performed at the high-resolution IN15 NSE instrument at the Institute Laue-Langevin, Grenoble, France. Three different wavelengths were employed to best adapt to the resolution-intensity requirements. The 22 Å, 14.5 Å, and 10 Å wavelengths were covering 3.7–537 ns, 1.1–154 ns, and 0.35–50.5 ns time ranges of I(Q,t). The beam monochromatization in each case was 15% full width at half-maximum, as given by the neutron velocity selector. The samples were filled in quartz cells with 4-mm sample thickness and the temperature was controlled at 10.5 ± 0.1°C. Instrumental resolution was measured on the standard Grafoil (GrafTech, Lakewood, OH), which gives a strong elastic coherent small angle scattering. Background was measured on the D2O buffer and the sample spectra were corrected using the relative transmissions following the standard procedures.
Results
A theoretical scheme to extract protein domain motion from NSE
NSE measures the intermediate scattering function I(Q,t), which is the spatial Fourier transformation of the space-time van Hove correlation function G(r,t) (18),
where
is the magnitude of the scattering vector with θ as the scattering angle, λ as the wavelength of the neutron, t as the time, and r as the position of a nucleus. Like the static SANS, in the low Q region (such as the Q range employed in this NSE study), I(Q,t) is dominated by coherent scattering that corresponds to the cross-correlation G(r,t), i.e., the probability of finding a nucleus at position ri at time t = 0 and finding another nucleus at position rj at time t.
A natural way to interpret the NSE data is to examine the effective diffusion constant Deff(Q) as a function of Q, which is determined by the normalized intermediate scattering function I(Q,t)/I(Q,0),
| (1) |
where I(Q,0) is the static form factor. Because I(Q,t)/I(Q,0) is generally amenable to a single-exponential fit in time (see Fig. 1), Deff(Q) can be accurately estimated by the first cumulant expression (21)
| (2) |
which is a generalization of the Akcasu-Gurol formula (25) to rotational motion (21). Our notation follows Doi and Edwards (26), which also provides an explication of relevant previous work in Bu et al. (21). Here, bj is the scattering length of a subunit j, HT is the translational mobility tensor, and HR is the rotational mobility tensor. The coordinates of the various subunits (subunits can be atoms, dummy atoms, or domains), taken relative to the center of friction of the protein, are given by rj (note that by definition Σ rj = 0); kBT is the usual temperature factor; and Lj = rj × Q is the angular momentum vector for each coordinate. The brackets <…> denote an orientational average over the vector Q, so that
can be expressed in terms of the spherical Bessel functions j.
As we have discussed previously (21), the Akcasu-Gurol approach described in Eq. 2 is valid for either rigid bodies or rigid-body subunits connected by soft spring linkers. The translational mobility tensor HT is defined by the velocity response v = HT F to an applied force F, and the rotational mobility tensor HR is defined by the angular velocity response ω = HR τ to an applied torque τ. In practice, the structural coordinates of a protein may be obtained from high-resolution crystallography or NMR or from low-resolution electron microscopy, SAXS, or SANS. Comparison of the calculations in Eq. 2 to experimental Deff(Q) thus allows one to test models of the mobility tensors.
The mobility tensors have two sets of indices. First, there is the index that indicates the specific subunit under consideration, which we denote with Latin letters (m,n,…). There is also a second set of indices which indicate the spatial orientation (x,y,z). Generally, we will omit this second set of indices for clarity, and use a bold font to indicate vectors. For a rigid-body composed of N identical subunits, the translational mobility tensor HT is a matrix with N2 identical 3×3 elements This must be so, because HT yields the velocity response of, e.g., subunits B and C to a force applied to subunit A. If the mobility tensor components HAB and HAC are unequal, the velocity responses of B and C will be different, and the body will no longer remain rigid. Thus, the mobility tensor provides a direct indication of the existence of internal degrees of freedom.
The rotational mobility tensor HR for the entire protein is then derived by evaluating the torque by summing over all subunits m:
| (3) |
As shown in the Supporting Material, Eq. 3 generally yields the simple estimate Deff(Q→∞) = 2 Deff(Q = 0) for rigid bodies composed of identical (e.g., nondeuterated) point subunits. We adopt the simplifying assumption that the three principal spatial components of the translational mobility tensor for each subunit are equal to ND0/(kBT) = 1/ζ with ζ the friction constant of a subunit and D0 the measured diffusion constant of the protein. Then Fn = ζ vn = ζ (ω × rn). Thus Eq. 3 yields the rotational mobility tensor HR via a straightforward inversion of a 3×3 matrix (see Eq. A.2 in the Supporting Material). A fair estimate of the rigid-body Deff (Q) measured by NSE can therefore be made using only the coordinates and diffusion constant D0 of the system.
In the above calculation of HR, as well as below, we assume that the x, y, and z diagonal components of HT are equal for each subunit and are the only nonzero components. In general, of course, both the rotational and translational mobility tensors have different values for each of the three principal axes, so that there are six independent quantities for each domain. In a multidomain complex like NHERF1 bound to the FERM domain of ezrin, there are generally at least 24 independent quantities for the mobility tensor (three translational plus three rotational for each of the four subunits). These quantities are difficult to evaluate to the precision required to compare with NSE data. Programs such as HYDROPRO utilize continuum Navier-Stokes equations to estimate the mobility tensor components from structural coordinates (27), but a continuum approximation is insufficiently accurate for our purposes because many structural features of a protein are of the same size as water molecules. By contrast, our simple approach requires neither complicated molecular dynamics simulations nor Navier-Stokes hydrodynamics. The effects of scattering length inhomogeneity can also be neglected as neutron scattering occurs mostly from hydrogen atoms.
For an object with internal domain motion, comparing the calculated Deff(Q) with data allows one to extract the relative degree of dynamic coupling between the various components of the system, for this dynamic coupling is defined by the mobility tensor. For example, a rigid two-domain system will be described by a mobility tensor,
| (4a) |
with all elements of the tensor equal, and yields (via Eq. 2) the simple result that the translational contribution to the effective diffusion constant is given by DTeff(Q) = kBT H0, independent of Q. By contrast, a two-domain system with internal motion will possess a mobility tensor,
| (4b) |
in principal coordinates. Thus, the application of equal forces to the two domains will result in their having different velocities, revealing internal motion. For the case where there is one internal translational mode between subunits 1 and 2 with D1 = kBT H1 and D2 = kBT H2 (21), the translational contribution to the effective diffusion constant is
| (4c) |
Here, S1(Q) and S2(Q) are the form factors of the separate individual protein domains, while S(Q) is the form factor of the entire protein. Orientational averages are performed, so that, e.g., S(Q) = Σ j0 (Qr); and S(Q) is normalized so that S(0) = N2.
Rotational diffusion will introduce additional contributions to the numerator, as per Eq. 2. The calculations we perform here consist of rigid-body motion (including both translational and rotational motion), and an internal translational mode as per Eqs. 4b and 4c. We stress that, in principle, it is possible to include the effects of arbitrary translational and rotational internal motion in the calculation (21). Therefore, the combination of NSE and first cumulant analysis allows one to test complex models of the mobility tensors of the system, and extract dynamical information about the internal motion of the protein.
The dynamics of NHERF1 is well represented by a rigid-body model
The virtue of the above simple approach can be seen by comparing the NSE data Deff(Q) for unbound NHERF1 with the rigid-body calculation using Eqs. 2, 3, and 4a. The rigid-body calculation uses as input only the translational diffusion coefficient D0 of NHERF1 obtained from pulsed-field gradient (PFG) NMR, and the dummy-atom structural coordinates (28) reconstructed from SAXS (14,16). Fig. 2 B shows that the calculated rigid-body Deff(Q) fits the NSE experimental data quite well, except at high Q where the experimental Deff(Q) is slightly smaller than the computed values. This is possibly due to fine structural differences from that represented by the coordinates reconstructed from SAXS. Thus, NHERF1 behaves essentially as a rigid-body on the time- and length-scales detected by our NSE experiment.
Figure 2.
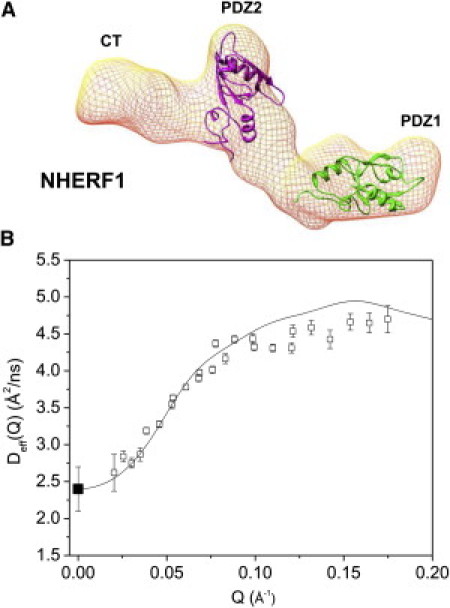
NHERF1 alone can be described by a rigid-body model. (A) Three-dimensional shape of NHERF1 reconstructed from SAXS (14) using DAMMIN (28). For illustration, the structures of the PDZ1 (PDB code: 1I92) and PDZ2 (PDB code: 2KJD) are docked into the three-dimensional shape using UCSF Chimera software (31). EBD that interacts with PDZ2 is not marked. (B) Comparing experimental Deff(Q) of NHERF1 (open squares) with rigid-body calculation performed using dummy atoms (solid line). D0 (solid squares) is from PFG NMR (Table S1).
The rotational diffusion relaxation time 1/HR0 can be estimated (via Eq. 3) to be ∼1000 ns. The Fourier time-window employed in our NSE experiments is between 0.3 and 200 ns. Thus, rotational diffusion is present in the time-window of the NSE experiments.
Binding to FERM activates interdomain motions in NHERF1
As one might expect from the unbound NHERF1, the salient features of protein domain motion, as viewed by NSE, can be understood in terms of simple models. We next use this direct approach and construct models of increasing sophistication to demonstrate domain motion in the complex of NHERF1 bound to the FERM domain of ezrin. Because our approach depends on few assumptions, it is subject to less unquantifiable uncertainty than a large-scale multiparameter fit or molecular dynamics simulation.
We have performed NSE experiments on two types of complexes of NHERF1 bound to the FERM domain of ezrin. One is the hydrogenated NHERF1 bound to hydrogenated FERM (NHERF1·hFERM), and the other is hydrogenated NHERF1 bound to deuterium-labeled FERM (NHERF1·dFERM). We then performed a series of computations of Deff(Q) for both the deuterated and hydrogenated complexes. When calculating Deff(Q) for the NHERF1·dFERM complex, the scattering from the deuterated component is treated as invisible in Eq. 2 because the neutron scattering length density of the deuterated component contrast matches that of the D2O buffer background.
We have previously shown that deuteration does not cause aggregation or conformational changes in the NHERF1·FERM complex (14). At low Reynolds number, the dynamics of a protein should not depend upon its mass, but rather upon its size (29). Thus, the dynamics of the deuterated complex can be treated as similar to that of the hydrogenated complex. The PFG NMR results show that NHERF1·hFERM and NHERF1·dFERM complexes have very similar translational diffusion constants, in support of this assertion (Table S1). In our calculations, we thus always impose the constraint that the dynamics (and therefore the mobility tensors) of the hydrogenated and deuterated components are the same. As we show below, this provides a significant and essential constraint.
Using the same approach applied to NHERF1, we have first performed a rigid-body calculation of Deff(Q) for the deuterated NHERF1·dFERM complex. The structural coordinates of the complex are the dummy atoms (30) reconstructed from SANS data (14) (shown in Fig. 3 A), and the one constraint parameter Deff(Q = 0) is the self-diffusion constant D0 for this deuterated complex, taken from PFG NMR. We then use the same approach and parameter to compute the Deff(Q) of the hydrogenated NHERF1·hFERM complex. As shown in Fig. 3 B, the agreement between the experimental data and rigid-body calculations is poor for both the NHERF1·dFERM and the NHERF1·hFERM complexes. We stress that we use the same diffusion constant (from the deuterated complex shown in Table S1) for both complexes, because the dynamics at low Reynolds number is presumably identical for both the hydrogenated and deuterated complexes.
Figure 3.
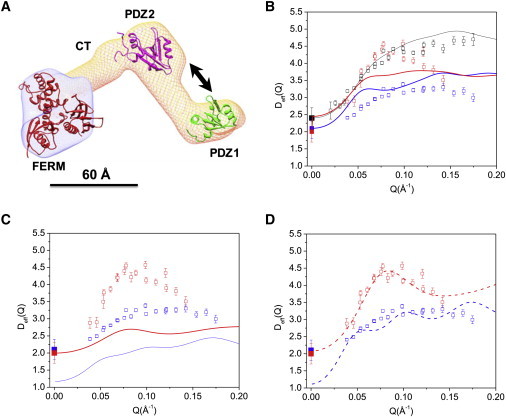
Activation of domain motion in NHERF1 upon binding to FERM domain. (A) The three-dimensional shape of NHERF1·FERM reconstructed from SANS (14) using the software MONSA (30). The structures of PDZ1, PDZ2, and ezrin FERM (PDB code: 1NI2) are docked into the envelope. Arrows represent motions between PDZ1 and PDZ2. A 60 Å scale bar is shown. (B) Comparing experimental Deff(Q) with rigid-body calculations for NHERF1·dFERM (open red squares and solid red line) and NHERF1·hFERM (open blue squares and blue line). Rigid-body calculations used the dummy-atom coordinates from SANS (14). D0 for NHERF1·dFERM (solid red squares) and NHERF1·hFERM (solid blue squares) are from PFG NMR. D0 (solid black squares), Deff(Q) (open black squares), and the rigid-body calculation (solid black line) of NHERF1 are shown. (C) Comparing NSE data with rigid model calculations for the NHERF1·dFERM and NHERF1·hFERM complexes using the coordinates of the docked domains. Symbols same as in panel B. (D) Comparing experimental Deff(Q) with calculations incorporating interdomain motion (via the mobility tensor) between PDZ1 and PDZ2, for NHERF1·dFERM (dashed red line), and NHERF1·hFERM (dashed blue line). Calculations used the docked structures. Symbols for Deff(Q) and D0 same as panels B and C.
We argue that the difference between the experimental NSE results and dummy atom rigid-body calculations arises because of the internal motion of the protein. This internal motion produces various effects:
First, the way in which internal motion manifests itself is through the fact that the mobility tensor associated with a protein with internal motion is different than the mobility tensor for a rigid-body. This was discussed above (see Eq. 4).
Second, it is essential to note that the evaluation of Eq. 2 implicitly requires an average over a distribution of particle densities. For the purposes of this calculation, the SAXS/SANS dummy atom structural data may be an accurate representation for a rigid-body, but will be inaccurate for a protein with a significant degree of internal dynamics. This is because ab initio programs utilized for shape reconstruction from SANS or SAXS data typically produce an envelope of the calculated structure, in which the density inside the envelope is assumed constant. In a highly mobile object, the reconstructed shape may thus be a poor representation of the fluctuating structures. Thus, for example, if the linker regions between domains are highly mobile, the size of the linker regions may be overestimated, and the dummy atom shape reconstruction will not be a good representation of the entire protein. We speculate that the disagreement between the experimental NSE data and that computed from the SANS reconstructed shape model (Fig. 3 B), is partly due to this variation of density within the reconstructed shape.
Thus, in the following, we construct two models incorporating these internal motion effects to understand the discrepancy between the calculations and experimental data. We first present a more detailed rigid-body model, in which the known high-resolution structural fragments of the PDZ1, PDZ2CT, and the FERM domains are docked into the three-dimensional shapes reconstructed from SANS (Fig. 3 A) using the software package UCSF Chimera (31). This docked model therefore incorporates a crude form of density variation within the complex, by ignoring the density of the linker regions. The mobility tensor for this first model is taken to be that for a rigid-body. It will be seen that this density variation alone does not yield a good comparison with the NSE data. We therefore construct a second docked model in which the mobility tensor used is that for interdomain motion between the two PDZ domains. It will be seen that the second model produces a sizeable improvement in explaining the data.
We now present the results of the calculations of Deff(Q) using the docked coordinates. As shown in Fig. 3 C, the rigid-body mobility tensor-docked calculations again provide poor fits to the NSE data for both the hydrogenated and deuterated complexes. The comparison thus suggests that NHERF1·hFERM and NHERF1·dFERM do not behave as rigid-bodies on the length-scales and timescales of the NSE experiments. This observation is supported by our previous SANS and NMR structural studies that find large conformational changes in NHERF1 upon binding to FERM (14,17). In particular, the region that links PDZ1 and PDZ2 becomes more extended, and the CT region of NHERF1 becomes largely unfolded upon binding to FERM. Thus, structural fluctuations in the complexes can become significant in the complex on the length-scales and timescales of the NSE experiments.
We next incorporate interdomain motion in the mobility tensor for the NHERF1·dFERM and NHERF1·hFERM complexes in our calculation. To compute Deff(Q) with domain motion using Eqs. 2, 3 and 4b, we use the coordinates of the docked model (Fig. 3 A), and assume translational interdomain motion between PDZ1 and PDZ2 (Eq. 4b). Here we perform the calculation, as always, with only one adjustable parameter, the translational diffusion constant for each atom. Again, this parameter is adjusted so that Deff(Q) for the deuterated complex agrees with the value measured by PFG NMR. As with the above calculations, we use this same parameter for both the deuterated and hydrogenated complexes. When performing the calculations, the rotational contributions to diffusion (Eq. 3) are taken to be the same as for the rigid-body docked model calculation. The difference with the previous docked calculation is thus solely that, in this second docked model calculation, we employ the mobility tensor for a protein with an internal mode between the PDZ1 and PDZ2 domains, rather than a rigid-body mobility tensor.
After incorporating interdomain motion between PDZ1 and PDZ2 in the NHERF1·dFERM complex, the calculated Deff(Q) with internal motion agrees well with the NSE results (Fig. 3 D). In particular, the docked calculation with the internal mode mobility tensor generates a peak at a Q value of 0.07 Å−1 in Fig. 3 D, which agrees well with the NSE results. For the NHERF1·hFERM complex, there is also better agreement between the experimental data and the calculation after incorporating interdomain motion between PDZ1 and PDZ2 (Fig. 3 D). Nevertheless, we note that, for the docked NHERF1·hFERM complex, the computed D0 at Q = 0 is not close to the experimental values from PFG NMR measurement. As pointed out above, we attribute this discrepancy to large conformational fluctuations in the CT-FERM region caused by the unfolding of the CT domain upon binding to FERM (17), which cannot be represented by a single reconstructed SANS structure shown in Fig. 3 A. Such complications are minimal in the NHERF1·dFERM complex because the deuterated dFERM is invisible to neutrons. Future experiments could use selective deuteration of other portions of the complex to highlight the motions of PDZ2-CT-FERM domains for NSE study.
A simple four-point model describes domain motion
The simple calculations we presented above require only the structural coordinates and a single constraint (the diffusion constant at Q = 0 Å−1 for the deuterated complex, measured independently by PFG NMR) to generate the computed Deff(Q). It is possible to argue, however, that the structural coordinates are insufficiently accurate to explain the NSE data, or that some coincidental artifact produces the peak at 0.07 Å−1 that implies internal motion. We therefore introduce an even more simplified model that yields the same effect, and serves to explain its origin. The simplified model is taken by extracting four points that represent the coordinates of the center-of-mass of domains obtained from the SANS data of the NHERF1·FERM complex. These points form a triangle model as shown in Fig. 4 A with the distances FERM-PDZ2 = 80 Å, PDZ2-PDZ1 = 59 Å, and FERM–PDZ1=110 Å. The CT domain is taken as being halfway between the FERM and PDZ2 domains (Fig. 4 A). We include the point representing the FERM domain with a weight factor of 3 to account for its larger size relative to the other domains. Because it is possible to obtain the center-of-mass distances between the domains with confidence even with low-resolution SAXS or SANS data, this model possesses fewer uncertainties than a model based upon the molecular shape.
Figure 4.
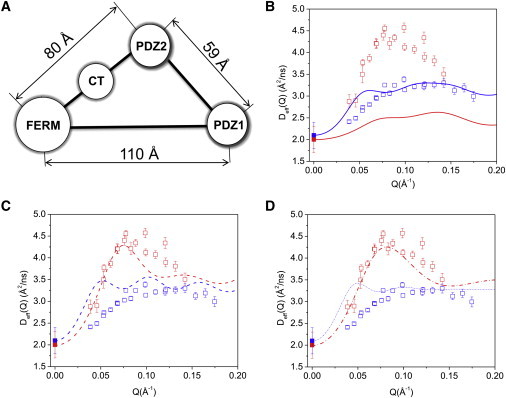
A simplified four-point model can well describe domain motion in the complex. (A) The four-point model represents NHERF1·FERM, with centers of PDZ1, PDZ2, CT, and FERM taken from Fig. 3A. (B) Comparing experimental Deff(Q) with the four-point rigid-body calculations for NHERF1·hFERM (blue open squares are experimental and blue solid line is calculation) and for NHERF1·dFERM (red open squares, experimental and red solid line, calculation). D0 of NHERF1·dFERM (solid red squares) and NHERF1·dFERM (solid blue squares) are shown. (C) Comparing experimental data with calculations assuming interdomain motion between PDZ1 and PDZ2 in NHERF1·dFERM (red dashed line) and NHERF1·hFERM (blue dashed line). Experimental symbols same as in panel B. (D) Comparing the experimental data with calculations incorporating interdomain motion between PDZ1 and PDZ2, as well as assuming a form factor of spheres of 20 Å radius for FERM and both PDZ domains in NHERF1·dFERM (red dash-dot line) and in NHERF1·hFERM (blue dash-dot line).
We first present the calculation of the four-point model representing the deuterated NHERF1·dFERM and hydrogenated NHERF1·hFERM complexes. The calculation has one adjustable parameter, the domain translational diffusion constant DTdomain, which is chosen to yield the correct value for the diffusion constant D0 of the deuterated complex (as measured by PFG NMR). For the model with internal motion, the domain diffusion constant is taken the same for the FERM, the CT, and the two PDZ domains. We use DTdomain = 2.9 × 10⁻⁷ cm2/s for the domain diffusion constant for both the deuterated and hydrogenated systems. Note that the diffusion constant DT for the individual domains is larger than that for the complex, as expected. Interestingly enough, the diffusion constant for the hydrogenated complex (2.1 × 10⁻⁷ cm2/s) is estimated correctly by this procedure, and is thus an output. The rotational diffusion constant is then estimated using the Stokes formula for a sphere DRdomain = (3/4)DTdomain/RS2, with the Stokes-Einstein radius RS = kBT/(6πηDTdomain) and is taken to be identical for all domains. Such an estimate has been shown to be valid for a number of proteins (32).
In our four-point calculation, we assume that the PDZ1 domain is a separate subunit, and so there is a degree of internal motion in the protein, appearing as translational mode between PDZ1 and PDZ2. The translational mobility tensor for the PDZ1 domain is thus a simple constant, while the FERM, CT, and PDZ2 domains are treated as rigid subunits and thus their translational mobility tensor is a 3×3 matrix (whose xyz elements are all equal). The rotational mobility tensor is a 4×4 matrix, taken as the same as a rigid-body. Thus we see that the topological dynamic connectivity of the mobility tensors defines the Q dependence of the effective diffusion constant, while their numerical values largely determine only its overall scale. It is, of course, the connectivity that defines the degree and nature of protein internal motion.
Fig. 4 B compares the experimental NSE data with the calculated Deff(Q) from the rigid four-point model for the hydrogenated and the partially deuterated complexes. Fig. 4 C is the Deff(Q) of the four-point model incorporating internal domain motion between PDZ1 and the rest of the complex. After incorporating internal motion, the overall Deff(Q) from the four-point model agrees well with the experimental data for both the partially deuterated and the hydrogenated complexes. There are, however, some oscillations remaining, for we have approximated the domains as point objects.
The comparison between calculation and experimental data improves considerably after including the form factor of a 20 Å radius sphere for the FERM domain and both PDZ domains in the calculation (Fig. 4 D). Thus, the NSE data is better represented by the four-point model that includes PDZ1-PDZ2 oscillatory motion than by a model that assumes the complex as a rigid-body. Further improvement likely requires the use of methods of evaluating the mobility tensors for proteins with high accuracy.
Moreover, from the four-point model calculations, we note that Deff(Q) for the hydrogenated rigid complex and the hydrogenated complex with internal motion are nearly indistinguishable (Fig. S3 A). For the deuterated complex, Deff(Q) obtained from the interdomain motion model is significantly different from that of the rigid-body model (Fig. S3 B). This can be explained as due to the relatively large contribution to Eq. 2 of the effects of rotational diffusion of the overall object, which dominates and obscures the effects of internal motion when no deuteration is performed. For the partially deuterated complex, both the docked domain calculation (Fig. 3) and the four-point model (Fig. 4, B–D) show that Deff(Q) of the rigid-body complex is significantly different from that of the complex with internal domain motion. These analyses demonstrate that deuterium labeling of a domain in a protein or in a protein complex significantly amplifies the effects of internal motion detected by NSE. Our model calculations (Fig. S3, A and B) suggest that deuterium-labeling a domain can mask a portion of the form factor, and, as a result, highlight the contribution of the terms of internal domain motion in Eq. 2. Thus, we propose that future NSE experiments will benefit by utilizing the strategy of selective deuteration to highlight the domain motion of interest.
Multidomain proteins and protein complexes are complicated systems containing thousands of atoms, and providing precise answers to questions can be done, if at all, by large-scale simulations. We demonstrate in this article that the NSE results can be explained by a detailed docked model, as well by a highly simplified four-point model that is independent of the details of the structural model. By doing so, we have systematically reduced the relevant assumptions, making the results of our calculations progressively more certain.
Discussion
The NSE experiments and our analyses demonstrate changes in long-range domain motion in NHERF1 upon binding to the FERM domain of ezrin. We show that selective deuteration of a domain is crucial for NSE to effectively reveal protein domain motion in a protein or protein complex. Remarkably, the activation of interdomain motion in NHERF1 occurs over a distance of ∼110 Å away from the regulatory ezrin-binding site. The timescales of the domain motion as probed by NSE is 10–50 ns, and the amplitude of the domain motion can be estimated by the equipartition theorem (21) to be ∼10 Å. NHERF1 is an allosteric protein, and the ability of its two PDZ domains to assemble protein complexes is positively controlled by ezrin. Previously, we have correlated structural changes in NHERF1 upon ezrin binding to the induced long-range interdomain allosteric behavior in NHERF1 (14). Together, these studies show that the propagation of allosteric signals over long distances is correlated with dynamics changes and the activation of interdomain motion on nanosecond-to-submicrosecond timescales.
For NHERF1 alone, the overall dynamics of NHERF1 agrees fairly well with a rigid-body model. The fact that unbound NHERF1 possesses only limited interdomain motion on the length-scale and timescale of the NSE experiments does not contradict our recent NMR studies that uncover a largely disordered C-terminal domain of NHERF1 (17). The NMR and SAXS studies show that although the CT domain of NHERF1 is largely disordered, CT adopts a collapsed domain conformation that is in close contact with the PDZ2 domain rather than an expanded random coil conformation. Thus, on the length-scales (Q = 0.02–0.2 Å−1) and timescales probed by the NSE experiments, NHERF1 alone essentially behaves like a rigid-body. Other quasielastic neutron scattering techniques such as time-of-flight and backscattering could be employed to provide information about the dynamics in the disordered CT domain at short length-scales (33–35).
The Deff(Q) of the NHERF1·dFERM complex is better described by a model that incorporates domain motion between PDZ1 and PDZ2 than by a rigid-body (Fig. 4). We further show that domain motion between PDZ1 and PDZ2 can well be described by a simple four-point model. The calculations that we have outlined here could be generalized to arbitrarily complex internal motions, each of which will produce a distinct Q-dependent signature in the effective diffusion constant. Thus, NSE allows one to separate and identify the various internal domain motions of a protein.
The Deff(Q) of the hydrogenated NHERF1·hNHERF1 complex is also better described by a model that incorporates domain motion between PDZ1 and PDZ2 than by a rigid-body (Fig. 4). Nevertheless, unlike the NHERF1·dNHERF1 complex, the analysis of the NSE results is complicated by the uncertainty of the coordinates (or large-scale motion) of the FERM domain reconstructed from SANS, due to the highly flexible and fluctuating nature of the CT domain that connects PDZ2 and FERM domain. In the complex, the CT domain becomes largely unfolded, and is thus an ensemble of highly fluctuating structures (14,17). Additional complications might come from the relative subdomain motion with the FERM domain. Future work could employ selective deuteration of the PDZ1 domain to highlight the domain motions in the PDZ2-CT-FERM region for NSE study.
NHERF1 is a multidomain scaffolding protein that assembles membrane protein clusters, regulates the dynamic trafficking of receptors and ion channels, and organizes protein-protein interactions that influence multiple cell signaling pathways. As we proposed in an earlier study, the allosteric regulation of NHERF1 by ezrin to assemble membrane protein complexes could provide a means to effectively control the strength and duration of signaling at the membrane-cytoskeleton (14). Besides propagating allosteric signals, the long-range activated interdomain motions in NHERF1 may serve other functional roles during the assembly of macromolecular complexes. The activated interdomain motion may allow the PDZ domains to sample certain conformational space and to search the target membrane proteins effectively (36).
Protein motion plays several fundamental roles in protein function, from transmitting the flow of energy and allosteric signals to shuttling a protein via biased routes on the energy landscape for folding and catalysis (37). The timescales of protein motion span from picoseconds to seconds, and the length-scales range from local Ångstrom motion to nanometer global motion (38). Understanding nanoscale protein motions is essential, for thermal fluctuations on fast timescales, such as on picosecond-to-nanosecond timescales, ultimately inspire and dictate the kinetics of large conformational changes necessary for protein function (21,33,34,39,40). Our NSE study demonstrates the activation of long-range coupled domain motion on submicrosecond and on nanometer length-scales, which influences the long-range allosteric couplings of the different functional domains for binding to target proteins. Remarkably, the changes in protein domain motion are associated with propagating allosteric signals from a binding site to a remote domain that is a distance of 110 Å away.
We have found that the long-range domain motions in the adaptor proteins, which are in the nanospatial-temporal regime, relay signals between the F-actin cytoskeletal network and the cell membranes, and exercise control of the assembly of protein complexes in the cell membrane. However, such protein motion on nanoscales is, at best, difficult to observe by other experimental techniques. The deuterium labeling approach and the theoretical analyses that we presented here therefore should pave the way for using NSE to study protein motions in multidomain proteins. We expect NSE to fill an important nanoscale spatial-temporal gap in our ability to characterize protein motion and function.
Acknowledgments
We thank the Isotope Laboratory at the Institut Laue-Langevin for the access to protein purification equipment.
This study is funded by National Institutes of Health grant No. 5R01HL086496. G.C. is supported by National Institutes of Health grants No. P41RR02301 (Biomedical Research Technology Program/National Center for Research Resources) and No. P41GM66326 (National Institute of General Medical Sciences).
Contributor Information
David J.E. Callaway, Email: dcallaway@ccny.cuny.edu.
Zimei Bu, Email: zbu@ccny.cuny.edu.
Supporting Material
References
- 1.Benkovic S.J., Hammes-Schiffer S. A perspective on enzyme catalysis. Science. 2003;301:1196–1202. doi: 10.1126/science.1085515. [DOI] [PubMed] [Google Scholar]
- 2.Eisenmesser E.Z., Millet O., Kern D. Intrinsic dynamics of an enzyme underlies catalysis. Nature. 2005;438:117–121. doi: 10.1038/nature04105. [DOI] [PubMed] [Google Scholar]
- 3.Cooper A., Dryden D.T.F. Allostery without conformational change. A plausible model. Eur. Biophys. J. 1984;11:103–109. doi: 10.1007/BF00276625. [DOI] [PubMed] [Google Scholar]
- 4.Hawkins R.J., McLeish T.C.B. Coarse-grained model of entropic allostery. Phys. Rev. Lett. 2004;93:098104. doi: 10.1103/PhysRevLett.93.098104. [DOI] [PubMed] [Google Scholar]
- 5.Hardie R.C., Raghu P. Visual transduction in Drosophila. Nature. 2001;413:186–193. doi: 10.1038/35093002. [DOI] [PubMed] [Google Scholar]
- 6.Pawson T., Scott J.D. Signaling through scaffold, anchoring, and adaptor proteins. Science. 1997;278:2075–2080. doi: 10.1126/science.278.5346.2075. [DOI] [PubMed] [Google Scholar]
- 7.Ma B., Nussinov R. Amplification of signaling via cellular allosteric relay and protein disorder. Proc. Natl. Acad. Sci. USA. 2009;106:6887–6888. doi: 10.1073/pnas.0903024106. [DOI] [PMC free article] [PubMed] [Google Scholar]
- 8.Weinman E.J., Hall R.A., Shenolikar S. The association of NHERF adaptor proteins with g protein-coupled receptors and receptor tyrosine kinases. Annu. Rev. Physiol. 2006;68:491–505. doi: 10.1146/annurev.physiol.68.040104.131050. [DOI] [PubMed] [Google Scholar]
- 9.Shenolikar S., Voltz J.W., Weinman E.J. Regulation of ion transport by the NHERF family of PDZ proteins. Physiology (Bethesda) 2004;19:362–369. doi: 10.1152/physiol.00020.2004. [DOI] [PubMed] [Google Scholar]
- 10.Bretscher A., Edwards K., Fehon R.G. ERM proteins and Merlin: integrators at the cell cortex. Nat. Rev. Mol. Cell Biol. 2002;3:586–599. doi: 10.1038/nrm882. [DOI] [PubMed] [Google Scholar]
- 11.Fehon R.G., McClatchey A.I., Bretscher A. Organizing the cell cortex: the role of ERM proteins. Nat. Rev. Mol. Cell Biol. 2010;11:276–287. doi: 10.1038/nrm2866. [DOI] [PMC free article] [PubMed] [Google Scholar]
- 12.Li J., Dai Z., Bu Z. Ezrin controls the macromolecular complexes formed between an adapter protein Na+/H+ exchanger regulatory factor and the cystic fibrosis transmembrane conductance regulator. J. Biol. Chem. 2005;280:37634–37643. doi: 10.1074/jbc.M502305200. [DOI] [PubMed] [Google Scholar]
- 13.Morales F.C., Takahashi Y., Georgescu M.M. NHERF1/EBP50 head-to-tail intramolecular interaction masks association with PDZ domain ligands. Mol. Cell. Biol. 2007;27:2527–2537. doi: 10.1128/MCB.01372-06. [DOI] [PMC free article] [PubMed] [Google Scholar]
- 14.Li J., Callaway D.J., Bu Z. Ezrin induces long-range interdomain allostery in the scaffolding protein NHERF1. J. Mol. Biol. 2009;392:166–180. doi: 10.1016/j.jmb.2009.07.005. [DOI] [PMC free article] [PubMed] [Google Scholar]
- 15.LaLonde D.P., Garbett D., Bretscher A. A regulated complex of the scaffolding proteins PDZK1 and EBP50 with ezrin contribute to microvillar organization. Mol. Biol. Cell. 2010;21:1519–1529. doi: 10.1091/mbc.E10-01-0008. [DOI] [PMC free article] [PubMed] [Google Scholar]
- 16.Li J., Poulikakos P.I., Bu Z. Protein kinase C phosphorylation disrupts Na+/H+ exchanger regulatory factor 1 autoinhibition and promotes cystic fibrosis transmembrane conductance regulator macromolecular assembly. J. Biol. Chem. 2007;282:27086–27099. doi: 10.1074/jbc.M702019200. [DOI] [PubMed] [Google Scholar]
- 17.Bhattacharya S., Dai Z., Bu Z. A conformational switch in the scaffolding protein NHERF1 controls autoinhibition and complex formation. J. Biol. Chem. 2010;285:9981–9994. doi: 10.1074/jbc.M109.074005. [DOI] [PMC free article] [PubMed] [Google Scholar]
- 18.Mezei F. Neutron Spin Echo: Proceedings of a Laue-Langevin Institut Workshop. Springer; Heidelberg, Germany: 1980. The principles of neutron spin echo; pp. 3–26. [Google Scholar]
- 19.Ewen B., Richter D. Neutron Spin Echo Spectroscopy Viscoelasticity Rheology. Advances in Polymer Science Series. Vol. 134. Springer; New York: 1997. Neutron spin echo investigations on the segmental dynamics of polymers in melts, networks and solutions; pp. 1–129. [Google Scholar]
- 20.Alpert Y., Cser L., Ostanevich Y.M. Segmental flexibility in pig immunoglobulin G studied by neutron spin-echo technique. Biopolymers. 1985;24:1769–1784. doi: 10.1002/bip.360240908. [DOI] [PubMed] [Google Scholar]
- 21.Bu Z., Biehl R., Callaway D.J. Coupled protein domain motion in Taq polymerase revealed by neutron spin-echo spectroscopy. Proc. Natl. Acad. Sci. USA. 2005;102:17646–17651. doi: 10.1073/pnas.0503388102. [DOI] [PMC free article] [PubMed] [Google Scholar]
- 22.Lal J., Fouquet P., Makowski L. Neutron spin-echo studies of hemoglobin and myoglobin: multiscale internal dynamics. J. Mol. Biol. 2010;397:423–435. doi: 10.1016/j.jmb.2010.01.029. [DOI] [PMC free article] [PubMed] [Google Scholar]
- 23.Tanner J.E. Use of the stimulated echo in NMR diffusion studies. J. Chem. Phys. 1970;52:2523–2526. [Google Scholar]
- 24.Delaglio F., Grzesiek S., Bax A. NMRPipe: a multidimensional spectral processing system based on UNIX pipes. J. Biomol. NMR. 1995;6:277–293. doi: 10.1007/BF00197809. [DOI] [PubMed] [Google Scholar]
- 25.Akcasu Z., Gurol H. Quasi-elastic scattering by dilute polymer-solutions. J. Polym. Sci., B, Polym. Phys. 1976;14:1–10. [Google Scholar]
- 26.Doi M., Edwards S.F. Oxford University Press; Oxford, UK: 1986. The Theory of Polymer Dynamics. [Google Scholar]
- 27.García De La Torre J., Huertas M.L., Carrasco B. Calculation of hydrodynamic properties of globular proteins from their atomic-level structure. Biophys. J. 2000;78:719–730. doi: 10.1016/S0006-3495(00)76630-6. [DOI] [PMC free article] [PubMed] [Google Scholar]
- 28.Svergun D.I. Restoring low resolution structure of biological macromolecules from solution scattering using simulated annealing. Biophys. J. 1999;76:2879–2886. doi: 10.1016/S0006-3495(99)77443-6. [DOI] [PMC free article] [PubMed] [Google Scholar]
- 29.Howard J. Sinauer Associates; Sunderland, MA: 2001. Mechanics of Motor Proteins and the Cytoskeleton. [Google Scholar]
- 30.Petoukhov M.V., Svergun D.I. Joint use of small-angle x-ray and neutron scattering to study biological macromolecules in solution. Eur. Biophys. J. 2006;35:567–576. doi: 10.1007/s00249-006-0063-9. [DOI] [PubMed] [Google Scholar]
- 31.Pettersen E.F., Goddard T.D., Ferrin T.E. UCSF Chimera—a visualization system for exploratory research and analysis. J. Comput. Chem. 2004;25:1605–1612. doi: 10.1002/jcc.20084. [DOI] [PubMed] [Google Scholar]
- 32.Yao S., Babon J.J., Norton R.S. Protein effective rotational correlation times from translational self-diffusion coefficients measured by PFG-NMR. Biophys. Chem. 2008;136:145–151. doi: 10.1016/j.bpc.2008.06.002. [DOI] [PubMed] [Google Scholar]
- 33.Bu Z., Neumann D.A., Han C.C. A view of dynamics changes in the molten globule-native folding step by quasielastic neutron scattering. J. Mol. Biol. 2000;301:525–536. doi: 10.1006/jmbi.2000.3978. [DOI] [PubMed] [Google Scholar]
- 34.Bu Z., Cook J., Callaway D.J. Dynamic regimes and correlated structural dynamics in native and denatured α-lactalbumin. J. Mol. Biol. 2001;312:865–873. doi: 10.1006/jmbi.2001.5006. [DOI] [PubMed] [Google Scholar]
- 35.Russo D., Pérez J., Durand D. Dynamic transition associated with the thermal denaturation of a small β-protein. Biophys. J. 2002;83:2792–2800. doi: 10.1016/S0006-3495(02)75288-0. [DOI] [PMC free article] [PubMed] [Google Scholar]
- 36.Windisch B., Bray D., Duke T. Balls and chains: a mesoscopic approach to tethered protein domains. Biophys. J. 2006;91:2388–2392. doi: 10.1529/biophysj.105.078543. [DOI] [PMC free article] [PubMed] [Google Scholar]
- 37.Miyashita O., Onuchic J.N., Wolynes P.G. Nonlinear elasticity, protein quakes, and the energy landscapes of functional transitions in proteins. Proc. Natl. Acad. Sci. USA. 2003;100:12570–12575. doi: 10.1073/pnas.2135471100. [DOI] [PMC free article] [PubMed] [Google Scholar]
- 38.McCammon J.A. Protein dynamics. Rep. Prog. Phys. 1984;47:1–46. [Google Scholar]
- 39.Ishikawa H., Kwak K., Fayer M.D. Direct observation of fast protein conformational switching. Proc. Natl. Acad. Sci. USA. 2008;105:8619–8624. doi: 10.1073/pnas.0803764105. [DOI] [PMC free article] [PubMed] [Google Scholar]
- 40.Lindorff-Larsen K., Best R.B., Vendruscolo M. Simultaneous determination of protein structure and dynamics. Nature. 2005;433:128–132. doi: 10.1038/nature03199. [DOI] [PubMed] [Google Scholar]
Associated Data
This section collects any data citations, data availability statements, or supplementary materials included in this article.