

Abstract
Sphingolipid metabolism is driven by inflammatory cytokines. These cascade of events include the activation of sphingosine kinase (SK), and subsequent production of the mitogenic and proinflammatory lipid sphingosine 1-phosphate (S1P). Overall, S1P is one of the crucial components in inflammation, making SK an excellent target for the development of new anti-inflammatory drugs. We have recently shown that SK inhibitors suppress colitis and hypothesize here that the novel SK inhibitor, ABC294640, prevents the development of colon cancer. In an azoxymethane (AOM)/dextran sulfate sodium (DSS) mouse model, there was a dose-dependent decrease in tumor incidence with SK inhibitor treatment. The tumor incidence (number of animals with tumors per group) in the vehicle, ABC294640 (20 mg/kg) and ABC294640 (50 mg/kg) groups were 80, 40 and 30%, respectively. Tumor multiplicity (number of tumors per animal) also decreased from 2.1 ± 0.23 tumors per animal in the AOM + DSS + vehicle group to 1.2 ± 0 tumors per animal in the AOM + DSS + ABC294640 (20 mg/kg) and to 0.8 ± 0.4 tumors per animal in the AOM + DSS + ABC294640 (50 mg/kg) group. Importantly, with ABC294640, there were no observed toxic side effects. To explore mechanisms, we isolated cells from the colon (CD45−, representing primarily colon epithelial cells) and (CD45+, representing primarily colon inflammatory cells) then measured known targets of SK that control cell survival. Results are consistent with the hypothesis that the inhibition of SK activity by our novel SK inhibitor modulates key pathways involved in cell survival and may be a viable treatment strategy for the chemoprevention colitis-driven colon cancer.
Introduction
Inflammatory bowel disease (IBD) is a group of disorders characterized by pathological inflammation of the lower intestine. Crohn’s Disease and Ulcerative Colitis are the most common forms. The roles of immune cells and inflammatory cytokines in the pathogenesis of IBD are well established. Activation of immune responses in IBD results in the local influx of mast cells, monocytes, macrophages and neutrophils, which produces the clinical manifestations of the diseases (1). This is accompanied by dramatic increases in tumor necrosis factor-alpha (TNFα) (2), which has a primary role in mediating both experimental and clinical IBD. Additionally, IBD is a high colon cancer risk disease. Cancers appear to arise from genetic alterations in cancer-related genes (oncogenes and suppressor genes), as well as an overall loss of genomic stability. The etiological and tissue microenvironment factors that spawn colitis and progression to colon cancer are still unclear. So far, this has resulted in limited success for prevention of colitis and colon cancer associated with this disease, and new molecular targets for their prevention and/or treatment are needed.
The mechanisms and effects of the sphingolipid interconversion have been the subjects of a growing body of scientific investigation. Sphingomyelin is a structural component of cellular membranes and is a precursor for the potent bioactive lipids ceramide and sphingosine 1-phosphate (S1P). A ceramide/S1P rheostat has been hypothesized to determine the fate of the cell, such that the relative cellular concentrations of ceramide and S1P determine whether a cell proliferates or undergoes apoptosis. Ceramide is produced by the hydrolysis of sphingomyelin in response to inflammatory stresses, including TNFα, which is a key target in colitis (3,4). Ceramide induces apoptosis in tumor cells (5) and can be further hydrolyzed by the action of ceramidase to produce sphingosine (Sph). Sph is then rapidly phosphorylated by sphingosine kinase (SK) to produce S1P. Ceramidase and SK are also activated by cytokines and growth factors, leading to rapid increases in the intracellular levels of S1P and depletion of ceramide levels. This promotes cell proliferation and inhibits apoptosis, and deregulation of apoptosis in phagocytes is an important component of the chronic inflammatory state in IBDs.
S1P also has several important effects on immune function. Platelets, monocytes and mast cells secrete S1P upon activation, promoting inflammatory cascades in damaged tissue (6). SK activation is required for the signaling responses since the ability of TNFα to induce adhesion molecule expression via activation of nuclear factor-kappaB is mimicked by S1P and blocked by the SK inhibitor dimethylsphingosine (3). Similarly, S1P mimics the ability of TNFα to induce COX-2 expression and prostaglandin E2 synthesis; and knock down of SK blocks these responses to TNFα but not S1P (7). In intestinal endothelial cells, S1P activates nuclear factor-kappaB thereby inducing the expression of adhesion molecules, COX-2 resulting in prostaglandin E2 synthesis and nitric oxide synthase producing nitric oxide. Together, these chemoattractants and the adhesion molecules promote neutrophil infiltration into the mucosa. SK has been directly demonstrated to play a significant role in the recruitment and function of these cells (8,9). At the same time, S1P activates neutrophils resulting in the release of oxygen free radicals that further inflame and destroy epithelial tissues. Overall, it is clear that S1P is critical in inflammation, making SK an excellent target for the development of new anti-inflammatory/chemopreventive drugs. Here, we confirm that a novel small molecule SK inhibitor [ABC294640, (10)] can prevent colitis (11) and show for the first time that it also suppresses colon cancer associated with colitis in a dose–response manner.
Materials and methods
Animals
All mice (C57BL/6) used were 8–12 weeks of age. They were housed in pathogen-free rooms in filter-topped cages at the Laboratory Animal Facility at Graduate Science Research Center, University of South Carolina. This facility is accredited by Association for Assessment and Accreditation of Laboratory Animal Care-International, is registered with the United States Department of Agriculture (56-R-003) and operates in accordance with Federal (Guide for the Use and Care of Laboratory Animals, Animal Welfare Act), State and local laws and regulations. All mice were used in accordance with protocols approved by the Institutional Animal Care and Use Committees of University of South Carolina. Mice received food and water ad libitum.
ABC294640
The SK inhibitor, ABC294640 whose pharmacokinetics have been described previously (10), was provided by Apogee Biotechnology Corporation (Hershey, PA) (11).
AOM/DSS-induced colon cancer model
We followed a modified protocol outlined recently by the Wirz et al. (12) (supplementary Figure 1A is available at Carcinogenesis Online). The supplementary Figure 1B (available at Carcinogenesis Online) also outlines the treatment groups for this model. Briefly, these are as follows: Group 1, vehicle (PEG400 alone); Group 2, azoxymethane (AOM) + PEG400; Group 3, Dextran sulfate sodium (DSS) + PEG400; Group 4, ABC294640 (50 mg/kg) alone; Group 5, AOM + ABC294640 (50 mg/kg); Group 6, AOM + DSS + vehicle (PEG400); Group 7, AOM + DSS + ABC294640 (20 mg/kg) and Group 8, AOM + DSS + ABC294640 (50 mg/kg). Ten to twelve weeks old C57BL/6 male and female mice were randomized, weighed and given a single intraperitoneal injection of AOM (10 mg/kg; Sigma Chemical Co., St. Louis, MO) or vehicle on Day 1. One week later, daily intraperitoneal administration of either high (50 mg/kg) or low (20 mg/kg) doses of ABC294640 or vehicle (PEG400) was initiated as summarized in supplementary Figure 1A, available at Carcinogenesis Online. As well, animals received either 1% DSS (Molecular Weight 36 000–50 000; MP Biomedicals, Solon, OH) or normal drinking water. Chronic IBD was induced with cyclical DSS treatments, consisting of 7 days of 1% DSS followed by 14 days of normal water for a total of three cycles. The SK inhibitor (or PEG400 vehicle control) was administered 5 days per week until the end of the experiment on Day 70. The AOM-only groups were included to determine whether ABC294640 reduces colon cancer in the absence of inflammation.
To monitor the degree of acute inflammation, five mice from Groups 2, 4 and 8 were euthanized on experimental Day 15, and histology score was assessed as described previously (11). Five mice from the same groups were euthanized on the same day, and single-cell suspensions of epithelial/inflammatory cells were made. To ensure no influence of age or sex on protein expression, all mice used here were male and between 10 and 12 weeks of age. Colons were flushed out with phosphate-buffered saline, opened longitudinally and then incubated in 10% fetal calf serum/5 mM ethylenediaminetetraacetic acid/Ca/Mg-free phosphate-buffered saline for 15 min. Colons were then shaken gently for 10 s, and the single-cell suspension consisting of epithelial and inflammatory cells collected in the supernatant. Trypan blue staining revealed >95% viable cells by microscopic observation. Epithelial cells were separated from inflammatory cells using magnetic cell sorting technology, according to kit instructions (mouse CD45 MicroBeads; Miltenyi Biotec, Auburn, CA). Cell pellets were frozen and SK targets that contribute to cell survival and oncogenesis were examined. On Day 70, the remaining mice were weighed, euthanized and their blood was harvested. The colons were resected and measured, a 2 cm proximal section was snap frozen for sphingolipid quantification as a measure of bioactivity of ABC294640. No section that was snap frozen contained a visible tumor. The remainder of the colon was cut longitudinally and fixed in 10% buffered formalin overnight. The colons were then stained with methylene blue and scored for the number of macroscopic colonic neoplasms using stereomicroscope. Tumor area, divided into <5 mm2 and >5 mm2 groups based on length and width, was also calculated. Following photography, colons were rinsed with ice-cold phosphate-buffered saline, swiss-rolled and processed for histopathology by paraffin embedding and sectioning.
Histology score
For Day 15 sections, following fixation and embedding in paraffin, blocks were sectioned and staining with hematoxylin and eosin. The sections were microscopically examined for histopathologic and inflammatory changes as described previously (11).
Assessment of microscopic pathological lesions
Following hematoxylin and eosin staining, colons were assessed for tumor pathology in a blinded fashion by a trained pathologist. Microscopic lesions were defined as adenomatous changes with architectural complexities, a high nuclear to cytoplasmic ratio, increased mitosis, loss normal gland architecture, variable gland size and shape, glands still have connective tissue core (space, collagen or cells) between them, tufting (back to back glands), loss of nuclear orientation, large cell nuclei (not basal), oval or round, pseudostratification, irregular nuclear membranes, large nucleoli and aberrant nuclei. There were also high-grade dysplasias plus nuclei big, piling up, bizarre bridging over/cribiform pattern (sieve-like), filling in of lumen with glands, loss of connective tissue core (no space or collagen or connective tissue or cells between glands, right next to each other) and glands within glands, back to back glands. All lesions were adenomas, and there were no adenocarcinomas.
White blood cell counts
Whole blood samples were taken from mice by orbital bleeding immediately before euthanasia. We examined the blood using a Vetscan hmt (Abaxis, Union City, CA) complete blood counter to monitor systemic inflammation by assessing total white blood cell counts.
Sphingolipid assay
Biochemical analyses of sphingolipids were performed by the Lipidomics Shared Resource at Medical University of South Carolina on a Thermo Finnigan TSQ 7000, triple-stage quadrupole mass spectrometer. Results are normalized to the 1 mg of total protein content of the colon extracts.
Western blot analysis
Standard western blotting techniques were used. The antibodies used were as follows:
Beclin-1 (Cell Signaling Technology, Danvers, MA), Akt (Cell Signaling Technology) and phospho-Akt, extracellular signal-regulated kinase (ERK) 1/2 (Cell Signaling Technology), Phospho-ERK1/2 (Cell Signaling Technology) and Beclin-1 (Cell Signaling Technology).
Statistics
A chi-square contingency table analysis was done on the AOM + DSS and AOM + DSS + SK inhibitor groups to determine if there is a statistically significant difference in their inflammation scores and Sph levels. Tumor incidence was examined using a Fisher’s exact test, which is equivalent to a test for binomial proportions. Because the usual assumptions underlying the analysis of variance test are not satisfied, in assessing the significance of the F-statistic value from the analysis of variance table, instead of using the F-distribution, we used a permutation distribution to examine tumor multiplicity. Tumor sizes were divided into <5 mm2 and >5 mm2, and the analysis of variance and Kruskal–Wallis test were carried out for significant differences between the groups. The P-value chosen for significance in this study was 0.05.
Results
The small molecule SK inhibitor, ABC294640, suppresses colitis
Recently, it has been shown that SK-1−/− mice had significantly less DSS-induced colonic inflammation than wild-type counterparts (13). In addition, we have shown that the pharmacological SK inhibitor, ABC294640, also inhibits DSS-induced colitis (11). To confirm ABC294640 was working to inhibit colon inflammation in this experiment, five mice were examined and inflammation scores were recorded. Figure 1A shows that AOM-injected mice consuming DSS had significantly elevated levels of colon inflammation (P = 0.005) and that administration of the SK inhibitor significantly decreased the inflammatory score (P = 0.0136 compared with the AOM + DSS + vehicle group).
Fig. 1.

Effects of the SK inhibitor ABC294640 (50 mg/kg dose) on the colon histology score (A), colon length (B), weight difference (C) and complete white blood cells count (D) in the acute stage (Day 15) in the AOM + DSS mouse model of colitis. Values represent the individual scores of each mouse (n = 5 per group). The line represents the mean score for the group. Asterisk represents significant difference from the control group.
As a separate measure of gastrointestinal and overall health, we also measured colon length (Figure 1B), body weight change (Figure 1C) and white blood cell counts (Figure 1D). Mouse colon length shrinks with stress, inflammation and ulceration (14). Results indicate that compared with the colon lengths of the control (AOM + PEG400)-treated group (8.3 ± 0.16 cm), the length was significantly (P = 0.00000023) reduced in the AOM + DSS group (5.2 ± 0.25 cm). AOM + DSS mice treated with the SK inhibitor (ABC294640, 50 mg/kg) had statistically longer colons (7.1 ± 0.23 cm) compared with those of the AOM + DSS group (P = 0.000074). Similarly, unhealthy mice lose weight during the course of the experiment. To that end, over the 15 day course of this intermediate end point experiment, the AOM + DSS group lost an average of 0.87 ± 0.18 g, whereas both the non-AOM-treated and the AOM + DSS + ABC294640 (50 mg/kg) gained an average of 1.34 ± 0.36 and 0.67 ± 0.27 g, respectively. These values were significantly different from the AOM + DSS group (P < 0.05). Finally, a complete white blood cell count was carried out to monitor systemic inflammation. The PEG400-treated group had an average total circulating white blood cell count (×106 cells/ml) of 9.5 ± 0.7. The AOM + DSS and AOM + DSS + ABC294640 (50 mg/kg) groups had an average count of 12.7 ± 3 and 9.1 ± 1.4, respectively, indicating less systemic stress with injection of 50 mg/kg ABC294640. The red blood cell counts were 9.66 ± 0.8, 9.63 ± 0.6 and 8.34 ± 1.0 for the PEG400, AOM + DSS and AOM + DSS + ABC294640 (50 mg/kg) groups, respectively. These values, however, were not statistically significant (P > 0.05).
SK activity in target colons
As a measure of the effects of SK inhibitors in this animal model, sphingolipid profiles were assayed in the colons of animals using liquid chromatography-tandem mass spectroscopy. This technique allows the examination of correlations between biologic activity and changes in sphingolipid levels in animals treated with SK inhibitors. While S1P levels are the most direct indicators of SK activity, the levels of S1P in the colon samples were below the detection limit. However, the substrate Sph levels should increase when SK is inhibited, and in fact, Sph levels were significantly (P < 0.05) higher in colons from AOM + DSS + ABC294640 mice compared with AOM + DSS + vehicle-treated controls in both the Days 15 and 70 samples (Figure 2).
Fig. 2.

Effects of the SK inhibitor ABC294640 (50 mg/kg dose) on Sph levels in colons of animals in the AOM + DSS mouse model of colitis. Colon samples from mice described in Table I were extracted and assayed for levels of Sph by liquid chromatography-tandem mass spectroscopy as described in the ‘Materials and Methods’ section. Values represent the mean ± standard error for five samples per group.
The small molecule SK inhibitor, ABC294640, suppresses AOM + DSS-induced macroscopic lesions
On experimental Day 70 (supplementary Figure 1 is available at Carcinogenesis Online), colons were harvested and stained with methyl blue to examine macroscopic lesions. A total of 12/13 (92.3%) mice treated with AOM + DSS + vehicle (PEG400), but 0/10 (0%) in vehicle control only (no AOM) developed macroscopic lesions in the colon (Table I). There was a dose-dependent decrease in the incidence of macroscopic lesions with the SK inhibitor treatment, such that 7/10 (70%) of mice developed macroscopic lesions in the AOM + DSS + ABC294640 (20 mg/kg) group and 5/10 (50%) developed macroscopic lesions in the AOM + DSS + ABC294640 (50 mg/kg) group. Although the difference between the AOM + DSS + vehicle (92.3% incidence) and AOM + DSS + ABC294640 (20 mg/kg) (70% incidence) was not statistically significant (P = 0.28); significance was achieved between the AOM + DSS + vehicle (92.3% incidence) and AOM + DSS + ABC294640 (50 mg/kg) (50% incidence) groups (P = 0.05).
Table I.
Macroscopic lesion incidence and multiplicity in mice treated with AOM/DSS ± ABC294640
| Group | n | Percentage of animals with macroscopic lesions (incidence) | Number of macroscopic lesions per animal (multiplicity), mean ± SE | Percentage of macroscopic lesions > 5 mm2 |
| Vehicle (PEG400) | 10 | 0.0 | 0 | 0 |
| AOM + vehicle (PEG400) | 10 | 0.0 | 0 | 0 |
| DSS + vehicle (PEG400) | 10 | 10.0 | 1 ± 0 | 0 |
| Vehicle + ABC294640 (50 mg/kg) | 10 | 0.0 | 0 | 0 |
| AOM + ABC294640 (50 mg/kg) | 10 | 10.0 | 2 ± 0 | 0 |
| AOM + DSS + vehicle (PEG400) | 10 | 92.3 | 4.9 ± 1.1 | 32 |
| AOM + DSS + ABC294640 (20 mg/kg) | 10 | 70.0 | 2.4 ± 1.0 | 25 |
| AOM + DSS + ABC294640 (50 mg/kg) | 10 | 50.0a | 1.6 ± 0.7a | 13 |
Indicates significant difference from AOM + DSS-treated group (see Materials and Methods for statistics).
The macroscopic lesion multiplicity (number of macroscopic lesions per animal) was also decreased by treatment with the SK inhibitor (Table I). The total number of macroscopic lesions in the AOM + DSS + vehicle (PEG400) was 64, the total number of macroscopic lesions in the ABC294640 (20 mg/kg) group was 24, and the total number of macroscopic lesions in the ABC294640 (50 mg/kg) group was 16. Permutation distribution analysis found similar results to that of macroscopic lesions. Although the difference between the AOM + DSS + vehicle (PEG400) (4.85 ± 1.1 macroscopic lesions per animal) and AOM + DSS + ABC294640 (20 mg/kg) (2.4 ± 1.0 macroscopic lesions per animal) was not statistically significant (P = 0.14); significance was achieved between the AOM + DSS + vehicle (PEG400) (4.85 ± 1.1 macroscopic lesions per animal) and AOM + DSS + ABC294640 (50 mg/kg) (1.6 ± 0.7 macroscopic lesions per animal) groups (P = 0.03). There were two macroscopic lesions in one animal from the AOM + ABC294640 (50 mg/kg) and one macroscopic lesions in one animal from the DSS + (PEG400)-treated groups. All other groups were tumor-free (Table I).
Another trend was that the tumor surface area is reduced with increasing doses of ABC294640 (Table I). Tumors (32%) in the AOM + DSS group were >5 mm2 without ABC294640, but only 25 and 13% of tumors were that large in the 20 and 50 mg/kg ABC294640 groups, respectively. This trend, however, was not statistically significant. Supplementary Figure 2 (available at Carcinogenesis Online) shows Table I data in graphical form, as well as representative photographs of colons from each group. The arrows indicate a colonic neoplasm. Figure 3 shows representative hematoxylin- and eosin-stained photomicrographs of tissues on Days 15 and 70.
Fig. 3.
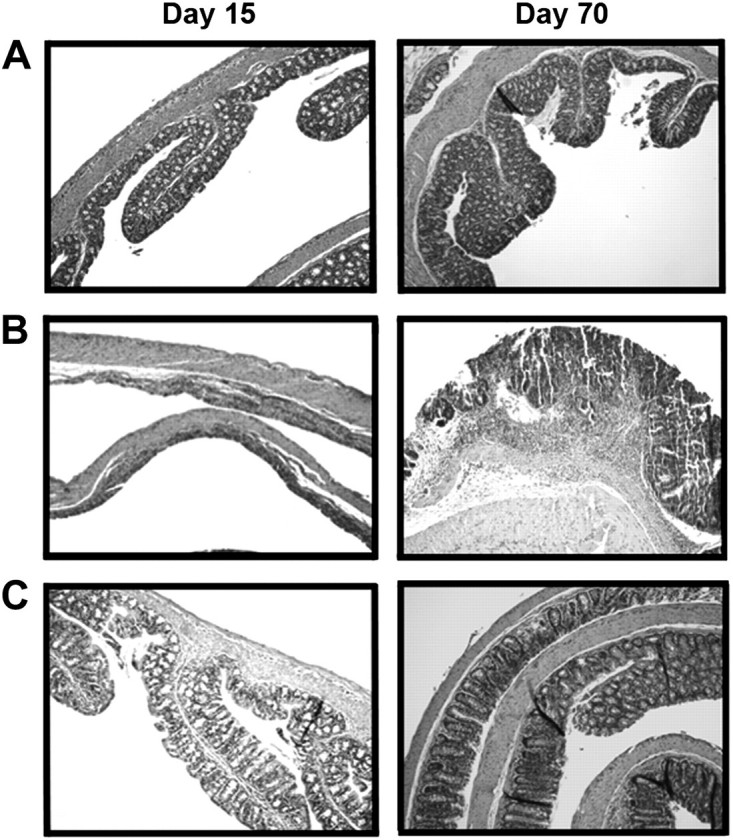
Protective effect of SK inhibitor ABC294640 on AOM/DSS colitis-induced epithelial damage. Representative microphotographs for AOM + Vehicle (A), AOM + DSS (B) and AOM + DSS + ABC294640 (50 mg/kg) (C) groups at Days 15 (left panels) and 70 (right panels).
The small molecule SK inhibitor, ABC294640, suppresses microscopic colon cancer associated with colitis
Because many lesions are not macroscopically evident, and because some growths are not necessarily cancerous, we sectioned each colon for microscopic histology studies. The differences between Tables I and II reflect that this statement is true. As shown in Table II, tumor incidence of mice treated with AOM + DSS + vehicle (PEG400) was 80%, and a dose-dependent decrease in tumor incidence occurred with SK inhibitor treatment. A total of 4/10 (40%) mice developed tumors in the AOM + DSS + ABC294640 (20 mg/kg) group and 3/10 (30%) developed tumors in the AOM + DSS + ABC294640 (50 mg/kg) group. Both results were statistically significant (P = 0.05).
Table II.
Histological tumor incidence and multiplicity in mice treated with AOM/DSS ± ABC294640
| Group | n | Percentage of animals with colon tumors (incidence) | Number of tumors per animal (multiplicity) mean ± SE |
| Vehicle (PEG400) | 10 | 0.0 | 0 |
| AOM + vehicle (PEG400) | 10 | 0.0 | 0 |
| DSS + vehicle (PEG400) | 10 | 10.0 | 2 ± 0 |
| Vehicle + ABC294640 (50 mg/kg) | 10 | 0.0 | 0 |
| AOM + ABC294640 (50 mg/kg) | 10 | 0.0 | 0 |
| AOM + DSS + vehicle (PEG400) | 10 | 80.0 | 2.1 ± 0.23 |
| AOM + DSS + ABC294640 (20 mg/kg) | 10 | 40.0a | 1.2 ± 0a |
| AOM + DSS + ABC294640 (50 mg/kg) | 10 | 30.0a | 0.8 ± 0.4a |
Indicates significant difference from AOM + DSS-treated group (see Materials and Methods for statistics).
Tumor multiplicity (number of tumors per animal) also decreased with SK inhibitor treatment (Table II). The difference between the AOM + DSS + vehicle (PEG400) (2.1 ± 0.23 tumors per animal) and AOM + DSS + ABC294640 (20 mg/kg) (1.2 ± 0 tumors per animal) was statistically significant (P < 0.05); significance was also achieved between the AOM + DSS + vehicle (PEG400) (2.1 ± 0.23 tumors per animal) and AOM + DSS + ABC294640 (50 mg/kg) (0.8 ± 0.4 tumors per animal) groups (P < 0.05). There were two tumors in one animal from the DSS + vehicle (PEG400) control group. All other groups were tumor-free (Table I).
Histologically, we found that all growths were adenomas. In the AOM + DSS + vehicle (PEG400)-treated group, 42% of the lesions were adenomas with low-grade dysplasia and 42% were adenomas with high-grade dysplasia. The remaining lesions were carcinoma in situ. In the AOM + DSS + ABC294640 (20 mg/kg)-treated group, similarly, 42% of the lesions were adenomas with low-grade dysplasia and 25% were adenomas with high-grade dysplasia and the remaining carcinoma in situ. In the AOM + DSS + ABC294640 (50 mg/kg)-treated group, similarly, 26% of the lesions were adenomas with low-grade dysplasia and 47% were adenomas with high-grade dysplasia. The remaining were carcinoma in situ. Interestingly, three mice from this latter group [AOM + DSS + ABC294640 (50 mg/kg)] had areas of significant squamous metaplasia.
The small molecule SK inhibitor, ABC294640, targets both epithelial and inflammatory cells for death pathways
We and others have recently characterized some of the targets of SKs, which include regulators of cell survival (15,16). Beclin-1, a key protein regulating the autophagy pathway, is a tumor suppressor and an important component regulating cell survival. Other targets of SKs include the AKT pathway and the ERK1/2 pathway. These proteins also promote cell survival following phosphorylation (17), which is elevated in both inflammatory cells and epithelial cells in colitis (18–22). To this end, we wanted to better understand the mechanism by which ABC294640 inhibits colon cancer associated with colitis. We therefore isolated CD45+ inflammatory cells and CD45-epithelial cells in a pre-cancerous stage (Day 15 of 70) and probed the cells for Beclin-1, AKT phosphorylation and ERK1/2 phosphorylation. Figure 4 shows that Beclin-1 is suppressed by DSS + AOM in epithelial cells, whereas the addition of ABC294640 elevated Beclin-1. Phosphorylated AKT and ERK1/2 were elevated in epithelial cells with AOM + DSS treatment and suppressed by treatment of the mice with ABC294640. Similar results were found in inflammatory cells.
Fig. 4.

Effects of the SK inhibitor ABC294640 (50 mg/kg dose) on cell survival pathways in CD45− cells (non-inflammatory cells, assuming mostly colon epithelial cells) and CD45+ (mostly inflammatory cells). Beclin-1 is a putative tumor suppressor, which plays a key role in autophagy. AKT phosphorylation and ERK1/2 phosphorylation are associated with cell survival. The finding that ABC294640 can increase Beclin-1 and suppress the phosphorylation of AKT and ERK1/2, especially in epithelial cells, gives us insight into the unpinning mechanisms associated with the suppression of colitis-driven colon cancer by ABC294640.
Discussion
Colitis is a dynamic disease associated with hyperactive immune cells and increased colon cancer risk. Based on the knowledge that S1P can potentiate inflammation by inhibiting the apoptosis of inflammatory cells, we have recently shown that SK inhibitors suppress colitis in a mouse model (11). Here, we have extended this data to show that the SK inhibitor, ABC294640, not only inhibits colitis (Figure 1), but also inhibits colon cancer associated with colitis (Tables I and II). To investigate any immunomodulatory effects, we also performed blood counts, which suggested no change in white blood cell counts (total white blood cell counts, lymphocytes, monocytes and granulocytes) or red blood cell counts between the control and SK inhibitor group. Mechanistically, we have also shown that SK was inhibited in vivo, consistent with the understanding that ABC294640 was responsible for the prevention of cancer. Additionally, we found that Beclin-1 was suppressed, and AKT ERK1/2 were phosphorylated in the colitis model, and these parameters are largely normalized by treatment with ABC294640. The understanding that these are targets of SK (15,16) and finding that these survival pathways occurred in colon epithelial cells not only gives insight into a possible mechanism of colon cancer development in the AOM/DSS models, but also the prevention of colitis-driven colon cancer by ABC294640.
Kohno et al. (23) recently showed adenoma size but not incidence was dramatically reduced in Apc Min/+ SK−/− mice. Although this is consistent with our finding that the inhibition of SK can protect against colon cancer, the pathology and the molecular characteristics of sporadic colon cancer are different than colitis-driven colon cancer. Our study is in agreement, however, with another recent study by Kawamori et al. (24). Using a similar AOM + DSS model, they showed that SK1-knockout mice had reduced tumor incidence and multiplicity. We should note that ABC294640 is a stronger inhibitor of SK-2 (10,15), adding to the novelty and potential clinical relevance of our findings.
The mechanism of inhibition of colon cancer associated with colitis by ABC294640 is most probably associated with its ability to inhibit inflammation. However, it is possible that there are protective effects directly on the colon epithelial cells, as demonstrated by our findings presented in Figure 4. Specifically, it appears Beclin-1, AKT and/or ERK1/2 are candidate molecules/pathways that are targeted by ABC294640 to inhibit colitis-driven colon carcinogenesis. Others have found that transfection of SK into NIH/3T3 fibroblasts is sufficient to promote foci formation and cell growth in soft-agar and to allow these cells to form tumors in NOD/SCID mice. Additionally, SK inhibition by transfection with a dominant-negative SK mutant or by treatment of cells with the non-specific SK inhibitor D-erythro-N,N-dimethylsphingosine blocks transformation mediated by oncogenic H-Ras (25). As abnormal activation of Ras frequently occurs in cancer, these findings suggest a significant role of SK in this disease. SK has also been linked to estrogen signaling (26) and estrogen-dependent tumorigenesis in MCF-7 cells (27). Other pathways or targets to which SK activity has been linked in cancer include vascular endothelial growth factor signaling via the Ras and mitogen-activated protein kinase pathway (28,29), protein kinase C (30), v-SRC (31), TNFα (32), hepatocyte nuclear factor-1 and retinoic acid receptor alpha (33), hypoxia inducible factor-1 alpha (34), intracellular calcium (35) and caspase activation (36). Angiogenic factors and processes, such as cell motility, mitogenesis in smooth muscle cells, endothelial cell differentiation and growth factor signaling are also affected by SK and S1P (37,38). While the elucidation of downstream targets of S1P remains an interesting problem in cell biology, sufficient validation of these pathways has been established to justify their evaluation as targets for new types of anticancer drugs. As S1P appears to be the most direct mitogenic messenger, inhibition of its production should have useful anti-proliferative effects on tumor cells. Results shown here are consistent with the hypothesis that SK inhibition suppresses colitis and colon cancer associated with colitis, and therefore, may have direct clinical utility as a chemopreventive agent in many sufferers of IBD.
Supplementary material
Supplementary Figures 1 and 2 can be found at http://carcin.oxfordjournals.org/
Funding
National Cancer Institute, National Institutes of Health, (1R03CA137736-01 L.J.H. and C.D.S.). Center for Colon Cancer Research, National Center for Research Resources, National Institutes of Health (P20RR17698-01) to Imaging/Histology core; Lipidomics Core at Medical University of South Carolina.
Supplementary Material
Acknowledgments
We thank the Statistical Core (Dr Edsel Pena, Director) and Mouse Core (Dr Marj Pena, Director) at University of South Carolina. Thanks also to Imaging/Histology Core supported by the Center for Colon Cancer Research and the Lipidomics Core at Medical University of South Carolina. Thanks also to Imaging/Histology Core supported by the Center for Colon Cancer Research, National Center for Research Resources, National Institutes of Health and the Lipidomics Core at Medical University of South Carolina.
Conflict of Interest Statement: None declared.
Glossary
Abbreviations
- AOM
azoxymethane
- DSS
dextran sulfate sodium
- ERK
extracellular signal-regulated kinase
- IBD
inflammatory bowel disease
- SK
sphingosine kinase
- S1P
sphingosine 1-phosphate
- Sph
sphingosine
- TNFα
tumor necrosis factor-alpha
References
- 1.Strober W, et al. The immunology of mucosal models of inflammation. Annu. Rev. Immunol. 2002;20:495–549. doi: 10.1146/annurev.immunol.20.100301.064816. [DOI] [PubMed] [Google Scholar]
- 2.He SH. Key role of mast cells and their major secretory products in inflammatory bowel disease. World J. Gastroenterol. 2004;10:309–318. doi: 10.3748/wjg.v10.i3.309. [DOI] [PMC free article] [PubMed] [Google Scholar]
- 3.Xia P, et al. Tumor necrosis factor-alpha induces adhesion molecule expression through the sphingosine kinase pathway. Proc. Natl Acad. Sci. USA. 1998;95:14196–14201. doi: 10.1073/pnas.95.24.14196. [DOI] [PMC free article] [PubMed] [Google Scholar]
- 4.Hanauer SB, et al. Human anti-tumor necrosis factor monoclonal antibody (adalimumab) in Crohn's disease: the CLASSIC-I trial. Gastroenterology. 2006;130:323–333. doi: 10.1053/j.gastro.2005.11.030. quiz 591. [DOI] [PubMed] [Google Scholar]
- 5.Mathias S, et al. Signal transduction of stress via ceramide. Biochem. J. 1998;335:465–480. doi: 10.1042/bj3350465. [DOI] [PMC free article] [PubMed] [Google Scholar]
- 6.Yatomi Y, et al. Sphingosine-1-phosphate: a platelet-activating sphingolipid released from agonist-stimulated human platelets. Blood. 1995;86:193–202. [PubMed] [Google Scholar]
- 7.Pettus BJ, et al. The sphingosine kinase 1/sphingosine-1-phosphate pathway mediates COX-2 induction and PGE2 production in response to TNF-alpha. FASEB J. 2003;17:1411–1421. doi: 10.1096/fj.02-1038com. [DOI] [PubMed] [Google Scholar]
- 8.MacKinnon AC, et al. Sphingosine kinase: a point of convergence in the action of diverse neutrophil priming agents. J. Immunol. 2002;169:6394–6400. doi: 10.4049/jimmunol.169.11.6394. [DOI] [PubMed] [Google Scholar]
- 9.Jolly PS, et al. Transactivation of sphingosine-1-phosphate receptors by FcepsilonRI triggering is required for normal mast cell degranulation and chemotaxis. J. Exp. Med. 2004;199:959–970. doi: 10.1084/jem.20030680. [DOI] [PMC free article] [PubMed] [Google Scholar]
- 10.French KJ, et al. Pharmacology and antitumor activity of ABC294640, a selective inhibitor of sphingosine kinase-2. J. Pharmacol. Exp. Ther. 2010;333:129–139. doi: 10.1124/jpet.109.163444. [DOI] [PMC free article] [PubMed] [Google Scholar]
- 11.Maines LW, et al. Suppression of ulcerative colitis in mice by orally available inhibitors of sphingosine kinase. Dig. Dis. Sci. 2008;53:997–1012. doi: 10.1007/s10620-007-0133-6. [DOI] [PMC free article] [PubMed] [Google Scholar]
- 12.Wirtz S, et al. Chemically induced mouse models of intestinal inflammation. Nat. Protoc. 2007;2:541–546. doi: 10.1038/nprot.2007.41. [DOI] [PubMed] [Google Scholar]
- 13.Snider AJ, et al. A role for sphingosine kinase 1 in dextran sulfate sodium-induced colitis. FASEB J. 2009;23:143–152. doi: 10.1096/fj.08-118109. [DOI] [PMC free article] [PubMed] [Google Scholar]
- 14.Kotakadi VS, et al. Ginkgo biloba extract EGb 761 has anti-inflammatory properties and ameliorates colitis in mice by driving effector T cell apoptosis. Carcinogenesis. 2008;29:1799–1806. doi: 10.1093/carcin/bgn143. [DOI] [PMC free article] [PubMed] [Google Scholar]
- 15.Beljanski V, et al. A novel sphingosine kinase inhibitor induces autophagy in tumor cells. J. Pharmacol. Exp. Ther. 2010;333:454–464. doi: 10.1124/jpet.109.163337. [DOI] [PMC free article] [PubMed] [Google Scholar]
- 16.Hannun YA, et al. Principles of bioactive lipid signalling: lessons from sphingolipids. Nat. Rev. Mol. Cell Biol. 2008;9:139–50. doi: 10.1038/nrm2329. [DOI] [PubMed] [Google Scholar]
- 17.Kim D, et al. Akt: versatile mediator of cell survival and beyond. J. Biochem. Mol. Biol. 2002;35:106–115. doi: 10.5483/bmbrep.2002.35.1.106. [DOI] [PubMed] [Google Scholar]
- 18.Fu DG, et al. [Change from inflammation to carcinoma in ukcerative colitis: the role of PTEN/PI3K/AKT] Sichuan Da Xue Xue Bao Yi Xue Ban. 2009;40:1021–1023. 1052. [PubMed] [Google Scholar]
- 19.Brown JB, et al. Mesalamine inhibits epithelial beta-catenin activation in chronic ulcerative colitis. Gastroenterology. 2009;138:595–605. doi: 10.1053/j.gastro.2009.10.038. [DOI] [PMC free article] [PubMed] [Google Scholar]
- 20.Peng XD, et al. Inhibition of phosphoinositide 3-kinase ameliorates dextran sodium sulfate-induced colitis in mice. J. Pharmacol. Exp. Ther. 2009;332:46–56. doi: 10.1124/jpet.109.153494. [DOI] [PubMed] [Google Scholar]
- 21.Youn J, et al. Resveratrol and piceatannol inhibit iNOS expression and NF-kappa B activation in dextran sulfate sodium-induced mouse colitis. Nutr. Cancer. 2009;61:847–854. doi: 10.1080/01635580903285072. [DOI] [PubMed] [Google Scholar]
- 22.Hoffmann M, et al. Enterococcus faecalis strains differentially regulate Alix/AIP1 protein expression and ERK 1/2 activation in intestinal epithelial cells in the context of chronic experimental colitis. J. Proteome Res. 2009;8:1183–1192. doi: 10.1021/pr800785m. [DOI] [PubMed] [Google Scholar]
- 23.Kohno M, et al. Intracellular role for sphingosine kinase 1 in intestinal adenoma cell proliferation. Mol. Cell. Biol. 2006;26:7211–7223. doi: 10.1128/MCB.02341-05. [DOI] [PMC free article] [PubMed] [Google Scholar]
- 24.Kawamori T, et al. Role for sphingosine kinase 1 in colon carcinogenesis. FASEB J. 2009;23:405–414. doi: 10.1096/fj.08-117572. [DOI] [PMC free article] [PubMed] [Google Scholar]
- 25.Xia P, et al. An oncogenic role of sphingosine kinase. Curr. Biol. 2000;10:1527–1530. doi: 10.1016/s0960-9822(00)00834-4. [DOI] [PubMed] [Google Scholar]
- 26.Sukocheva OA, et al. Sphingosine kinase transmits estrogen signaling in human breast cancer cells. Mol. Endocrinol. 2003;17:2002–2012. doi: 10.1210/me.2003-0119. [DOI] [PubMed] [Google Scholar]
- 27.Nava VE, et al. Sphingosine kinase type 1 promotes estrogen-dependent tumorigenesis of breast cancer MCF-7 cells. Exp. Cell Res. 2002;281:115–127. doi: 10.1006/excr.2002.5658. [DOI] [PubMed] [Google Scholar]
- 28.Shu X, et al. Sphingosine kinase mediates vascular endothelial growth factor-induced activation of ras and mitogen-activated protein kinases. Mol. Cell. Biol. 2002;22:7758–7768. doi: 10.1128/MCB.22.22.7758-7768.2002. [DOI] [PMC free article] [PubMed] [Google Scholar]
- 29.Wu W, et al. VEGF receptor expression and signaling in human bladder tumors. Oncogene. 2003;22:3361–3370. doi: 10.1038/sj.onc.1206285. [DOI] [PubMed] [Google Scholar]
- 30.Nakade Y, et al. Regulation of sphingosine kinase 1 gene expression by protein kinase C in a human leukemia cell line, MEG-O1. Biochim. Biophys. Acta. 2003;1635:104–116. doi: 10.1016/j.bbalip.2003.11.001. [DOI] [PubMed] [Google Scholar]
- 31.Sobue S, et al. v-Src oncogene product increases sphingosine kinase 1 expression through mRNA stabilization: alteration of AU-rich element-binding proteins. Oncogene. 2008;27:6023–6033. doi: 10.1038/onc.2008.198. [DOI] [PubMed] [Google Scholar]
- 32.Vann LR, et al. Involvement of sphingosine kinase in TNF-alpha-stimulated tetrahydrobiopterin biosynthesis in C6 glioma cells. J. Biol. Chem. 2002;277:12649–12656. doi: 10.1074/jbc.M109111200. [DOI] [PubMed] [Google Scholar]
- 33.Osawa Y, et al. Sphingosine kinase regulates hepatoma cell differentiation: roles of hepatocyte nuclear factor and retinoid receptor. Biochem. Biophys. Res. Commun. 2001;286:673–677. doi: 10.1006/bbrc.2001.5451. [DOI] [PubMed] [Google Scholar]
- 34.Ader I, et al. Sphingosine kinase 1: a new modulator of hypoxia inducible factor 1alpha during hypoxia in human cancer cells. Cancer Res. 2008;68:8635–8642. doi: 10.1158/0008-5472.CAN-08-0917. [DOI] [PubMed] [Google Scholar]
- 35.Wheldon LM, et al. Inositol 1,4,5-trisphosphate-independent calcium signalling by platelet-derived growth factor in the human SH-SY5Y neuroblastoma cell. Cell Calcium. 2001;30:95–106. doi: 10.1054/ceca.2001.0217. [DOI] [PubMed] [Google Scholar]
- 36.Edsall LC, et al. Sphingosine kinase expression regulates apoptosis and caspase activation in PC12 cells. J. Neurochem. 2001;76:1573–1584. doi: 10.1046/j.1471-4159.2001.00164.x. [DOI] [PubMed] [Google Scholar]
- 37.Lee MJ, et al. Vascular endothelial cell adherens junction assembly and morphogenesis induced by sphingosine-1-phosphate. Cell. 1999;99:301–312. doi: 10.1016/s0092-8674(00)81661-x. [DOI] [PubMed] [Google Scholar]
- 38.Bergelin N, et al. Sphingosine kinase as an oncogene: autocrine sphingosine 1-phoshate modulates ML-1 thyroid carcinoma cell migration by a mechanism dependent on PKC-{alpha} and ERK1/2. Endocrinology. 2008;150:2055–2063. doi: 10.1210/en.2008-0625. [DOI] [PubMed] [Google Scholar]
Associated Data
This section collects any data citations, data availability statements, or supplementary materials included in this article.