Abstract
Activating oncogenic mutations of receptor tyrosine kinases (RTKs) have been reported in several types of cancers. In many cases, genomic rearrangements lead to the fusion of unrelated genes to the DNA coding for the kinase domain of RTKs. All RTK-derived fusion proteins reported so far display oligomerization sequences within the 5′ fusion partners that are responsible for oncogenic activation. Here, we report a mechanism by which an altered RTK gains oncogenic potential in a glioblastoma cell line. A microdeletion on 6q21 results in the fusion of FIG, a gene coding for a Golgi apparatus-associated protein, to the kinase domain of the protooncogene c-ROS. The fused protein product FIG-ROS is a potent oncogene, and its transforming potential resides in its ability to interact with and become localized to the Golgi apparatus. Thus we have found a RTK fusion protein whose subcellular location leads to constitutive kinase activation and results in oncogenic transformation.
Receptor tyrosine kinases (RTKs) function as key regulators of normal cellular physiology and are also involved in the development and progression of human cancers. Oncogenic activations of RTKs are often the result of genetic lesions such as point mutations, overexpression, and structural genomic rearrangements (for recent reviews see refs. 1 and 2). Of the 58 known human RTKs, 8 have been shown to be involved in in-frame fusion events where unrelated sequences fused 5′ to the sequence coding for the tyrosine kinase domain lead to the production of a constitutively activated kinase. The vast majority of such events has been characterized in hematological malignancies and is the result of chromosomal translocations or inversions (1). In all cases reported, the resulting fusion protein displays a constitutive tyrosine kinase activity attributable to dimerization domains found within the amino-terminal fusion partner. By creating such forced dimers, the catalytic kinase domains are thus juxtaposed in an optimal orientation for transphosphorylation somewhat similar to that of ligand-induced receptor dimers.
Generally, RTK-derived oncofusion proteins have no other mutations within the kinase moiety, suggesting an activation of signal transduction pathways qualitatively identical to their full-length receptor counterparts. However, these fusion kinases do not localize to the plasma membrane but are instead found within the cytosol. The possibility that the fusion protein can signal by a mechanism different from that of its normal RTK counterpart raises the following basic question: can subcellular localization of an oncogene product be an important determinant for neoplastic transformation?
The transmembrane RTK ROS shows a specific profile of expression restricted primarily to distinct epithelial cells during embryonic development (3–6). ROS is a 260-kDa glycoprotein receptor for which no ligand is known. ROS was discovered concomitantly through genomic DNA transfer transformation experiments (7) and as the oncogenic agent in the avian sarcoma retrovirus UR2 (8). These experiments showed that deregulated ROS expression can result in cellular transformation. Interestingly, ectopic expression of c-Ros has been reported in meningiomas and astrocytomas, suggesting a possible role for ROS in these CNS malignancies (9–11). However, to this date, naturally occurring activating mutations of ROS have never been reported in mammalian cells.
We have recently identified a gene called FIG that encodes a protein that peripherally associates with the Golgi apparatus and likely plays a role in Golgi function (12). The transcript of this gene has been reported as a 5′ fusion partner to the RTK ROS in the U118MG glioblastoma cell line (13). Here we establish a functional significance for this ROS fusion partner in relation to cellular transformation. We demonstrate that, analogous to RTK fusions observed in hematological malignancies, this FIG-ROS fusion protein is constitutively activated. We also show that this activation is unlike any other fusion proteins involving RTKs reported to date; that is, the constitutive activation of FIG-ROS requires localization to the Golgi apparatus. Deletion of FIG sequences crucial for Golgi localization from the fusion protein eliminates the transformation capacity of FIG-ROS.
Materials and Methods
Antibodies.
Production and characterization of the rabbit polyclonal FIG antiserum has been described elsewhere (12). The following antibodies were obtained from commercial sources: anti-c-Myc epitope monoclonal antibody 9E10 (Santa Cruz Biotechnology), anti-phosphotyrosine mouse monoclonal antibody PY20 (Transduction Laboratories), and anti-β-COP rabbit polyclonal antibody (Affinity BioReagents, Golden, CO).
Plasmids and Retroviruses.
Derivation of the full-length U118MG-derived FIG-ROS cDNA is described in Supporting Materials and Methods, which is published as supporting information on the PNAS web site, www.pnas.org. The tyrosine-to-phenylalanine mutants and the ATP-binding lysine-511-to-methionine mutant were generated by site-directed mutagenesis with the QuickChange Mutagenesis kit (Invitrogen). The Δ coiled-coil mutant was created by amplifying by PCR a portion of FIG from amino acid 208 to amino acid 454. This fragment was ligated back into KpnI-digested FIG cDNA, thereby deleting amino acids 146–207. FIG-ROS cDNAs were inserted in the retrovirus vector pLXSN (14) and transfected into Phoenix cells (Gary Nolan, Stanford University, Stanford, CA). Helper-free retroviruses were harvested 3–5 days after transfection and used to infect Rat1 cells as described (15). Monoclonal cell lines were isolated by selecting individual G418-resistant colonies.
Transformation Assays.
Equal numbers of cells (104) from each individual clone were plated in triplicate onto 60-mm dishes, and viable cells were counted at 2-day intervals for 8 days by using trypan blue exclusion and a hemocytometer. The saturation densities were determined from the plateau phase of growth, which occurred at 8 days after seeding. Contact inhibition was tested by mixing 102 cells of each FIG-ROS clonal Rat1 variant with 103 normal Rat1 cells in 60-mm dishes and growing them for 15 days, at which point the monolayers were washed, fixed, and stained with 0.5% methylene blue in methanol. Adherence-independent growth was studied by plating 103 cells of each clonal retroviral FIG-ROS variant in semisolid medium. Fresh medium was added every 4 days and colonies were counted after 12–16 days. Assays of tumorigenicity in nude mice were performed as previously described (16).
Phosphopeptide Mapping, Protein Preparations, Immunoprecipitations, in Vitro Kinase Assays, Western Blot Analysis, and Indirect Immunofluorescence.
Phosphopeptide mapping was carried out essentially according to previously published methods (17). Protein preparations were obtained as described (12). Protein extracts and immunoprecipitates were separated by SDS/PAGE and electrotransferred to Immobilon P membrane (Millipore) according to the manufacturer's directions. Western blot analyses were performed with the indicated primary antibodies at dilution typically ranging from 1:500 to 1:1,000 and detected by enhanced chemiluminescence (ECL) (Renaissance, NEN-DuPont). In vitro kinase assays were performed as described elsewhere (18). Immunocytochemistry was performed according to published methods (12) with the following antibody dilutions: 9E10 1:1,000, anti-β-COP 1:500. These antibodies were subsequently incubated with CY3-conjugated goat anti-mouse IgG (1:1,000) and FITC-conjugated goat anti-rabbit IgG (1:200).
Density Gradient Ultracentrifugation and Subcellular Fractionation.
Cell lysates from Cos-1 cells transiently expressing FIG-ROS proteins prepared in CSK buffer (100 mM KCl/10 mM Pipes [piperazine-N,N′-bis(2-ethanesulfonic acid), pH 7.0]/0.5% Nonidet P-40/300 mM sucrose/3 mM MgCl2) supplemented with 10 mM iodoacetamide and protease inhibitors were layered over 4.5-ml gradients of 5–20% sucrose containing 100 mM NaCl, 20 mM Tris⋅HCl (pH 7.5), and 0.1% Nonidet P-40. Gradients were centrifuged at 38,000 rpm in a Beckman SW55 rotor for 16 h at 4°C. Fractions (250 μl) were collected from the bottom of the gradient by dripping and assayed for the presence of p109FIG-ROS and p59FIG by Western blot analysis. Subcellular fractionation was performed with lysates from retrovirus-infected Rat1 clones according to Graham and Rickwood (19).
Results
A Peripherally Associated Golgi Protein Is Fused to the Kinase Domain of c-ROS in a Glioblastoma Cell Line.
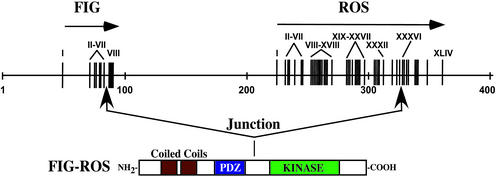
A small, 240-kb, interstitial deletion on chromosome 6q21 leads to the fusion of a ubiquitously expressed gene called FIG to the DNA coding for the tyrosine kinase domain of the protooncogene c-ROS in the human glioblastoma cell line U118MG (unpublished results). This genomic rearrangement results in an in-frame fusion of exon 7 of FIG and exon 36 of ROS (Fig. 1). Ninety percent of FIG sequences are retained in the FIG-ROS fusion protein, including the two coiled-coil motifs and the PDZ domain. In addition, the kinase domain of ROS remains intact, suggesting retention of kinase activity. We tested for such activity in an in vitro kinase assay and determined that indeed the FIG-ROS fusion protein is an active kinase (data not shown).
Figure 1.
The ROS gene is rearranged in a human glioblastoma cell line. Shown is a schematic representation of FIG and ROS genomic DNA locus along with the predicted U118MG-derived FIG-ROS fusion hybrid protein. Numbered vertical bars represent exons for each gene.
FIG-ROS Is an Oncoprotein.
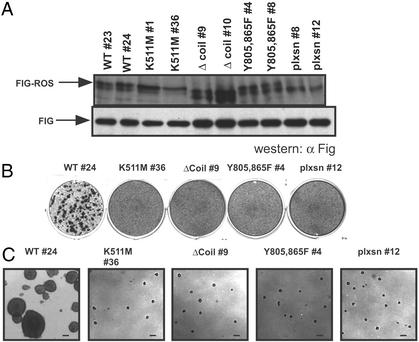
We wished to test FIG-ROS for its capacity for cellular transformation. To this end, we infected Rat1 cells with retroviral expression constructs containing FIG-ROS. A pLXSN vector lacking FIG-ROS cDNA sequences was used as a negative control. After infection, neomycin (G418)-resistant colonies were isolated and characterized. Cells expressing FIG-ROS grew to a higher saturation density (2-fold) relative to negative control cell lines (data not shown), which indicates a reduction in contact inhibition for these cells. To test for the effect of FIG-ROS expression on the capacity of cells to overcome saturation-dependent growth arrest, 102 cells from FIG-ROS-expressing clones were mixed in with 103 parental Rat1 cells, grown for 15 days, and then assayed for the presence of foci (Fig. 2B). Foci were observed in large numbers from FIG-ROS-expressing cells, whereas none were observed in the negative control. We then tested the FIG-ROS-expressing cells for their ability to grow in an anchorage-independent milieu. FIG-ROS-expressing cells are capable of sustained growth in soft agar (Fig. 2C). These experiments demonstrate that FIG-ROS is capable of transforming Rat1 cells in vitro. To further examine the tumorigenic transformation capacity of FIG-ROS, we examined the ability of FIG-ROS-expressing Rat1 cells to form tumors when injected in immunocompromised mice. When 105 FIG-ROS-expressing clonally derived Rat1 cells were injected into the flanks of nude mice (CD1 nu/nu), tumors developed within a relatively short latent period (20–25 days). Tumors were never found in mice injected with pLXSN vector control Rat1 clones (Table 1). Histopathology of the tumors revealed that they are malignant fibrosarcomas (data not shown).
Figure 2.
FIG-ROS is an active oncogene. Rat1 cells infected with retroviral stocks carrying the indicated FIG-ROS variants were clonally derived after G418/neomycin drug selection. Two cell lines from each FIG-ROS isoform were selected for analysis. (A) Western blot of total cell lysates from cell lines expressing the indicated FIG-ROS variants incubated with an anti-FIG antibody recognizing p109FIG-ROS (Upper) and endogenous p59FIG (Lower). (B and C) Analysis of loss of contact inhibition (B) and anchorage-independent growth (C) of cell lines expressing FIG-ROS variants. Shown are single picture of triplicates for a single clone of each FIG-ROS variant. (Scale bar = 250 μm.)
Table 1.
FIG-ROS-transformed cells form tumors in nude mice
| Construct (clone no.) | No. of tumors formed/no. of mice |
|---|---|
| FIG-ROS WT (23) | 2/2 |
| FIG-ROS WT (24) | 2/2 |
| FIG-ROS K511M (34) | 0/2 |
| FIG-ROS K511M (36) | 0/2 |
| FIG-ROS Δcoil (7) | 0/2 |
| FIG-ROS Δcoil (9) | 0/2 |
| FIG-ROS Y805,865F (3) | 1/2 |
| FIG-ROS Y805,865F (4) | 0/2 |
| pLXSN control (8) | 0/2 |
| pLXSN control (12) | 0/2 |
NIH Swiss nu/nu mice were injected subcutaneously with 105 cells in 100 μl of PBS in the left posterior flank region. The average latency of tumor development is 25 days. Mice that did not develop tumors were observed for 80 days.
Mapping of FIG-ROS Major Autophosphorylation Sites.
Tyrosine kinases exert their full biological activity through tyrosine phosphorylation. Autophosphorylation of specific tyrosine residues is a crucial event in the activation of distinct signal transduction pathways (for a recent review see ref. 20). A great deal of information pertaining to the function for a given tyrosine kinase can be derived from the knowledge of its phosphorylation sites. To gain insight into the biological relevance of specific phosphotyrosine residues, we analyzed FIG-ROS potential autophosphorylation sites. From the 24 tyrosine residues in FIG-ROS (Fig. 6, which is published as supporting information on the PNAS web site), we focused our attention on four (Y554, Y623, Y805, and Y865) because they simultaneously conform to the profile of phosphorylation site residue preferences of tyrosine kinases (21) and represent potential SH2 and PTB domain recognition binding sites (22–24). We mutated each of these four tyrosine residues individually to phenylalanine by site-directed mutagenesis and conducted a series of phosphopeptide mapping experiments on wild-type and single tyrosine residue-mutated FIG-ROS variants as described in Materials and Methods. None of the tyrosine mutants showed decreased kinase activity in vitro (data not shown). By comparing the tryptic phosphopeptide maps of the mutants to each other and to nonmutated FIG-ROS, we found that the tyrosine residues Y805 and Y865 are the major autophosphorylation sites of FIG-ROS (Fig. 6).
FIG-ROS Kinase Activity and Phosphorylation at Y805 and Y865 Are Necessary for Transformation.
It has been shown for several RTK-derived fusion proteins that specific autophosphorylation sites are required to convey oncogenicity (25–27). Therefore, we ascertained the requirements, if any, for an intact kinase activity and phosphorylation on both Y805 and Y865 of FIG-ROS during transformation. A tyrosine kinase inactive mutant of FIG-ROS, where the ATP-binding lysine residue at position 511 was mutated to a methionine residue (K511M), and a Y805,865F double autophosphorylation sites mutant version of FIG-ROS were cloned in the retroviral expression vector pLXSN and assayed for transformation as described above (Fig. 2). The amount of FIG-ROS protein in the different variant clones as determined by Western blot analysis of cell extracts is comparable to those of unmodified wild-type FIG-ROS (Fig. 2A). The failure of the K511M version of FIG-ROS to elicit cellular transformation indicates that the kinase activity of FIG-ROS is an essential component of its cellular transformation potential. Similarly, the inability of the dual phosphotyrosine mutant version of FIG-ROS (Y805,865F) to invoke transformation demonstrates that the signaling events emanating from these two phosphotyrosine sites are necessary for transformation.
FIG-ROS Exists as a Monomer in Vivo.
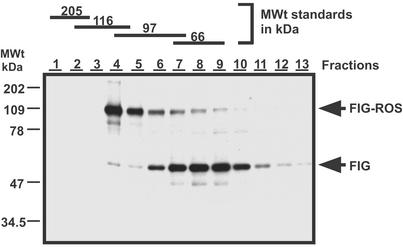
Ligand-triggered activation of RTKs is mediated by receptor dimerization. This event is necessary for a full induction of catalytic activity, which results in interactions with substrates and, subsequently, in the induction of a given signal transduction pathway. FIG-ROS-constitutive kinase activity may reflect its ability to form dimers. FIG contains two coiled-coil domains and a leucine zipper. Coiled-coil domains and leucine zippers have both been shown to mediate homo- and heterodimerization of protein (28). To examine whether direct homodimerization is involved in kinase activation, we investigated whether oligomers of FIG-ROS form in vivo. Protein lysates isolated from COS-1 cells transiently expressing FIG-ROS were separated by sucrose density gradient fractionation. Cells were lysed in nondenaturing conditions, and the sedimentation profiles of both FIG and FIG-ROS were determined by Western blot analysis of fractions collected from a 5–20% sucrose gradient (Fig. 3). Both endogenous p59FIG and transfected p109FIG-ROS products are found distributed over a limited number of gradient fractions with peaks corresponding to 60 and 110 kDa, respectively. In both cases, the observed peak sizes correspond to those of monomers.
Figure 3.
Both p59FIG and p109FIG-ROS exist as monomers in vivo. Cells expressing FIG-ROS were lysed under nondenaturing conditions and proteins were separated on 5–20% sucrose gradients. Fractions were collected and FIG and FIG-ROS proteins were detected by Western blot analysis using an anti-FIG antibody as described in Materials and Methods. The numbers above each lane correspond to fraction numbers from the heaviest to the lightest portion of the gradient. Molecular size standards were included in a control gradient run in parallel and the fractions at which they eluted are indicated at the top.
FIG-ROS Oncogenic Activation Requires Targeting to the Golgi Apparatus.
The presence of unrelated sequences within several RTK fusion proteins has proven to play the determinant role in the constitutive activation of the kinase domain. For many fusion RTKs, oncogenic initiation is dictated by these 5′ fusion sequences (18, 29–33). We have demonstrated that FIG sequences do not convey homodimerizing properties to FIG-ROS (Fig. 3). However, the second coiled-coil domain of FIG mediates Golgi targeting (12), which raises the question: can localization of FIG-ROS to the Golgi apparatus be necessary to evoke cellular transformation? To address this issue, we created a mutant FIG-ROS cDNA in which the second coiled-coil domain is deleted (Δcoil) and expressed it by retroviral infection of Rat1 cells.
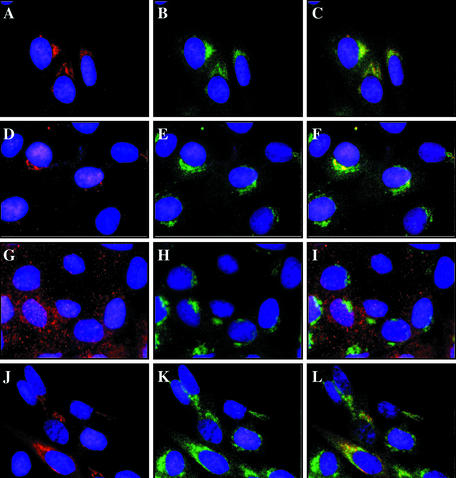
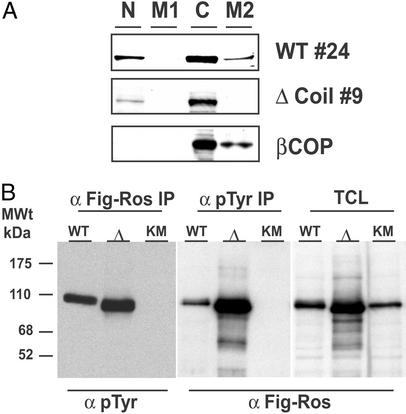
In the transformation assays in which it was tested, the Δcoil FIG-ROS variant failed to elicit cellular transformation (Fig. 2). We postulated that deletion of this domain from the FIG-ROS fusion protein would eliminate targeting to the Golgi apparatus. To ascertain the subcellular localization of the FIG-ROS variants used in the transformation assays, we performed indirect immunocytochemistry on the clonal retrovirus-infected Rat1 cells (Fig. 4). The staining pattern of FIG-ROS in these cells was compared with that of the Golgi marker β-COP. Wild-type (Fig. 4 A–C), kinase-inactive (Fig. 4 D–F), and the double autophosphorylation-site mutant Y805,865F (Fig. 4 J–L) FIG-ROS proteins all localize to the Golgi apparatus and colocalize with β-COP. However, the Δcoil FIG-ROS isoform (Fig. 4 G–I) does not target to the Golgi apparatus but rather is found dispersed throughout the cytoplasm. We confirmed this release of Golgi membrane association by cellular fractionation. Fig. 5A demonstrates that the portion of FIG-ROS protein associated with the Golgi fraction (M2) disappears when the second coiled-coil domain is absent.
Figure 4.
The second coiled-coil domain of FIG-ROS is necessary for targeting to the Golgi apparatus. Shown are indirect immunofluorescence micrographs of clonally derived Rat1 cells expressing the following FIG-ROS variants: unmodified wild-type no. 24 (A–C), K511M no. 1 (D–F), Δcoil no. 4 (G–I), and Y805,865F no. 1 (J–L). Cells were fixed and costained with the anti-c-Myc 9E10 epitope tag antibody (A, D, G, and J) and a rabbit anti-β-COP polyclonal antibody (B, E, H, and K) as described in Materials and Methods. The two sets were merged (C, F, I, and L) to indicate colocalization (yellow) of FIG-ROS and the Golgi apparatus marker β-COP. Nuclei are stained with 4′,6-diamidino-2-phenylindole (DAPI; blue).
Figure 5.
The Δcoil FIG-ROS mutant displays kinase activity and does not sediment with a Golgi membrane-containing fraction. Cell extracts from retrovirus-infected Rat1 clones were subjected to differential centrifugation cellular fractionation followed by Western blotting with an anti-FIG antibody as described in Materials and Methods (A) and immunoprecipitated with the indicated antibodies and Western blotted for the presence of phosphotyrosine residues (pTyr) and FIG-ROS as indicated (B). N, nuclear and unlysed low-speed fraction; M1, intermediate-speed plasma membrane-containing fraction; C, cytosolic fraction; M2, high-speed Golgi membrane-containing fraction; IP, immunoprecipitate; TCL, total cell lysate; Δ, Δcoil FIG-ROS isoform; KM, K511M FIG-ROS isoform.
The failure of the Δcoil FIG-ROS mutant to elicit a cellular transformation response is not due to an inability to display constitutive kinase activity. To control for the integrity of its kinase activity, we performed a series of in vitro kinase assays to test for its ability to self-phosphorylate. Fig. 5B demonstrates that the Δcoil FIG-ROS mutant is phosphorylated in vitro and displays intrinsic kinase activity similar to the wild-type FIG-ROS. These results demonstrate that FIG-ROS transformation activity requires localization to the Golgi apparatus.
Discussion
The observations presented here demonstrate that the mode of FIG-ROS activation is different from that of other receptor-derived tyrosine kinase fusion proteins. The critical requirement for Golgi targeting by the second coiled-coil domain to convey cellular transformation indicates that signaling pathways required for transformation can be initiated by a tyrosine kinase when localized at Golgi membranes. The ability displayed by FIG-ROS to localize to the Golgi apparatus and to exert an oncogenic activity demonstrates the occurrence of a transforming event in which signaling originates from that subcellular location.
Our findings raise the question of how FIG-ROS becomes activated at the Golgi apparatus. One hypothesis is that the directed targeting of FIG-ROS to the Golgi results in an increased local concentration of the fusion kinase sufficient to create a microenvironment in which self-activation occurs without active physical dimerization. Alternatively, FIG-ROS dimerization or oligomerization could be mediated by a membrane-bound Golgi protein or protein complex that would simultaneously interact with more than one FIG-ROS molecule. However, if an interaction of this type is critical for FIG-ROS activation, then its strength is not sufficient to be sustained in a velocity centrifugation experiment. If interaction with a Golgi protein is a critical element in FIG-ROS activation, then the Golgi SNARE protein syntaxin 6 is a likely candidate. FIG has been shown to interact with syntaxin 6 through its second coiled-coil domain (12), which we have shown to be required for cellular transformation by FIG-ROS. Whether syntaxin 6 is the sole element responsible for FIG's Golgi targeting and by analogy the only element likely to be responsible for localization of FIG-ROS to the Golgi apparatus remains to be determined.
Almost all of the RTK-derived fusion proteins lack the transmembrane domain and are therefore assumed to be prevalently cytosolic. Of the 29 RTK-derived fusion proteins, a few have been characterized for their subcellular localization. Tel-PDGFRβ (34), Hip-PDGFRβ (32), FIM-FGFR1 (31), CEP110-FGFR1 (35), TFG-NTRK1 (36), and TPR-MET (37) are indeed cytosolic and all exist in a constitutively active state. Most of the effector proteins involved in RTK-mediated signal transductions are redistributed to the plasma membrane after activation of RTKs. One may imagine that the mislocalization of an activated tyrosine kinase from the plasma membrane to the cytoplasm or other subcellular location can result in a selective defect in the activation of membrane-based signal transduction pathways. Thus an important point to address is how, if at all, mislocalized fusion proteins induce plasma membrane-derived signaling pathways in a manner similar to that of their full-length receptor counterparts. Only recently have examples of such comparison been addressed. The MET receptor and its oncogenic variant TPR-MET appear to signal through the same pathways, using an identical set of signaling molecules (37). The biological activity of TFG-NTRK1 seems to mirror the signaling patterns of NTRK1 (25). On the other hand, FOP-FGFR1 signaling is much different from FGFR1 itself (38). Similarly, Tel-PDGFRβ and PDGFRβ signal differently (39) and Hip-PDGFRβ transforms through different pathways than native PDGFRβ (32).
Ligand-mediated stimulation of artificial chimeric ROS receptors results in the phosphorylation and activation of the insulin receptor substrate 1 (IRS1), phospholipase Cγ, and SHC proteins in fibroblast cells (40–42). It is possible that Golgi-associated FIG-ROS signal transduction pathways are similar those of membrane-bound ROS. Conversely, FIG-ROS's association with the Golgi apparatus may also result in a completely unique and different signaling pathway emanating from Golgi-specific proteins.
Understanding transformation by FIG-ROS and the signaling systems necessary for this event may have broader implications for the perception of oncogenic processes. Cytogenetic events such as the chromosomal deletion described here may be frequent contributors to oncogenesis in solid tumors. However, the identification of chromosomal events that lead to fusion proteins may have been restricted primarily to hematological malignancies to date because of the technical difficulties associated with carrying out careful karyotypic analysis in solid tumors and the view that translocations, inversions, and deletions were not of major importance in such tumors. The results presented here suggest not only that such events may be contributory to oncogenesis in solid tumors but also that novel mechanisms for creating oncogenic fusion proteins may occur in such tumors. Because receptor tyrosine kinases are promising targets for therapeutic interventions, the identification and characterization of events such as the one described here represent a valuable approach to the development of novel and effective pharmacological strategies for the therapeutic management of solid tumors.
Supplementary Material
Acknowledgments
We thank Alex Kazantsev and Julian Borrow for critical review of the manuscript. This work was supported in part by the National Cancer Institute of Canada Terry Fox Postdoctoral Fellowship, by a Medical Research Council of Canada Postdoctoral Fellowship Award (to A.C.), by the U.S. National Institutes of Health (Grant 2-P01-CA42063-16 to D.H.), and by the Virginia & D. K. Ludwig Fund for Cancer Research (to A.C. and D.H.).
Abbreviation
- RTK
receptor tyrosine kinase
References
- 1.Blume-Jensen P, Hunter T. Nature. 2001;411:355–365. doi: 10.1038/35077225. [DOI] [PubMed] [Google Scholar]
- 2.Lamorte L, Park M. Surg Oncol Clin North Am. 2001;10:271–288. , viii. [PubMed] [Google Scholar]
- 3.Sonnenberg E, Godecke A, Walter B, Bladt F, Birchmeier C. EMBO J. 1991;10:3693–3702. doi: 10.1002/j.1460-2075.1991.tb04937.x. [DOI] [PMC free article] [PubMed] [Google Scholar]
- 4.Sonnenberg-Riethmacher E, Walter B, Riethmacher D, Godecke S, Birchmeier C. Genes Dev. 1996;10:1184–1193. doi: 10.1101/gad.10.10.1184. [DOI] [PubMed] [Google Scholar]
- 5.Liu Z Z, Wada J, Kumar A, Carone F A, Takahashi M, Kanwar Y S. Dev Biol. 1996;178:133–148. doi: 10.1006/dbio.1996.0204. [DOI] [PubMed] [Google Scholar]
- 6.Chen J, Zong C S, Wang L H. Oncogene. 1994;9:773–780. [PubMed] [Google Scholar]
- 7.Birchmeier C, Birnbaum D, Waitches G, Fasano O, Wigler M. Mol Cell Biol. 1986;6:3109–3116. doi: 10.1128/mcb.6.9.3109. [DOI] [PMC free article] [PubMed] [Google Scholar]
- 8.Matsushime H, Wang L H, Shibuya M. Mol Cell Biol. 1986;6:3000–3004. doi: 10.1128/mcb.6.8.3000. [DOI] [PMC free article] [PubMed] [Google Scholar]
- 9.Watkins D, Dion F, Poisson M, Delattre J Y, Rouleau G A. Cancer Genet Cytogenet. 1994;72:130–136. doi: 10.1016/0165-4608(94)90128-7. [DOI] [PubMed] [Google Scholar]
- 10.Wu J K, Chikaraishi D M. Cancer Res. 1990;50:3032–3035. [PubMed] [Google Scholar]
- 11.Zhao J F, Sharma S. Cancer Genet Cytogenet. 1995;83:148–154. doi: 10.1016/0165-4608(95)00043-o. [DOI] [PubMed] [Google Scholar]
- 12.Charest A, Lane K, McMahon K, Housman D E. J Biol Chem. 2001;276:29456–29465. doi: 10.1074/jbc.M104137200. [DOI] [PubMed] [Google Scholar]
- 13.Sharma S, Birchmeier C, Nikawa J, O'Neill K, Rodgers L, Wigler M. Oncogene Res. 1989;5:91–100. [PubMed] [Google Scholar]
- 14.Miller A D, Rosman G J. BioTechniques. 1989;7:980–982. , 984–986, 989–990. [PMC free article] [PubMed] [Google Scholar]
- 15.Kriegler M. Gene Transfer and Expression. New York: Stockton; 1990. [Google Scholar]
- 16.Bookstein R, Shew J Y, Chen P L, Scully P, Lee W H. Science. 1990;247:712–715. doi: 10.1126/science.2300823. [DOI] [PubMed] [Google Scholar]
- 17.Boyle W J, van der Geer P, Hunter T. Methods Enzymol. 1991;201:110–149. doi: 10.1016/0076-6879(91)01013-r. [DOI] [PubMed] [Google Scholar]
- 18.Rodrigues G A, Park M. Mol Cell Biol. 1993;13:6711–6722. doi: 10.1128/mcb.13.11.6711. [DOI] [PMC free article] [PubMed] [Google Scholar]
- 19.Graham J M, Rickwood D. Subcellular Fractionation: A Practical Approach. Washington, DC: IRL; 1997. [Google Scholar]
- 20.Pawson T, Nash P. Genes Dev. 2000;14:1027–1047. [PubMed] [Google Scholar]
- 21.Songyang Z, Gish G, Mbamalu G, Pawson T, Cantley L C. J Biol Chem. 1995;270:26029–26032. doi: 10.1074/jbc.270.44.26029. [DOI] [PubMed] [Google Scholar]
- 22.Songyang Z. Prog Biophys Mol Biol. 1999;71:359–372. doi: 10.1016/s0079-6107(98)00045-5. [DOI] [PubMed] [Google Scholar]
- 23.Songyang Z, Shoelson S E, McGlade J, Olivier P, Pawson T, Bustelo X R, Barbacid M, Sabe H, Hanafusa H, Yi T, et al. Mol Cell Biol. 1994;14:2777–2785. doi: 10.1128/mcb.14.4.2777. [DOI] [PMC free article] [PubMed] [Google Scholar]
- 24.Songyang Z, Shoelson S E, Chaudhuri M, Gish G, Pawson T, Haser W G, King F, Roberts T, Ratnofsky S, Lechleider R J, et al. Cell. 1993;72:767–778. doi: 10.1016/0092-8674(93)90404-e. [DOI] [PubMed] [Google Scholar]
- 25.Roccato E, Miranda C, Ranzi V, Gishizki M, Pierotti M A, Greco A. Br J Cancer. 2002;87:645–653. doi: 10.1038/sj.bjc.6600544. [DOI] [PMC free article] [PubMed] [Google Scholar]
- 26.Sattler M, Mohi M G, Pride Y B, Quinnan L R, Malouf N A, Podar K, Gesbert F, Iwasaki H, Li S, Van Etten R A, et al. Cancer Cell. 2002;1:479–492. doi: 10.1016/s1535-6108(02)00074-0. [DOI] [PubMed] [Google Scholar]
- 27.Fixman E D, Naujokas M A, Rodrigues G A, Moran M F, Park M. Oncogene. 1995;10:237–249. [PubMed] [Google Scholar]
- 28.Burkhard P, Stetefeld J, Strelkov S V. Trends Cell Biol. 2001;11:82–88. doi: 10.1016/s0962-8924(00)01898-5. [DOI] [PubMed] [Google Scholar]
- 29.Carroll M, Tomasson M H, Barker G F, Golub T R, Gilliland D G. Proc Natl Acad Sci USA. 1996;93:14845–14850. doi: 10.1073/pnas.93.25.14845. [DOI] [PMC free article] [PubMed] [Google Scholar]
- 30.Greco A, Miranda C, Pagliardini S, Fusetti L, Bongarzone I, Pierotti M A. Genes Chromosomes Cancer. 1997;19:112–123. [PubMed] [Google Scholar]
- 31.Ollendorff V, Guasch G, Isnardon D, Galindo R, Birnbaum D, Pebusque M J. J Biol Chem. 1999;274:26922–26930. doi: 10.1074/jbc.274.38.26922. [DOI] [PubMed] [Google Scholar]
- 32.Ross T S, Gilliland D G. J Biol Chem. 1999;274:22328–22336. doi: 10.1074/jbc.274.32.22328. [DOI] [PubMed] [Google Scholar]
- 33.Xiao S, McCarthy J G, Aster J C, Fletcher J A. Blood. 2000;96:699–704. [PubMed] [Google Scholar]
- 34.Jousset C, Carron C, Boureux A, Quang C T, Oury C, Dusanter-Fourt I, Charon M, Levin J, Bernard O, Ghysdael J. EMBO J. 1997;16:69–82. doi: 10.1093/emboj/16.1.69. [DOI] [PMC free article] [PubMed] [Google Scholar]
- 35.Guasch G, Popovici C, Mugneret F, Chaffanet M, Pontarotti P, Birnbaum D, Pebusque M J. Blood. 2003;10:286–288. doi: 10.1182/blood-2002-02-0577. [DOI] [PubMed] [Google Scholar]
- 36.Greco A, Mariani C, Miranda C, Lupas A, Pagliardini S, Pomati M, Pierotti M A. Mol Cell Biol. 1995;15:6118–6127. doi: 10.1128/mcb.15.11.6118. [DOI] [PMC free article] [PubMed] [Google Scholar]
- 37.Kamikura D M, Khoury H, Maroun C, Naujokas M A, Park M. Mol Cell Biol. 2000;20:3482–3496. doi: 10.1128/mcb.20.10.3482-3496.2000. [DOI] [PMC free article] [PubMed] [Google Scholar]
- 38.Guasch G, Ollendorff V, Borg J P, Birnbaum D, Pebusque M J. Mol Cell Biol. 2001;21:8129–8142. doi: 10.1128/MCB.21.23.8129-8142.2001. [DOI] [PMC free article] [PubMed] [Google Scholar]
- 39.Sjoblom T, Boureux A, Ronnstrand L, Heldin C H, Ghysdael J, Ostman A. Oncogene. 1999;18:7055–7062. doi: 10.1038/sj.onc.1203190. [DOI] [PubMed] [Google Scholar]
- 40.Riethmacher D, Langholz O, Godecke S, Sachs M, Birchmeier C. Oncogene. 1994;9:3617–3626. [PubMed] [Google Scholar]
- 41.Xiong Q, Chan J L, Zong C S, Wang L H. Mol Cell Biol. 1996;16:1509–1518. doi: 10.1128/mcb.16.4.1509. [DOI] [PMC free article] [PubMed] [Google Scholar]
- 42.Zong C S, Wang L H. Proc Natl Acad Sci USA. 1994;91:10982–10986. doi: 10.1073/pnas.91.23.10982. [DOI] [PMC free article] [PubMed] [Google Scholar]
Associated Data
This section collects any data citations, data availability statements, or supplementary materials included in this article.


