

Abstract
The purpose of this study is (1) to determine the correlation between T1ρ and T2 and degenerative grade in intervertebral discs using in vivo 3.0-T MRI, and (2) to determine the association between T1ρ and T2 and clinical findings as quantified by the SF-36 Questionnaire and Oswestry Disability Index. Sixteen subjects participated in this study, and each completed SF-36 and Oswestry Disability Index questionnaires. MRI T1ρ and T2 mapping was performed to determine T1ρ (77 discs) and T2 (44 discs) in the nucleus of the intervertebral disc, and T2-weighted images were acquired for Pfirrmann grading of disc degeneration. Pfirrmann grade was correlated with both T1ρ (r = −0.84; P < 0.01) and T2 (r = −0.61; P < 0.01). Mixed-effects models demonstrate that only T1ρ was associated with clinical questionnaires (R2SF-36 = 0.55, R2O.D.I. = 0.56; P < 0.05). Although the averaged values of T1ρ and T2 were significantly correlated, they presented differences in spatial distribution and dynamic range, thus suggesting different sensitivities to tissue composition. This study suggests that T1ρ may be sensitive to early degenerative changes (corroborating previous studies) and clinical symptoms in intervertebral disc degeneration.
Keywords: magnetic resonance imaging, disc degeneration, T2, T1ρ, MRI relaxation time
Intervertebral disc degeneration (IVDD) is the leading cause of pain and disability in adults in the United States (1). The rate of disc degeneration increases with age (2), and IVDD is responsible for over 90% of adult spinal surgical procedures (3). Studies have demonstrated a relationship between disc degeneration and low back pain (4–6); however, the mechanisms for its causes are still under investigation. IVDD is characterized by biochemical and morphologic changes in the nucleus pulposus and annulus fibrosus. The nucleus pulposus is a hydrated gel containing approximately 25% (dry weight) collagen and 50% (dry weight) proteoglycan (PG) (7). The annulus fibrosis is composed of 15–25 concentric lamellae (8) and is located on the periphery of the disc. It contains 67% (dry weight) collagen (7) and a low concentration of proteoglycans (9). Early signs of disc degeneration are manifested by biochemical changes (proteoglycan loss, dehydration, and collagen degradation) that eventually lead to morphologic degradation in the vertebral bodies, endplates, and facet joints. The most significant biochemical changes that occur in early IVDD include a loss of proteoglycans (2). During the course of IVDD, small degraded fragments of molecules can seep from the tissue, resulting in a loss of osmotic pressure and hydration (2), thus altering mechanical properties. While not as pronounced, changes to the collagen type and organization are also prevalent in IVDD (2). During disc degeneration, type I collagen fibers replace the type II collagen fibers in the annulus (10), thus altering the tensile properties of the tissue. In the later stages of IVDD, morphologic changes including a loss of disc height, disc herniation, annular tears, and radial bulging are evident (10). Thus, IVDD is a complex and multifaceted process whose biochemical and morphologic changes adversely affect the mechanical and functional integrity of the disc.
It is difficult to compare the clinical symptoms experienced by various individuals with IVDD since pain and physical ability are subjective by nature, with varying tolerances and expectations between individuals. A number of questionnaires, including the SF-36 Health Survey (11) and Oswestry Disability Index (O.D.I.) (12), aim to quantify the severity of physical limitation and disability, thus providing a standardized and comparable measure of clinical symptoms. These questionnaires have been shown to provide reliable quantitative scoring systems in previous studies (13,14). The SF-36 and O.D.I. questionnaires have been widely used in patient studies, and their reliability and the validity have been studied extensively (13,14).
Despite the high prevalence of IVDD worldwide, diagnosis in the early stages of symptomatic disease is elusive in clinical practice. The traditional methods for imaging disc degeneration, including radiography, MRI, and CT, are limited to depicting late-stage, gross morphologic changes. Ideally, a method that detects the initial biochemical changes in disc degeneration would be valuable in preventing disease progression. Such a method would improve diagnostic capabilities and enable preventive measures to be taken at the early stages of the disease.
MRI has been widely used to detect IVDD because it is noninvasive, provides superior soft tissue contrast, and can be used to assess tissue hydration. To date, MRI has been mostly used for morphologic, qualitative assessment of IVDD. Pfirrmann et al. (15) proposed a grading system for disc degeneration based on standard spin-echo sequences. With T2-weighted spin-echo imaging sequences, healthy intervertebral discs exhibit a bright signal from the nucleus pulposus and a low signal from the annulus fibrosus.
While the Pfirrmann grading system provides a semi-quantitative evaluation of disc degeneration, which is beneficial for morphologic evaluation, MRI relaxation time measurements offer a quantitative assessment of disc composition. Quantitative relaxation time measurements are beneficial in that they compute a tissue material property, which should be scanner independent (16). In addition, quantitative techniques are able to detect subtle differences in tissue composition that may not be apparent with qualitative or semiquantitative measurements.
MRI T2 relaxation time is a quantitative parameter that is sensitive to changes in collagen and water content in cartilage (17) and in the intervertebral disc (18). Studies have shown that T2 decreases with disc degeneration (19–21). Perry et al. (20) measured T2 in five subjects, using an FSE sequence, and reported that the average T2 values were greater in normal discs as compared to those graded as Pfirrmann grade III or IV. Karakida et al. (22) investigated diurnal changes in the disc by measuring T2 in the morning and evening and reported that degenerative discs had lower T2 than healthy discs at both time points. These studies demonstrate that T2 may be a noninvasive biomarker for IVDD that is sensitive to changes in collagen and hydration in early disc degeneration.
Recent studies have proposed that MRI T1ρ is associated with loss of macromolecules (23), which is an initiating factor in IVDD. T1ρ imaging, which probes the interaction between water molecules and their macromolecular environment, has the potential to identify early biochemical changes in the intervertebral disc. Recent in vitro studies have reported correlations between T1ρ and glycosaminoglycan content (23) and have demonstrated a relationship between T1ρ and disc mechanical properties (24), suggesting that T1ρ may be sensitive to early biochemical changes in disc degeneration. In vivo studies have demonstrated differences in mean T1ρ values between the nucleus and the annulus (25) and have shown a correlation between T1ρ and degenerative grade in an asymptomatic population at 1.5 T (26), thus demonstrating the feasibility of quantifying T1ρ in human subjects.
The purpose of this study was to (1) determine the correlation between T1ρ and T2 and degenerative grade in intervertebral discs using in vivo MRI at 3 T, and to (2) determine the association between T1ρ and T2 and clinical findings as quantified by the SF-36 questionnaire and O.D.I.
MATERIALS AND METHODS
Subjects
Sixteen subjects (mean age = 40.2 ± 12.4 years, 10 males and six females, age range = 25–60 years) participated in this study. Each subject completed the O.D.I. (12) and SF-36 Health Survey Questionnaires (11). The patient inclusion criteria were radiologic screening and MRI confirmation of degenerative disc disease in the lumbar spine at one or more levels, and clinical symptoms of discogenic back pain, having failed conservative management for more than 3 months (n = 10). Additionally, a group of subjects (n = 6) who had no clinical symptoms of back pain or sciatic pain participated in the study. Patients with prior back surgery, spine fractures, sacroiliac arthritis, degenerative spondylolisthesis, metabolic bone disease, spinal infection, rheumatoid arthritis, active malignancy, and pregnancy were excluded from the study. Written informed consent was obtained from all patients after the nature of the examinations had been fully explained. All examinations were performed in accordance with the rules and regulations from the local Human Research Committee.
MRI
MRI was performed using a GE Signa 3.0-T echo-speed system (GE Healthcare, Waukesha, WI). Single-slice sagittal images for T1ρ mapping were acquired using a fast spin-echo sequence (TSL1/TSL2/TSL3/TSL4 [time of spin lock] = 0/40/80/120 ms, acquisition matrix = 256 × 192, resolution = 0.78 × 0.78mm2, spin lock [SL] power = 300 Hz, ETL = 8, field of view = 20 cm, BW = 31.25 kHz, slice thickness = 8mm, PE direction = A/P). Single-slice sagittal images for T2 mapping (echo time1-echo time7 = 9.6–77.2 ms, acquisition matrix = 256 × 192, resolution = 0.78 × 0.78mm2, field of view = 20 cm, BW = 31.25 kHz, slice thickness = 8mm, PE direction = A/P) were acquired using a MSME (27). T1ρ quantification was performed in 16 patients (77 discs), while T2 was quantified in only a subset of patients (nine patients, 44 discs) due to limitations in scan time. Additionally, sagittal T2-weighted images were acquired using a fast spinecho sequence (pulse repetition time/echo time = 5000/70 ms, acquisition matrix = 320 × 224, resolution = 0.39 × 0.39mm2, ETL = 16, field of view = 20 cm, BW = 31.25 kHz, slice thickness = 4mm, PE direction = A/P) for Pfirrmann grading (15) in all patients.
Image Analysis
Five intervertebral discs per subject were examined (80 discs total); however, discs with artifacts in the images due to patient motion were excluded in the analysis (T1ρ scans: three out of 80 discs, T2 scans: one out of 45 discs). T1ρ and T2 maps were computed on a pixel-by-pixel basis, using the following equations, respectively: S(TSL) ∝ exp(−TSL/T1ρ), S(echo time) ∝ exp(−echo time/T2). Median T1ρ and T2 values were calculated in a 5mm-diameter section that was drawn manually in the center of the nucleus in discs L5/S1, L4/L5, L3/L4, L2/L3, and L1/L2 in each subject. This type of segmentation has been performed previously (24,26), demonstrating high interobserver agreement (r = 0.95) for T1ρ values. Figure 1 illustrates the procedure for T1ρ mapping and creating the regions of interest. Pfirrmann grading (15) was performed (by one musculoskeletal radiologist with 20 years of experience in musculoskeletal imaging) based on the T2-weighted images; grades ranged from healthy (Pfirrmann grade 1) to severely degenerated (Pfirrmann grade 5).
FIG. 1.

An illustration of the T1ρ fitting and quantification procedure. First, sagittal images for T1ρ mapping were acquired, and T1ρ maps were created on a pixel-by-pixel basis. A representative T1ρ map is shown. Median T1ρ and T2 values were calculated in 5mm-diameter regions of interest that were drawn manually in the center of the nucleus in discs L5/S1, L4/L5, L3/L4, L2/L3, and L1/L2 in each subject. A T1ρ color map of the intervertebral discs in a healthy subject is shown. T2 maps were created analogously.
Statistical Analysis
A linear mixed-effects regression analysis (28,29) of MR parameters (T1ρ and T2) on Pfirrmann grade (with subject-specific random effects to account for multiple discs measured within each subject) was performed to determine the association between T1ρ (or T2) and degenerative grade. Mixed-effects models provide explicit estimates of the amount and nature of the between- and within-person variation through explicit modeling of fixed and random effects. The primary motivation for this modeling approach is that lumbar measurements have more variability between subjects than they do within subject. Pfirrmann grade is modeled as a fixed effect, i.e., differences in Pfirrmann grade between intervertebral discs (both within and between subjects) are modeled as having a constant change in T1ρ (or T2). The random-effect component models the mean of a subject’s T1ρ (or T2) (after accounting for Pfirrmann score) as a gaussian (normal) distributed random observation from a population distribution. Individual lumbar measurements are then modeled as having an additional within-subject variation component (independently and identically distributed zero mean gaussian variables). The R2 values, the proportion of variation explained from the mixed-effect model, are as output by default in JMP software. Additionally, confirmatory Spearman correlations (between Pfirrmann grade and T1ρ and Pfirrmann grade and T2) were performed, providing some assurance that the results were not unduly influenced by the gaussian assumption. The Spearman correlations are represented by “r.”
Mixed-effects models of MR parameters (T1ρ, T2, Pfirrmann grade) regressed on clinical questionnaire scores (O.D.I. and SF-36 Physical Health) were used to determine the association between T1ρ (or T2, or Pfirrmann grade) and clinical finding scores.
Spearman correlations were used to assess the relationship between T1ρ and T2 values. Spearman correlations were also performed between the mean T1ρ (or T2 or Pfirrmann grade) in each subject and age, and between clinical questionnaire scores and age. All statistical analysis was performed using JMP Software (SAS Institute, Cary, NC).
RESULTS
T2 and T1ρ Versus Pfirrmann Grade
In this study, the intervertebral discs were categorized as Pfirrmann grade 1 (healthy, n = 12), grade 2 (n = 42), grade 3 (n = 22), grade 4 (n = 3), and grade 5 (severely degenerated, n = 1 [80 discs total]). Representative T1ρ color maps of subjects with different grades of degeneration are shown in Fig. 2. Graphs of the median T1ρ and T2 values of the discs are shown in Figs. 3 and 4, respectively. Trends of decreasing T1ρ and T2 values with increasing grade of degeneration were evident. The mean T1ρ values in discs with Pfirrmann grades 1 (n = 12), 2 (n = 39), 3 (n = 22), 4 (n = 3), and 5 (n = 1) were 133.1 ± 13.8 ms, 101.5 ± 21.2 ms, 57.9 ± 12.9 ms, 50.6 ± 1.52 ms, and 33 ms, respectively. The mean T2 values in discs with Pfirrmann grades 1 (n = 0), 2 (n = 28), 3 (n = 12), 4 (n = 3), and 5 (n = 1) were 92.3 ± 27.2 ms, 59.5 ± 12.5 ms, 59.6 ± 7.6 ms, 37 ms, respectively. The linear mixed-effects regression analysis showed a significant (P < 0.05) difference in relaxation time (T1ρ and T2) values among the Pfirrmann grade groups. A significant difference in the T1ρ values between Pfirrmann grade 1 and all the other grades was evident (P < 0.05). The T2 values showed similar trends: the T2 values in Pfirrmann grade 2 discs were significantly different from those in more degenerative grades (Pfirrmann grade >2). (Note that, of the subset of patients who had T2 mapping scans [n = 9, 44 discs], none had discs that were graded as Pfirrmann 1.) The mean T1ρ and T2 values are not significantly different within each Pfirrmann grade. Spearman correlations demonstrated that Pfirrmann grade was correlated with both T1ρ (r = −0.84; P < 0.01) and T2 (r = −0.61; P < 0.01). Subject age was also associated with T1ρ (r = −0.81; P < 0.01), T2 (r = −0.51; P > 0.05), and Pfirrmann grade (r = 0.64; P < 0.01). The correlation between T1ρ and T2 values was r = 0.76 (P < 0.01) (Table 1). In order to address the effect of age on the correlation between MR parameters and Pfirrmann grade, an additional mixed-effects model that included age as a fixed effect was performed. The results demonstrated the Pfirrmann grade remained a significant effect even after accounting for age. Therefore, having age in the model did not eliminate the significant relationship between Pfirrmann grade and MR parameters.
FIG. 2.
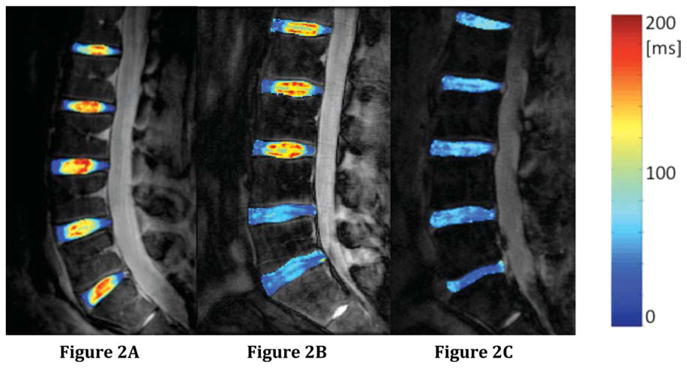
Representative T1ρ color maps from (a) a 24-year-old subject with nondegenerated discs (Pfirrmann grades L5/S1 = 1, L4/L5 = 1, L3/L4 = 1, L2/L3 = 1, L1/L2 = 2), an O.D.I. score of 0, and an SF-36 Physical Health score of 57.9; (b) a 32-year-old subject with mildly degenerated discs (Pfirrmann grades L5/S1 = 3, L4/L5 = 3, L3/L4 = 2, L2/L3 = 2, L1/L2 = 2), an O.D.I. score of 12, and an SF-36 Physical Health score of 48.8; and (c) a 65-year-old subject with mild and severely degenerated discs (Pfirrmann grades L5/S1 = 5, L4/L5 = 4, L3/L4 = 3, L2/L3 = 3, L1/L2 = 3), an O.D.I. score of 20, and an SF-36 Physical Health score of 44.4. The T1ρ values in the healthy discs are greater than those in the degenerative discs.
FIG. 3.
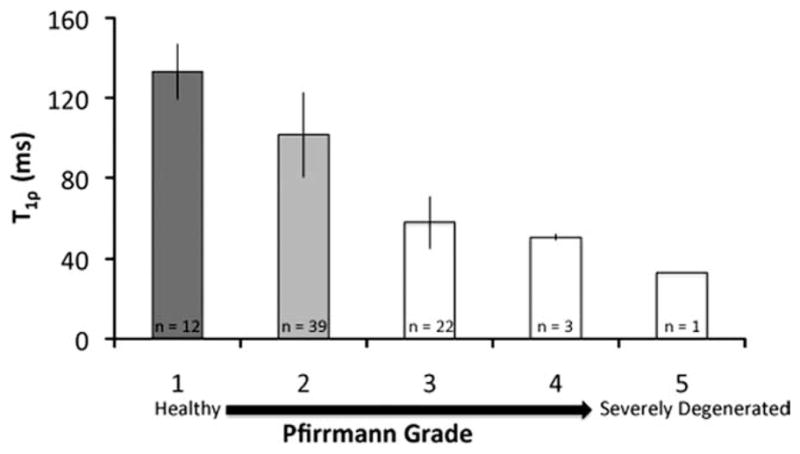
Median T1ρ values (±standard deviation) in each Pfirrmann grade are illustrated in the graph (16 patients, 77 discs). The plot is limited because it ignores differences between lumbar regions and is unable to properly account for the within- and between-subject structure of the data. However, the plot does provide an illustration of the behavior of T1ρ values with respect to Pfirrmann grade. Groups that are significantly different (P < 0.05) are categorized by different colors, as determined from the linear regression model. Note that the T1ρ values in the Pfirrmann grade 2 discs were significantly different from those in Pfirrmann grade 1, as evidenced by the mixed-effects regression model (which allows for subject-specific random effects), suggesting that T1ρ relaxation time may be sensitive to early degenerative changes.
FIG. 4.

Median T2 values (±standard deviation) in each Pfirrmann grade are illustrated in the graph (n = 9 patients, 44 discs). The plot is limited because it ignores differences between lumbar regions and is unable to properly account for the within- and between-subject structure of the data. However, the plot does provide an illustration of the behavior of T2 values with respect to Pfirrmann grade. Groups that are significantly different (P < 0.05) are categorized by different colors, as determined from the linear regression model.
Table 1.
Spearman Correlations (r) Between MR Parameters, Clinical Questionnaire Scores, and Subject Age
| Parameter | Parameter | r | P |
|---|---|---|---|
| T1ρ | T2 | 0.76 | <0.01 |
| T1ρ | Pfirrmann grade | −0.84 | <0.01 |
| T2 | Pfirrmann grade | −0.61 | <0.01 |
| T1ρ | Age | −0.81 | <0.01 |
| T2 | Age | −0.51 | >0.05 |
| Pfirrmann grade | Age | 0.64 | <0.01 |
| O.D.I. | Age | 0.62 | <0.05 |
| SF-36 | Age | −0.61 | <0.05 |
MR Parameters Versus Clinical Findings
The MR parameters (T1ρ, T2, Pfirrmann grade) were highly correlated with clinical questionnaire scores (O.D.I. and SF-36 Physical Health; Table 2). However, only the correlations between T1ρ and the clinical questionnaire scores (O.D.I. and SF-36 Physical Health) were significant (P < 0.05). The association between T1ρ and O.D.I. was R2 = 0.56 (P < 0.05) and the association between T1ρ and SF-36 was R2 = 0.55 (P < 0.05).
Table 2.
Association (R2) Between Clinical Questionnaire Scores (O.D.I. and SF-36 Physical Health) and MR Parameters (T1ρ, T2, and Pfirrmann Grade). The R2 value, calculated using the JMP procedure for mixed effects models, accounts for both within and between-subject variation.
| MR Parameters (R2) |
||||
|---|---|---|---|---|
| T1ρ | T2 | Pfirrmann Grade | ||
| Clinical Questionnaires | Disability Index (O.D.I) | 0.56* | NS | NS |
| Physical Health (SF-36) | 0.55* | NS | NS | |
p < 0.05;
NS = not significant.
A significant association was not found between T2 and clinical questionnaire scores or between Pfirrmann grade and clinical questionnaire scores.
T2 and T1r by Disc Level
Decreasing T1ρ and T2 values from L1/L2 to L5/S1 were evident. The average T1ρ values in discs L1/L2, L2/L3, L3/4, L4/L5, and L5/S1 were 106.3 ± 22.2 ms, 102.6 ± 31.0 ms, 97.6 ± 29.5 ms, 79.3 ± 30.5 ms, and 72.3 ± 36.4 ms, respectively. The average T2 values in discs L1/L2, L2/L3, L3/4, L4/L5, and L5/S1 were 99.1 ± 39.3 ms, 85.4 ± 26.2 ms, 84.3 ± 22.4 ms, 68.8 ± 18.9 ms, and 61.7 ± 23.7 ms, respectively (Fig. 5).
FIG. 5.

Decreasing trends in T1ρ and T2 values were evident in disc levels L1/L2 to L5/S1.
DISCUSSION
In this study, MR T1ρ and T2 were measured in subjects with different grades of disc degeneration and clinical symptoms. This study confirmed the previously reported negative relationship between relaxation time (T1ρ and T2) and disc degenerative grade (19–21,24,26). In addition, T1ρ was significantly associated with clinical symptoms quantified using the O.D.I. and SF-36 Physical Health questionnaires. A negative relationship between relaxation times (T1ρ and T2) and age was evident, corroborating results from other studies (20,22–25,30). This study suggests that T1ρ and T2 may be sensitive to early degenerative changes and clinical symptoms in IVDD.
T1ρ decreased with increasing severity of disc degeneration and was lowest in disc L5/S1 compared to other disc levels. It is interesting to note that the T1ρ values in the Pfirrmann grade 2 discs were significantly lower than those in Pfirrmann grade 1 discs, suggesting that in vivo T1ρ quantification may detect changes early changes in IVDD. T2 showed similar trends: T2 decreased with increasing grade of disc degeneration. Due to the limited number of Pfirrmann grade 4 and 5 discs observed in the study, we were unable to make conclusions about the effects of severely degenerative discs on T1ρ and T2 values.
The results of this study indicate that T1ρ and T2 are correlated (r = 0.76; P < 0.01) and are both sensitive to disc degeneration. T1ρ and T2 in structured tissues such as cartilage and intervertebral disc are associated with the slow-motion interaction between bulk water and its macromolecular environment. Previous studies in cartilage have shown that T2 is highly related to collagen integrity (due to a strong dipole-dipole interaction) (31,32) while not very sensitive to changes in macromolecules such as proteoglycan (33). Spin-lock techniques used in T1ρ quantification sequences have been shown to reduce residue dipolar interaction, thus enabling a larger dynamic range and less dependence on collagen fibers (34). Consequently, T1ρ has been shown to be more sensitive than T2 to macromolecular changes, such as PG loss (33). Some investigators have suggested that proton exchange between the protein side-chain groups of glycosaminoglycan and bulk water contributes significantly to the T1ρ in cartilage (35,36). The relationship between T1ρ and T2 and the composition of the extracellular matrix in disc is not clear and warrants further investigation. The reduction of T1ρ and T2 with degenerated discs observed in this study may be caused by reduced water content (23). In addition, visual differences in the T1ρ and T2 color maps are evident. Representative T1ρ and T2 color maps of two discs from one subject are shown in Fig. 6. Changes in both the range and spatial distribution of T1ρ and T2 values are visible, suggesting that T1ρ and T2 may provide complementary information about the integrity of the disc. T1ρ and T2 represent different relaxation and exchange mechanisms in the slow-frequency range (hundreds to thousands of hertz) in the transverse plane. The different spatial distributions in T1ρ and T2 values in the disc may be generated by (1) reduced residual dipolar interaction in T1ρ relaxation with the use of spin-lock pulses (34); and (2) different exchange phenomena between T1ρ and T2 (37). Using a native and immobilized protein solution, Makela et al. (35) suggested that proton exchange between the protein side-chain groups and bulk water contributes significantly to the T1ρ relaxation. Other evidence of a proton exchange pathway is the PH dependency of T1ρ values in ischemic rat brain tissues (38). Alternatively, Mlynarik et al. (39) have suggested that the dominant relaxation mechanism in the rotating frame in cartilage at amplitude of static field ≤3 T seems to be dipolar interaction. The contribution of scalar relaxation caused by proton exchange is only relevant at high fields such as 7 T. Further studies are warranted to better understand the relaxation mechanisms responsible for varied spatial distributions of T1ρ and T2 values in the disc. The spatial distribution of T1ρ and T2 values has been previously investigated in cartilage: A study by Li et al. (40) assessed the relationship between T1ρ and T2 values in osteoarthritic cartilage: although mean T1ρ and T2 values were elevated in OA cartilage, the spatial distribution of these values was different. Moreover, T1ρ has an elevated dynamic range as compared to T2 (40,41), which may impact the sensitivity of measurement to subtle changes. These studies suggest that although T1ρ and T2 are correlated, they provide differing information regarding the integrity of the IVD, as evidenced by differences in spatial distribution, dynamic range, and sensitivity to macromolecular composition.
FIG. 6.
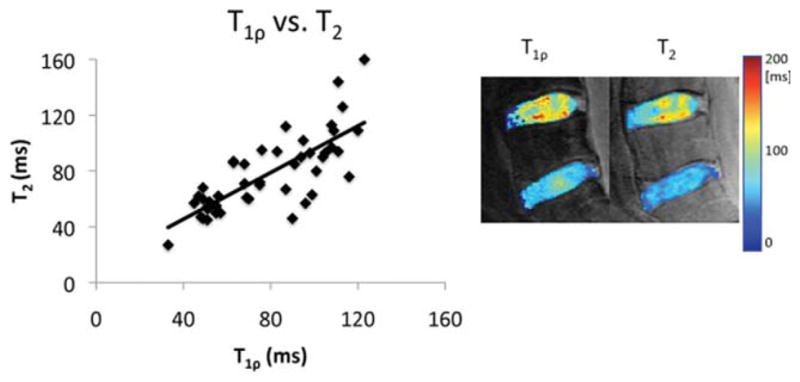
The correlation between T1ρ and T2 values was r = 0.76 (P < 0.01). The figure shows a T1ρ and T2 map in the same subject (Pfirrmann grades L5/S1 = 3 and L5/L4 = 2, an O.D.I. score of 0, and an SF-36 Physical Health score of 54.3). The disparity between the T1ρ and T2 values is evidenced by the differences in the spatial distribution and range of values in the discs.
Studies have shown that the relationship between relaxation times (T1ρ and T2) in IVDD is in the opposite direction to that of cartilage degeneration (26,40–45). While the mechanisms for degenerative changes in these tissues are still under investigation, the differences in relaxation times may be linked to the varying tissue compositions and material properties. Cartilage is a laminar structure composed of three primary layers with varied concentrations of macromolecules, while the intervertebral disc is composed of a hydrated-gel center (nucleus pulposus), which is surrounded by rows of concentric collagen lamellae (annulus fibrosis). Since cartilage and intervertebral disc tissues vary in composition and size, their intrinsic relaxation properties may differ with degeneration. Previous studies have also suggested that decreases in T1ρ in IVDD may be due to fibrosis and cross-linking with degeneration (24). Additional in vitro studies are warranted to further evaluate the pathogenesis of IVDD and the role of MR relaxometry in its noninvasive assessment.
This study examined the relationship between MR T1ρ and T2 and clinical symptoms in degenerative disc disease. The strong and significant correlations between T1ρ and SF-36 Physical Health and O.D.I. scores suggest that T1ρ may be a useful biomarker for clinical symptoms related to degenerative disc disease. The correlations between T2 and clinical symptoms were not significant; however, these findings may be affected by the study sample sizes (T1ρ quantification was performed in 16 patients [77 discs], while T2 was performed in nine patients [44 discs]).
While this study demonstrates a relationship between T1ρ and physical symptoms in subjects with low back pain, the mechanism by which disc degeneration causes low back pain is unclear. Studies have suggested various causes for discogenic back pain: innervations of the inner portion of the disc can occur during degeneration and may be responsible for discogenic back pain (46); the outer annulus has been reported to be the origin of pain reproduced during discography (47). MRI studies have identified characteristics of discs in subjects, which include decreases in the signal intensity of the disc (4). Thus, a variety of discogenic changes are linked to low back pain; however, the mechanisms behind this relationship remain to be determined.
The reproducibility of T1ρ quantification at 3 T, using a spiral readout acquisition, has been previously reported (25). The coefficient of variation for phantoms was less than 3%, and the coefficient of variation for in vivo quantification was less than 5%. The current study used the same T1ρ preparation pulses as Blumenkrantz et al. (25); however, an FSE readout instead of spiral readout was implemented. An FSE readout was desirable because a spiral readout lacks an antialiasing filter and thus cannot be used to acquire sagittal images of the spine. Moreover, sagittal scans minimize partial-volume effects, which were often encountered in the axial scans of the disc.
The primary limitations of this study were the small sample size (especially for T2 quantification) and the lack of T2 data for early stages of disc degeneration. If the complete T2 dataset were available, similar conclusions might hold true for T2 and for T1ρ. Unfortunately, this theory could not be confirmed in the current study due to the fact that acquisition of additional T2 data was not possible. Clearly, additional studies with a greater sample size are warranted to explore these ideas.
Additionally, the choice of SL power in the T1ρ sequence may have influenced the results. In T1ρ imaging, a high SL power is desirable; however, is it limited by specific absorption rate. An SL power of 300 Hz was the maximum SL power that could be obtained, given our scanning hardware, without exceeding the specific absorption rate limit. Previous studies have documented on-resonance T1ρ dispersion (34,48). Regatte et al. (49) have demonstrated T1ρ dispersion (over a range of 0 to 3000 Hz) in bovine intervertebral discs. Their study also reported that T1ρ has a higher dynamic range than T2. Therefore, it is suspected that varying the RF field strength would directly impact image contrast and relaxation time measurement.
In this study, T1ρ and T2 were calculated in subjects with IVDD and clinical symptoms. This study demonstrates that MRI relaxation time (T1ρ and T2) decreases with increasing grade of disc degeneration and that T1ρ values were related to clinical symptoms, as measured by the O.D.I. and SF-36 Physical Health questionnaires. This study demonstrates a potential for the future use of MRI markers in the evaluation of treatment efficacy.
Acknowledgments
Grant sponsor: NIH; Grant number: F31 EB006708 and R01 AG17762.
References
- 1.Errico TJ. Lumbar disc arthroplasty. Clin Orthop Relat Res. 2005;435:106–117. doi: 10.1097/01.blo.0000165718.22159.d9. [DOI] [PubMed] [Google Scholar]
- 2.Raj PP. Intervertebral disc: anatomy-physiology-pathophysiology-treatment. Pain Pract. 2008;8:18–44. doi: 10.1111/j.1533-2500.2007.00171.x. [DOI] [PubMed] [Google Scholar]
- 3.An HS, Anderson PA, Haughton VM, Iatridis JC, Kang JD, Lotz JC, Natarajan RN, Oegema TR, Jr, Roughley P, Setton LA, Urban JP, Videman T, Andersson GB, Weinstein JN. Introduction: disc degeneration: summary. Spine. 2004;29:2677–2678. doi: 10.1097/01.brs.0000147573.88916.c6. [DOI] [PubMed] [Google Scholar]
- 4.Luoma K, Riihimaki H, Luukkonen R, Raininko R, Viikari-Juntura E, Lamminen A. Low back pain in relation to lumbar disc degeneration. Spine. 2000;25:487–492. doi: 10.1097/00007632-200002150-00016. [DOI] [PubMed] [Google Scholar]
- 5.Peterson CK, Bolton JE, Wood AR. A cross-sectional study correlating lumbar spine degeneration with disability and pain. Spine. 2000;25:218–223. doi: 10.1097/00007632-200001150-00013. [DOI] [PubMed] [Google Scholar]
- 6.Vanharanta H, Sachs BL, Spivey MA, Guyer RD, Hochschuler SH, Rashbaum RF, Johnson RG, Ohnmeiss D, Mooney V. The relationship of pain provocation to lumbar disc deterioration as seen by CT/discography. Spine. 1987;12:295–298. doi: 10.1097/00007632-198704000-00019. [DOI] [PubMed] [Google Scholar]
- 7.Cassinelli EH, Hall RA, Kang JD. Biochemistry of intervertebral disc degeneration and the potential for gene therapy applications. Spine J. 2001;1:205–214. doi: 10.1016/s1529-9430(01)00021-3. [DOI] [PubMed] [Google Scholar]
- 8.Urban JP, Roberts S. Degeneration of the intervertebral disc. Arthritis Res Ther. 2003;5:120–130. doi: 10.1186/ar629. [DOI] [PMC free article] [PubMed] [Google Scholar]
- 9.Weidenbaum M, Foster RJ, Best BA, Saed-Nejad F, Nickoloff E, Newhouse J, Ratcliffe A, Mow VC. Correlating magnetic resonance imaging with the biochemical content of the normal human intervertebral disc. J Orthop Res. 1992;10:552–561. doi: 10.1002/jor.1100100410. [DOI] [PubMed] [Google Scholar]
- 10.Adams MA, Roughley PJ. What is intervertebral disc degeneration, and what causes it? Spine. 2006;31:2151–2161. doi: 10.1097/01.brs.0000231761.73859.2c. [DOI] [PubMed] [Google Scholar]
- 11.Ware JE, Jr, Sherbourne CD. The MOS 36-item Short-Form Health Survey (SF-36), I: conceptual framework and item selection. Med Care. 1992;30:473–483. [PubMed] [Google Scholar]
- 12.Fairbank JC, Couper J, Davies JB, O’Brien JP. The Oswestry low back pain disability questionnaire. Physiotherapy. 1980;66:271–273. [PubMed] [Google Scholar]
- 13.McHorney CA, Ware JE, Jr, Lu JF, Sherbourne CD. The MOS 36-item Short-Form Health Survey (SF-36), III: tests of data quality, scaling assumptions, and reliability across diverse patient groups. Med Care. 1994;32:40–66. doi: 10.1097/00005650-199401000-00004. [DOI] [PubMed] [Google Scholar]
- 14.Fairbank JC, Pynsent PB. The Oswestry Disability Index. Spine. 2000;25:2940–2952. doi: 10.1097/00007632-200011150-00017. discussion2952. [DOI] [PubMed] [Google Scholar]
- 15.Pfirrmann CW, Metzdorf A, Zanetti M, Hodler J, Boos N. Magnetic resonance classification of lumbar intervertebral disc degeneration. Spine. 2001;26:1873–1878. doi: 10.1097/00007632-200109010-00011. [DOI] [PubMed] [Google Scholar]
- 16.Marinelli NL, Haughton VM, Munoz A, Anderson PA. T2 relaxation times of intervertebral disc tissue correlated with water content and proteoglycan content. Spine. 2009;34:520–524. doi: 10.1097/BRS.0b013e318195dd44. [DOI] [PubMed] [Google Scholar]
- 17.Xia Y. Magic-angle effect in magnetic resonance imaging of articular cartilage: a review. Invest Radiol. 2000;35:602–621. doi: 10.1097/00004424-200010000-00007. [DOI] [PubMed] [Google Scholar]
- 18.Weidenbaum M, Foster RJ, Best BA, Saed-Nejad F, Nickoloff E, Newhouse J, Ratcliffe A, Mow VC. Correlating magnetic resonance imaging with the biochemical content of the normal human intervertebral disc. J Orthop Res. 1992;10:552–561. doi: 10.1002/jor.1100100410. [DOI] [PubMed] [Google Scholar]
- 19.Kerttula L, Kurunlahti M, Jauhiainen J, Koivula A, Oikarinen J, Tervonen O. Apparent diffusion coefficients and T2 relaxation time measurements to evaluate disc degeneration: a quantitative MR study of young patients with previous vertebral fracture. Acta Radiol. 2001;42:585–591. doi: 10.1080/028418501127347241. [DOI] [PubMed] [Google Scholar]
- 20.Perry J, Haughton V, Anderson PA, Wu Y, Fine J, Mistretta C. The value of T2 relaxation times to characterize lumbar intervertebral discs: preliminary results. AJNR Am J Neuroradiol. 2006;27:337–342. [PMC free article] [PubMed] [Google Scholar]
- 21.Chiu EJ, Newitt DC, Segal MR, Hu SS, Lotz JC, Majumdar S. Magnetic resonance imaging measurement of relaxation and water diffusion in the human lumbar intervertebral disc under compression in vitro. Spine. 2001;26:E437–444. doi: 10.1097/00007632-200110010-00017. [DOI] [PubMed] [Google Scholar]
- 22.Karakida O, Ueda H, Ueda M, Miyasaka T. Diurnal T2 value changes in the lumbar intervertebral discs. Clin Radiol. 2003;58:389–392. doi: 10.1016/s0009-9260(02)00583-4. [DOI] [PubMed] [Google Scholar]
- 23.Johannessen W, Auerbach JD, Wheaton AJ, Kurji A, Borthakur A, Reddy R, Elliott DM. Assessment of human disc degeneration and proteoglycan content using T1rho-weighted magnetic resonance imaging. Spine. 2006;31:1253–1257. doi: 10.1097/01.brs.0000217708.54880.51. [DOI] [PMC free article] [PubMed] [Google Scholar]
- 24.Nguyen AM, Johannessen W, Yoder JH, Wheaton AJ, Vresilovic EJ, Borthakur A, Elliott DM. Noninvasive quantification of human nucleus pulposus pressure with use of T1rho-weighted magnetic resonance imaging. J Bone Joint Surg Am. 2008;90:796–802. doi: 10.2106/JBJS.G.00667. [DOI] [PMC free article] [PubMed] [Google Scholar]
- 25.Blumenkrantz G, Li X, Han ET, Newitt DC, Crane JC, Link TM, Majumdar S. A feasibility study of in vivo T1rho imaging of the intervertebral disc. Magn Reson Imaging. 2006;24:1001–1007. doi: 10.1016/j.mri.2006.04.013. [DOI] [PubMed] [Google Scholar]
- 26.Auerbach JD, Johannessen W, Borthakur A, Wheaton AJ, Dolinskas CA, Balderston RA, Reddy R, Elliott DM. In vivo quantification of human lumbar disc degeneration using T(1rho)-weighted magnetic resonance imaging. Eur Spine J. 2006;15:338–344. doi: 10.1007/s00586-006-0083-2. [DOI] [PMC free article] [PubMed] [Google Scholar]
- 27.Maier CF, Tan SG, Hariharan H, Potter HG. T2 quantitation of articular cartilage at 1.5 T. J Magn Reson Imaging. 2003;17:358–364. doi: 10.1002/jmri.10263. [DOI] [PubMed] [Google Scholar]
- 28.McCulloch CE, Searle SR. Generalized, linear, and mixed models. New York: Wiley-Interscience; 2004. p. 358. [Google Scholar]
- 29.Littell RC, Milliken GA, Stroup WW, Wolfinger RD. SAS system for mixed models. Cary, NC: SAS Institute; 1996. [Google Scholar]
- 30.Wang C, Auerbach JD, Witschey WR, Balderston RA, Reddy R, Borthakur A. Advances in magnetic resonance imaging for the assessment of degenerative disc disease of the lumbar spine. Semin Spine Surg. 2007;19:65–71. doi: 10.1053/j.semss.2007.04.009. [DOI] [PMC free article] [PubMed] [Google Scholar]
- 31.Mosher TJ, Smith H, Dardzinski BJ, Schmithorst VJ, Smith MB. MR imaging and T2 mapping of femoral cartilage: in vivo determination of the magic angle effect. AJR Am J Roentgenol. 2001;177:665–669. doi: 10.2214/ajr.177.3.1770665. [DOI] [PubMed] [Google Scholar]
- 32.Yang X, Tony F, Nancy B-W, George L. Origin of cartilage laminae in MRI. J Magn Reson Imaging. 1997;7:887–894. doi: 10.1002/jmri.1880070518. [DOI] [PubMed] [Google Scholar]
- 33.Regatte RR, Akella SV, Borthakur A, Kneeland JB, Reddy R. Proteoglycan depletion-induced changes in transverse relaxation maps of cartilage: comparison of T2 and T1rho. Acad Radiol. 2002;9:1388–1394. doi: 10.1016/s1076-6332(03)80666-9. [DOI] [PubMed] [Google Scholar]
- 34.Akella SV, Regatte RR, Wheaton AJ, Borthakur A, Reddy R. Reduction of residual dipolar interaction in cartilage by spin-lock technique. Magn Reson Med. 2004;52:1103–1109. doi: 10.1002/mrm.20241. [DOI] [PubMed] [Google Scholar]
- 35.Makela HI, Grohn OH, Kettunen MI, Kauppinen RA. Proton exchange as a relaxation mechanism for T1 in the rotating frame in native and immobilized protein solutions. Biochem Biophys Res Commun. 2001;289:813–818. doi: 10.1006/bbrc.2001.6058. [DOI] [PubMed] [Google Scholar]
- 36.Duvvuri U, Goldberg AD, Kranz JK, Hoang L, Reddy R, Wehrli FW, Wand AJ, Englander SW, Leigh JS. Water magnetic relaxation dispersion in biological systems: the contribution of proton exchange and implications for the noninvasive detection of cartilage degradation. Proc Natl Acad Sci U|S|A. 2001;98:12479–12484. doi: 10.1073/pnas.221471898. [DOI] [PMC free article] [PubMed] [Google Scholar]
- 37.Abergel D, Palmer AG. On the use of the stochastic Liouville equation in nuclear magnetic resonance: application to R1p relaxation in the presence of exchange. Concepts Magn Reson A. 2003;19:134–148. [Google Scholar]
- 38.Kettunen MI, Grohn OH, Silvennoinen MJ, Penttonen M, Kauppinen RA. Effects of intracellular pH, blood, and tissue oxygen tension on T1rho relaxation in rat brain. Magn Reson Med. 2002;48:470–477. doi: 10.1002/mrm.10233. [DOI] [PubMed] [Google Scholar]
- 39.Mlynarik V, Szomolanyi P, Toffanin R, Vittur F, Trattnig S. Transverse relaxation mechanisms in articular cartilage. J Magn Reson. 2004;169:300–307. doi: 10.1016/j.jmr.2004.05.003. [DOI] [PubMed] [Google Scholar]
- 40.Li X, Ma C, Link T, Castillo D, Blumenkrantz G, Lozano J, Carballido-Gamio J, Ries M, Majumdar S. In vivo T1rho and T2 mapping of articular cartilage in osteoarthritis of the knee using 3 tesla MRI. Osteoarthritis Cartilage. 2007;15:789–797. doi: 10.1016/j.joca.2007.01.011. [DOI] [PMC free article] [PubMed] [Google Scholar]
- 41.Regatte RR, Akella SV, Lonner JH, Kneeland JB, Reddy R. T1rho relaxation mapping in human osteoarthritis (OA) cartilage: comparison of T1rho with T2. J Magn Reson Imaging. 2006;23:547–553. doi: 10.1002/jmri.20536. [DOI] [PubMed] [Google Scholar]
- 42.Li X, Benjamin Ma C, Link TM, Castillo DD, Blumenkrantz G, Lozano J, Carballido-Gamio J, Ries M, Majumdar S. In vivo T(1rho) and T(2) mapping of articular cartilage in osteoarthritis of the knee using 3 T MRI. Osteoarthritis Cartilage. 2007;15:789–797. doi: 10.1016/j.joca.2007.01.011. [DOI] [PMC free article] [PubMed] [Google Scholar]
- 43.Li X, Han E, Ma C, Link T, Newitt D, Majumdar S. In vivo 3T spiral imaging based multi-slice T(1rho) mapping of knee cartilage in osteoarthritis. Magn Reson Med. 2005;54:929–936. doi: 10.1002/mrm.20609. [DOI] [PubMed] [Google Scholar]
- 44.Duvvuri U, Reddy R, Patel SD, Kaufman JH, Kneeland JB, Leigh JS. T1rho-relaxation in articular cartilage: effects of enzymatic degradation. Magn Reson Med. 1997;38:863–867. doi: 10.1002/mrm.1910380602. [DOI] [PubMed] [Google Scholar]
- 45.Antoniou J, Mwale F, Demers CN, Beaudoin G, Goswami T, Aebi M, Alini M. Quantitative magnetic resonance imaging of enzymatically induced degradation of the nucleus pulposus of intervertebral discs. Spine. 2006;31:1547–1554. doi: 10.1097/01.brs.0000221995.77177.9d. [DOI] [PubMed] [Google Scholar]
- 46.Coppes MH, Marani E, Thomeer RT, Groen GJ. Innervation of “painful” lumbar discs. Spine. 1997;22:2342–2349. doi: 10.1097/00007632-199710150-00005. discussion 2349–2350. [DOI] [PubMed] [Google Scholar]
- 47.Moneta GB, Videman T, Kaivanto K, Aprill C, Spivey M, Vanharanta H, Sachs BL, Guyer RD, Hochschuler SH, Raschbaum RF. Reported pain during lumbar discography as a function of anular ruptures and disc degeneration: a re-analysis of 833 discograms. Spine. 1994;19:1968–1974. doi: 10.1097/00007632-199409000-00018. [DOI] [PubMed] [Google Scholar]
- 48.Wheaton AJ, Borthakur A, Kneeland JB, Regatte RR, Akella SV, Reddy R. In vivo quantification of T1rho using a multislice spin-lock pulse sequence. Magn Reson Med. 2004;52:1453–1458. doi: 10.1002/mrm.20268. [DOI] [PubMed] [Google Scholar]
- 49.Regatte RR, Akella SV, Borthakur A, Reddy R. High resolution T1rho relaxation and dispersion imaging of the intervertebral disc. Proceedings of the ISMRM; Kyoto, Japan. 2004. p. 1544. [Google Scholar]