

Abstract
Intercellular (between cell) communication networks maintain homeostasis and coordinate regenerative and developmental cues in multicellular organisms. Despite the importance of intercellular networks in stem cell biology, their rules, structure and molecular components are poorly understood. Herein, we describe the structure and dynamics of intercellular and intracellular networks in a stem cell derived, hierarchically organized tissue using experimental and theoretical analyses of cultured human umbilical cord blood progenitors. By integrating high-throughput molecular profiling, database and literature mining, mechanistic modeling, and cell culture experiments, we show that secreted factor-mediated intercellular communication networks regulate blood stem cell fate decisions. In particular, self-renewal is modulated by a coupled positive–negative intercellular feedback circuit composed of megakaryocyte-derived stimulatory growth factors (VEGF, PDGF, EGF, and serotonin) versus monocyte-derived inhibitory factors (CCL3, CCL4, CXCL10, TGFB2, and TNFSF9). We reconstruct a stem cell intracellular network, and identify PI3K, Raf, Akt, and PLC as functionally distinct signal integration nodes, linking extracellular, and intracellular signaling. This represents the first systematic characterization of how stem cell fate decisions are regulated non-autonomously through lineage-specific interactions with differentiated progeny.
Keywords: cellular networks, hematopoiesis, intercellular signaling, self-renewal, stem cells
Introduction
Intercellular communication networks maintain homeostasis and coordinate regenerative and developmental cues in multicellular organisms. These constitute local juxtacrine and paracrine signaling for within-tissue cellular regulation, and systemic endocrine signaling for organism-level interactions. Adult or tissue-resident stem cells, while normally quiescent, are activated under appropriate circumstances, giving rise to a hierarchy of increasingly differentiated progenitors, thereby regenerating damaged tissue. Intercellular networks are of particular relevance for stem cell biology as stem and progenitor cell fate must be dynamically responsive to physiological demand and external perturbations. For example, adult blood stem cell fate decisions in vivo are regulated via interactions within the bone marrow microenvironment—the stem cell ‘niche’. Recent progress has been made in elucidating the physical location and cellular components of this niche, including molecular cross-talk between hematopoietic stem cells (HSCs) and niche cells (Kiel and Morrison, 2008). However, local interactions within the microenvironment are insufficient to explain the dynamic responsiveness of tissue-resident stem cells to systemic signals (Mayack et al, 2010). Numerous studies have indirectly demonstrated hematopoietic stem and progenitor cell fate as responsive to systemic perturbations such as bleeding and irradiation via (undefined) feedback signaling from mature cells (Kirouac and Zandstra, 2006). Such regulatory mechanisms appear to be a conserved feature in other adult stem cells, including neural and epithelial tissues (Lander et al, 2009).
Despite the recognized importance of intercellular networks in regulating adult stem and progenitor cell fate, the specific cell populations involved, and underlying molecular mechanisms are largely undefined. Although much work has focused on the reconstruction and analyses of intracellular networks regulating stem cell fate (Macarthur et al, 2009), and a limited number of studies have applied novel bioinformatic approaches to unravel intercellular signaling in other cell systems (Frankenstein et al, 2006), a comprehensive analysis of intercellular communication in a hierarchical tissue network has yet to be reported.
Herein, using experimental and theoretical analyses of cultured human umbilical cord blood (UCB) progenitors, we describe the structure and dynamics of intercellular and intracellular networks in a hierarchically organized tissue. For organizational clarity, the experimental and computational workflow used is represented schematically using a flow chart in Figure 1, which we refer to throughout the manuscript. By integrating high-throughput molecular profiling (transcriptome and proteome), protein interaction and pathway databases, literature curation, and mechanistic modeling with cell culture experiments, we show that secreted factor-mediated intercellular communication networks regulate blood stem cell fate decisions. In particular, primitive progenitor cell growth is modulated by a balance of megakaryocyte-derived stimulatory growth factors (VEGF, PDGF, and EGF) versus monocyte-derived inhibitory factors (chemokines CCL3, CCL4, CXCL10, TGFB2, and TNFSF9), forming a coupled positive–negative intercellular feedback circuit. We reconstruct a stem cell-specific intracellular signaling network, and show that this complex milieu of endogenous signals is integrated and coherently processed by this network, thereby linking extracellular and intracellular signaling. We identify PI3K, Raf, Akt, and PLC as functionally distinct self-renewal, proliferation, and survival signal integration nodes. This work, for the first time, systematically describes how cell fate decisions are regulated non-autonomously through lineage-specific interactions with differentiated progeny. Importantly, this serves as a foundational platform to understand other stem cell systems, and suggests novel strategies to manipulate stem cell fate decisions in a non-cell autonomous manner.
Figure 1.

Experimental and computational workflow. Boxes represent independent research steps, successively numbered and color-coded according to experimental (pink) versus computational (blue) work. After defining culture manipulations capable of differentially modulating stem cell growth via non-cell autonomous effects, molecular profiling experiments were conducted to systematically explore the underlying molecular and cellular dynamics. Intercellular signaling networks were then reconstructed using gene expression data. Endogenous ligands and differentiated cell populations comprising the intercellular networks were tested for functional effects on blood stem cell growth in culture. An intracellular network associated with blood stem cell self-renewal was then constructed using molecular databases, as a platform to identify core proteins onto which signaling pathways activated by the various functional ligands converge. Small molecule antagonists were then used to perturb these intracellular targets, and a mechanistic model of blood cell development used to classify the effects of the extracellular and intracellular manipulations on cell population-specific kinetic parameters (self-renewal and proliferation).
Results
Non-autonomous factors regulate blood stem cell growth in vitro
As a model system to explore intercellular communication networks in a hierarchical organized tissue, we cultured human UCB-derived stem and progenitor cells in defined, minimal cytokine-supplemented (stem cell factor (KITL), flt3 ligand (FLT3L), and thrombopoietin (THPO)), liquid culture. This experimental system was chosen as complexities arising from spatial organization, undefined serum components, and extracellular matrix/stromal cell interactions are minimized. The self-renewal capacity of blood stem cells begins to decline rapidly after ∼4 days in culture, coinciding with the accumulation of differentiated progeny and associated secreted ligands (Kirouac and Zandstra, 2006). This correlation indicates the functional effects may be attributable to non-stem cell autonomous factors. To test this hypothesis, we designed a cell culture devise capable of semicontinuously depleting differentiated cells and/or exchanging conditioned media, thereby disrupting autocrine and paracrine signals established in culture between stem and progenitor cells and their differentiated progeny (Figure 2A). The system consists of two gas permeable culture bags connected via a magnetic column. Differentiated cells, defined via the expression of an assortment of blood lineage-specific cell surface antigens (Lin+), are immuno-magnetically depleted by passing the cells through the column, and media exchange performed via a sterile port (Madlambayan et al, 2006). We have previously shown that performing both manipulations (cell selection and media exchange) in tandem synergistically and specifically enhances stem cell growth via a reduction in inhibitory feedback signaling from differentiated cells (Madlambayan et al, 2005).
Figure 2.

Functional and molecular profiling of hematopoietic progenitor (Lin−) and differentiated (Lin+) cells propagated in liquid culture. (A) Schematic representation of autocrine and paracrine signaling between Lin− progenitor (blue) and Lin+ differentiated (red) cells. These signals can be disrupted in vitro by depleting Lin+ cells (cell selection (S) versus no selection (NS)), and/or depleting secreted ligands (conditioned media exchange (E) versus no exchange (NE)). (B) Cell culture methodology. Umbilical cord blood derived-Lin− cells were cultured in serum-free cytokine-supplemented media for 8 days unmanipulated (no selection and no exchange; ‘NSNE’), or for 12 days in total with Lin− cell selection and media exchanges (‘SE’) performed every 4 days. (C) Total (TNC), progenitor (CFC), and primitive progenitor (LTCIC) cell expansion as a function of culture condition. Error bars represent s.d, n=3–5. (D) Cell population dynamics and sample relationships inferred from differential gene expression patterns; activity scores for published characteristic gene sets (indicated by first author—cell type) are depicted as a hierarchical clustered heat map with associated dendograms. Only gene sets with activity scores⩾2 in at least one sample, and CV⩾20% across samples are included (21 in total). For visualization, activity scores are mean-centered across samples and scaled to ±3 s.d. Gene sets are characterized by color coding as quiescent versus cycling (dark gray versus green), and primitive versus differentiated (light gray versus yellow) cell types.
Progenitor (Lin−) cell re-selection and media exchange (‘SE’) was performed at culture day 4, (d4) thereby removing mature (Lin+) cells and endogenous ligands that have accumulated. Evaluation of fresh and culture-derived cells using quantitative functional assays for total nucleated cell (TNC), progenitor (colony forming cell; CFC), and primitive progenitor (long-term culture initiating cells; LTCICs) content revealed that primitive progenitor cell growth is enhanced at culture day 8 (d8) in the manipulated compared with control (no selection and no exchange; ‘NSNE’) condition. However, performing an additional culture manipulation (SE) at day 8 and culturing the Lin− cells for a further 4 days to day 12 (d12) results in a decline in primitive progenitor content (LTCIC) (Figure 2B and C), again coincident with the accumulation of differentiated (Lin+) cells. The differentiation rate of Lin+ cells (d4; 40±16%, d8-NSNE; 61±4%, d8-SE; 52±17%, d12; 52±5%) is best described by a negative feedback control loop between the Lin− and Lin+ populations. The system therefore naturally evolves towards and inhibitory state, such that continued SE culture manipulations are required to perturb this evolution and sustain stem cell growth. Although not shown, extended culture (beyond d8) without successive manipulations results in significant culture decline (Kirouac et al, 2009). Thus, we have established culture conditions wherein primitive progenitor (LTCIC) growth is differentially modulated by non-cell autonomous factors (Figure 1; step 1).
Genome-wide expression patterns correlate with cellular functional activity
To systematically explore the molecular and cellular dynamics underlying primitive progenitor growth and differentiation, fresh (day 0) and culture derived (day 4, day 8-SE, day 8-NSNE, and day 12) cells were physically separated into undifferentiated (Lin−) and differentiated (Lin+) subpopulations for transcriptional profiling using Affymetrix GeneChips. In parallel, phenotypic (CD133, C34, CD38, and Rho123 staining) assays were performed on the cells, and conditioned media samples were analyzed for secreted protein content using ELISA-based antibody arrays (Figure 1; step 2). mRNA expression indices statistically correlate with complex measures of proteome activity (protein secretion and cell surface expression; see Supplementary Figure S1). The limited proteomic information thus lends confidence to the gene expression data.
To interrogate the cellular composition and functional status of each profiled population, we made use of published gene expression data sets to extract gene sets characteristic of hematopoietic and non-hematopoietic cell types from a variety of conditions (Supplementary Table S1). Activity scores were then calculated to statistically evaluate transcript expression levels for each gene set across each experimental cell population (see Materials and methods and Supplementary Figure S2), represented as an unsupervised hierarchically clustered heat map (Eisen et al, 1998) (Figure 2D). This allowed us to compare molecular signatures of our experimentally derived cells with functionally relevant cell populations described in the published literature. Gene sets cluster distinctly into quiescent versus cycling cells, whereas cell populations generally cluster into undifferentiated (Lin−) versus differentiated populations (Lin+). Note that gene sets characterizing in vitro differentiated cell types (erythrocytes, megakaryocytes, and CD34+CD38−-derived ‘fast dividing fraction’) are highly expressed in cultured Lin+ cells, whereas gene sets characterizing primitive cells (‘slow dividing fraction’, and G0CD34+ cells) are highly expressed in the undifferentiated Lin− populations. Interestingly, gene sets characteristic of in vivo hematopoietic tissues (thymus, spleen, monocytes) are highly expressed in uncultured (d0) Lin+ cells, demonstrating the dramatic changes in gene activation and cellular composition that occur upon introducing primary cells to culture. Few genes map to more than one gene set, and surprisingly little overlap exists between gene sets, even for closely related tissues (Supplementary Figure S3). Similarities in activity scores thus represent biological characteristics of the cell populations, rather than computational artefacts. Broadly, this analysis indicates that gene expression patterns are indicative of cellular functional activity, and therefore may be used to elucidate functional differences between related cell populations.
Pairwise sample comparisons identify cell population dynamics and signaling pathways associated with HSC expansion and depletion in vitro
We next wished to use the gene expression data to identify processes, pathways, and molecular signals associated with primitive progenitor expansion and differentiation in culture (Figure 1; step 3). To identify gene expression differences associated with HSC expansion versus depletion, we performed pairwise sample comparisons between related conditions wherein numbers of primitive progenitors (LTCIC) have significantly changed; d8-NSNE versus SE, d8-NSNE versus d4, and d12 versus d8-NSNE, for both Lin− and Lin+ populations (Table S2). Differentially expressed genes were then grouped into three categories based on consistency of correlation with primitive progenitor (LTCIC) growth; HSC-expansion correlated, HSC-depletion correlated, and non-correlated (differentially associated with both directions, therefore not functionally related to HSC growth). We intuitively expect genes consistently scoring more than once to carry greater biological significance; however, the molecular mechanisms underlying stem cell growth may vary between different conditions. Differentially expressed gene lists were analyzed for biological process and pathway enrichment (P⩽10−3), and also filtered for known secreted ligands to identify autocrine and paracrine factors mediating endogenous pathway activation (Supplementary Tables S3–S11).
HSC expansion was consistently correlated with megakaryocyte development (blood clotting; Table S3, and blood coagulation pathways; Supplementary Table S6), whereas HSC-depletion correlated with monocyte development (macrophage-mediated immunity; Supplementary Table S5), consistent with compositional analysis presented in Figure 2D. HSC expansion was also associated with cell adhesion (Supplementary Table S3), specifically upregulation of ICAM2, ICAM3, SELL, and SELP genes (Supplementary Table S9), likely related to megakaryocyte enrichment. HSC-depletion correlated (P<0.005) with TGF-β signaling (Supplementary Table S8), a well-known inhibitor of HSC growth (Larsson and Karlsson, 2005), corresponding to upregulation of the TGF-β ligands TGFB2 and FST, and downregulation of the TGF-β inhibitor LTBP1 (Supplementary Tables S11 and S9). Analogously, HSC expansion correlated with activation of VEGF signaling (Supplementary Table S6) and upregulation of VEGFC (Supplementary Table S9).
Surprisingly, HSC expansion was found to correlate with GPCR neurotransmitter signaling (5HT2, α-adrenergic, Metabotropic glutamate, and Muscarinic acetylcholine receptor signaling; Supplementary Table S6). This is consistent with reports suggesting a role for neurological signals in regulating stem cell fate in vivo (Spiegel et al, 2008), but novel in that these signals are apparently being activated endogenously by hematopoietic cells, rather than by niche-infiltrating neurons. To validate that these pathways are truly being activated by an endogenous neurotransmitter, we screened conditioned media samples for serotonin (5HT), based on evidence that this molecule is stored in circulating platelets (Yang et al, 1996). Indeed, serotonin was detected at concentrations of ∼200–450 pg/ml in all samples tested (Supplementary Figure S4), supporting the pathway analysis. In summary, we have identified both known and novel pathways, cell populations, and endogenous secreted factors associated with stem cell expansion and depletion in culture.
Intercellular network reconstruction
In order to better understand the dynamic relationships between differential cell population development, ligand secretion, and stem cell growth, we next sought to use the expression data to systematically reconstruct the intercellular signaling networks established in culture. On the basis of the coexpression patterns of a manually curated set of 234 secreted ligand–receptor pairs (Supplementary Table S12), we defined ‘autocrine’ and ‘paracrine’ signaling interactions between Lin− and Lin+ cell populations (see Supplementary information). We applied this intercellular network reconstruction algorithm to each time point/culture condition studied, and included secreted factors that were differentially expressed at the transcriptional level and/or consistently detected in conditioned media, producing a non-redundant list of 74 intercellular signaling molecules for further analysis (Supplementary Table S13). To interrogate how these 74 molecules (as well as the three exogenously provided ligands KITL, FLT3L, and THPO) mediate interactions between the Lin− and heterogenous Lin+ cells produced in culture, we mapped the Lin+ ligand/receptor expression patterns onto published megakaryoblast, erythroblast, and monoblast expression profiles (Ferrari et al, 2007). This information was converted to a directed graph representing a set of theoretical cell–cytokine–cell interactions, with vertices (cells and ligands) color-coded according to correlation with HSC expansion (green), depletion (red), or neither (yellow) corresponding to predicted endogenous stimulators, inhibitors, and non-functional effectors of HSC growth, respectively (Figure 3Ai). Although derived from gene expression, note that a robust statistical correlation exists between secreted factor transcript expression above approximately the 50th percentile (for which the gene expression data are filtered), and corresponding protein detection (Supplementary Figure S1B).
Figure 3.

Reconstructed intercellular signaling networks. Signaling between culture-derived Lin- progenitors (LIN-) and differentiated megarkaryocytes (MEG), erythrocytes (E), and monocytes (MONO) mediated via secreted proteins. Cells and ligands are color coded according to differential expression patterns, corresponding to predicted stimulators (green), inhibitors (red), and non-function effectors of stem cell growth. (Ai) Total network, consisting of four cells populations and 77 secreted proteins. (Aii) TGF-β subnetwork. (Aiii) VEGF/EGF/PDGF subnetwork. Functional interactions between secreted proteins are indicated via gray connections in the two subnetworks; LTBP1 inhibits TGF-β ligands from activating the corresponding receptors (Aii), and PDGF is known to display intracellular synergism with both EGF and VEGF signaling (Aiii). (B) Dynamic representation of network; only differentially expressed ligands (at the transcriptional level) are included, and cell populations are size coded according to relative compositional changes inferred from gene expression data.
Complexity of the network can be reduced by focusing on families of ligands—Figure 3Aii and iii depict two subnetworks extracted from the total network; the TGF-β, and receptor tyrosine kinase (RTK) signaling growth factor (EGF, PDGF, and VEGF) modules, respectively. Although all populations secrete TGF-β ligands, megakaryocytes also secrete the TGF-β inhibitor LTBP1, as well as all three of the expansion-associated RTK growth factors. It is also notable that RTK pathways are known to display overlapping and functional synergistic effects (Fambrough et al, 1999). Examination of select subnetworks hence provides mechanistic insight behind the putative cell population-ligand functional interactions.
Focusing on differentially expressed ligand interactions highlights the complex and dynamic signals, which underlie culture evolution towards stem cell supportive versus non-supportive conditions. Figure 3B highlights the relative dominance of Megakaryocyte-associated signals in stem cell supportive cultures, and the relative dominance of monocyte-associated signals in the stem cell non-supportive condition. This analysis provides a visual depiction of the dynamic secreted factor interactions that occur during primary cell propagation, and insights into how the evolution of different cell types may be controlled in vitro.
Intercellular network validation
We next sought to functionally test the correlative data derived from the gene expression studies through a series of cell culture experiments (Figure 1; step 4). Cultures were designed to replicate the conditions under which the putative regulatory factors were identified, thereby capturing both direct and indirect effects. UCB Lin− cells were cultured in serum-free cytokine-supplemented media for 8 days, with or without saturating amounts of exogenous putative regulatory ligands, and assayed for total cell (TNC), progenitor (CFC), and primitive progenitor (LTCIC) population-fold expansions. Ligands for validation were selected based on the level of expression (Probe Match/Mismatch (PM/MM)>100), intercellular signaling activity, and commercial availability. We tested 18 of the potential regulatory factors; expansion-correlated ligands EGF, PDGB, IL16, SPARC, and VEGF; depletion-correlated ligands CCL2, CCL3, CCL4, CXCL10, FST, TNFSF9, and TGFB2; non-correlated ligands CCL5, CXCL8, HGF, and THBS1; as well as two proteins consistently detected in conditioned media but not differentially expressed, ADIPOQ and CXCL7.
Total cell (TNC), progenitor (CFC), and primitive progenitor (LTCIC) population expansions normalized to control cultures (supplemented with KITL, FLT3L, and THPO alone) are shown in Figure 4A. TGFB2 was the only factor found to significantly affect TNC and CFC output (negatively), consistent with previous studies (Cashman et al, 1990). Remarkably, at the level of primitive progenitor (LTCIC) population outputs, 3/5 novel predicted stimulatory ligands (EGF, PDGFB, and VEGF) displayed significant positive effects, 5/7 predicted inhibitory factors (CCL3, CCL4, CXCL10, TNFSF9, and TGFB2) displayed negative effects, whereas only 1/5 non-correlated ligands (CXCL7) displayed an effect. P-values (based on hypergeometric Z-scores) for this distribution of stimulatory, inhibitory, and null effects are 0.0042, 0.039, and 0.041, respectively (see Materials and methods), hence patterns of differential expression predict, with statistical significance, functional effects on primitive progenitor (LTCIC) output in culture. We also tested the functional activities of the small molecules serotonin (5HT1), and the TGFBRI antagonist SB-505124. Consistent with predictions but at subthreshold levels of significance, serotonin stimulation specifically enhanced LTCIC output, whereas inhibition of endogenous TGF-β signaling enhanced CFC but inhibited LTCIC expansions (Supplementary Figures S5A and B). Although factorial design experiments required to thoroughly assess functional interactions between endogenous ligands are currently unfeasible, select experiments using multiple stimulatory (EGF, VEGF, and HGF) and inhibitory (CCL3, CCL4, CXCL8, and CXCL10) ligands reveal non-linear effects; the functional effects of individual ligands are nullified or reduced in combination (Supplementary Figure S2C). Although it is difficult to draw mechanistic insight from this limited set of experiments, the data clearly demonstrates the complex context-dependent relationship between external stimuli and cellular responses, motivating future combinatorial experiments.
Figure 4.

Functional validation of cell population and secreted protein effects on progenitor expansion in vitro. (A) Eight day expansions of total cells (TNC), progenitors (CFC), and primitive progenitors (LTCIC) for cultures supplemented with stem cell expansion (green), depletion (red), and non-correlated (yellow) ligands in comparison to control cultures. Error bars=s.d., n=4–8. (B) Seven day LTCIC expansion from an enriched primitive cell population (Lin−RholoCD34+CD38−) cocultured with in vitro-generated megakaryocytes (MEG; CD41+), erythrocytes (E; CD235a+), and monocytes (MONO; CD14+) in comparison to control cultures. Error bars=95% CI, n=3. (C) Activity scores for secreted protein gene sets correlated with stem cell expansion (green), depletion (red), and non-correlated (yellow), for megakaryocyte (MEG), erythrocyte (E), and monocyte (MONO) cell population expression profiles from Ferrari et al (2007).
We similarly wished to test, for the first time, the functional effects of the Lin+ subpopulations on primitive progenitor (LTCIC) expansion. This involved recreating specific supportive and non-supportive cell–cell interactions to validate our cell-type specific gene expression patterns with functional activity. To accomplish this, we developed a novel coculture bioassay to test direct functional interactions between mature cell populations and highly enriched primitive stem and progenitor cells (Lin−RholoCD34+CD38−), schematically depicted in Supplementary Figure S6 and described in the Materials and methods. As shown in Figure 4B, in comparison to control cultures CD33+CD14+ monocytes (MONO) and CD71+CD235a+ erythrocytes (E) had a significant inhibitory effect, whereas megakaryocytes CD41+ (MEG) had a significant stimulatory effect on primitive progenitor (LTCIC) expansion.
To test whether these lineage-specific functional activities could be attributable to differential secretome profiles, activity scores for the stimulatory, inhibitory, and non-functional ligand gene sets were evaluated for the CD14+ monocyte, CD41+ megakaryocyte, and CD235a+ erythrocyte expression profiles from Ferrari et al (2007). As shown in Figure 4C, stimulatory ligands were, as predicted, significantly enriched in megakaryocytes, accounting for the functional activity of this lineage on primitive progenitor growth. Conversely, inhibitory ligands are expressed at moderately higher and lower levels in monocytes and megakaryoctes, respectively, and the non-functional ligands are expressed at very high levels across all three differentiated cell lineages. Although it is not possible to distinguish between secreted factor versus cell–cell contact mediated interactions from the bio-assay results, these patterns indicate the functional effects of mature cell lineages on progenitor cell growth can be attributed to the balance of secreted stimulatory versus inhibitory molecules in their cell population-specific secretome profiles.
Model simulations enable functional classification of endogenous regulatory ligands
Cellular responses to external stimuli, particularly in heterogeneous and dynamic cell populations, represent complex functions of multiple cell fate decisions acting both directly and indirectly on the target (stem cell) populations. Experimentally distinguishing the mode of action of cytokines is thus a difficult task, as phenotypic markers for human stem cells and self-renewal are unreliable in culture (Ito et al, 2009). We traced proliferation and apoptosis of CD34+ (progenitor enriched) cells by CFSE and AnnexinV staining for a limited set of cultures (see Supplementary Figure S7). From the earliest stages of culture (day 2) and throughout, TGFB2 suppressed proliferation, whereas VEGF and CCL4 had no effect. Apoptosis appeared to be slightly increased by TGFB2, CCL4 displayed unusual time-dependant effects, and VEGF had no effect. From these data, it is evident that TGFB2 is directly suppressing progenitor growth; however, differences in proliferation and apoptosis rates cannot account for the specific effects of VEGF and CCL4 on the LTCIC population. We therefore used our previously published interactive model of hematopoiesis (Kirouac et al, 2009) to classify the experimentally identified regulatory ligands into distinct functional categories (Figure 1; step 5). This is a differential equation-based compartment model of hematopoiesis, relating unobservable variables to measurable cellular readouts (TNC, CFC, and LTCIC growth), and incorporating kinetic parameters as functions of endogenous secreted factors (see Supplementary Figure S7A for details).
We simulated 8-day blood progenitor (UCB Lin−) cell cultures with a range of exogenously supplemented regulatory factors—proliferation and self-renewal inhibitors (SF1 and SF2) and stimulators (SF3 and SF4) (Figure 5A). Figure 5B depicts theoretical dose–response relationships between SF concentrations (normalized to ED50 values) and 8-day fold expansions of total cell (TNC), progenitor (CFC), and primitive progenitor (LTCIC) cell populations. On the basis of the differential weighted residual sum of squares metric (ΔWRSS) for comparing experimental data and alternative model simulations (see Supplementary information), ligands were classified into one of the four theoretical categories (Supplementary Figure S8C). TGFB2 displays SF1-type effects, CCL4, SPARC, and TNFSF9 display SF2-type effects, and EGF, VEGF, and PDGFB display SF4-type effects. CCL3 is not clearly distinguishable into SF 1, 2, or 3, but fits closest to SF3, and similarly CXCL10 classifies marginally as an SF2-type ligand. Cell population expansion data presented in Figure 4A are overlaid for direct comparison between theoretical and experimental outputs. The TGFBR antagonist SB-505124 displays SF3-type effects (Supplementary Figures S5B), consistent with the classification of TGFB2 as a proliferation inhibitor (SF1). Note that intercellular feedback in the system produces non-intuitive results. In particular, molecules that solely stimulate proliferation (SF3-type CCL3 and SB-505124) actually inhibit stem cell output. We are thus able to classify the mode of action of exogenous stimuli on HSCs and progenitors via parametric analysis of our model.
Figure 5.

Simulated activities of theoretical proliferation and self-renewal regulatory factors functionally classify experimentally identified ligands. (A) Schematic diagram representing theoretical interactions between endogenous secreted factors and cellular kinetic parameters. Self-renewal and the proliferation rates of stem cells and progenitors are regulated by the balance of endogenous inhibitory (SF2, SF1) and stimulatory (SF4, SF3) secreted regulatory factors. The LTCIC and CFC populations lie at successive stages downstream of the HSC within the Lin− population, whereas the TNC readout encompasses all cells (B) Simulated dose–response relationships between theoretical ligand concentrations (expressed as ED50 values) and 8-day fold total cell (TNC), progenitor (CFC), and primitive progenitor (LTCIC) expansions, normalized to control culture output. Experimental data from Figure 4 are overlaid for visual depiction of the model-based functional classifications of the ligands. Boxes indicate ±1 s.d., overlaid at estimated ligand ED50 concentrations. Asterisks indicate marginally optimal ligand classifications.
Intracellular molecular network integration
Stem and progenitor cells exposed to combinatorial extracellular signals must propagate this information through intracellular molecular networks, and respond appropriately by modifying cell fate decisions. Although many genes have been demonstrated to significantly stimulate or repress blood stem cell self-renewal divisions in isolation, how these are integrated within the cell's molecular circuitry remains poorly defined. To explore how our experimentally identified positive and negative regulatory signals are integrated at the intracellular level, we constructed a literature-curated blood stem cell self-renewal signaling network, and used it as a platform to identify putative extracellular signaling integration nodes (Figure 1; step 6). We compiled a list of 108 genes shown to modulate HSC self-renewal (in both human and/or mouse), as measured by in vivo repopulating assays (Supplementary Table S14). This set of genes was then searched against the i2D protein–protein interaction (PPI) database (Brown and Jurisica, 2005) for binding partners, producing a densely connected network of 2131 vertices and 5490 (non-unique) edges (Supplementary Figure S9A). The network was then filtered for active genes, consistently scored Present in our culture-generated Lin− cells (n=1728).
We next looked at the ‘active’ self-renewal PPI network for statistical enrichment of signaling molecules activated downstream of the various stimulatory and inhibitory ligands so as to understand how signals propagate through the cell's molecular network to affect self-renewal. Gene sets were compiled from PANTHER and KEGG pathway databases comprising the experimentally validated stimulatory pathways (EGF, PDGF, and VEGF) and inhibitory signaling pathways as validated experimentally (chemokine), predicted from gene expression data (Ras, and Insulin-IGF-MAPK), and from literature (FasL) (Bryder et al, 2001). From these, we identified 30 signaling molecules shared by all stimulatory pathways, and 15 signaling molecules shared by at least 3 of the inhibitory pathways. In all, 17/30 stimulatory and 12/15 inhibitory common molecules were represented in the network, of which six molecules were common to both sets. A subnetwork based on the first neighbors of the common signaling molecules consisting of 59 vertices and 138 (unique) edges is shown in Figure 6A. This subnetwork captures 39 of the self-renewal-associated proteins, a level of enrichment against genes represented in the PANTHER Pathways database corresponding to P<10−8 (hypergeometric Z-score). Although PPI databases are notoriously error prone (Cusick et al, 2009), the results are robust against increasingly stringent-filtered networks (see Supplementary Figure S10). This provides a mechanistic link between experimentally identified regulatory ligands, the signal transduction pathways activated by those ligands, and the entirety of published literature on the molecular genetics of self-renewal.
Figure 6.

Integration of endogenous regulatory signals in the HSC intracellular self-renewal network. (A) Endogenous secreted stimulators (VEGF, EGF, PDGF, and 5HT1) and inhibitors (CCL3, CCL4, CXCL10, TNFSF9, and TGFB2) activate cell surface receptors on HSCs, inducing signal transduction events, which are coherently processed by the intracellular network to modulate rates of self-renewal versus differentiation. Common signal transduction molecules shared by stimulatory pathways (left; green box), inhibitory pathways (right; red box), and both (center) are densely connected to known self-renewal effector genes. Physical protein–protein interactions from stimulatory and inhibitory pathways are represented as green and red edges, respectively, whereas internal interactions are represented as blue edges. (B) Five small molecule antagonists, described in the table with targets indicated by numbers on the network, were tested for functional effects on 8-day fold expansions of total cells (TNC), progenitors (CFC), and primitive progenitors (LTCIC) with respect to control cultures. (C) To classify the functional activities of the molecules, culture simulations were run over a feasible range of HSC self-renewal probabilities and proliferation rates. On the basis of ΔWRSS ranking of effects on TNC, CFC, and LTCIC output, inhibition of PI3K and Raf, reduces self-renewal, whereas inhibition of Akt reduces proliferation. Experimental data is overlaid for visual depiction of the model-based functional classifications of the kinase inhibitors. Boxes indicate ±1 s.d., overlaid at estimated effects levels.
Performing the same analysis on the common signaling molecules shared by the five neurological pathways associated with HSC expansion produces a subnetwork (15 vertices, 24 edges) of the larger stimulatory VEGF/EGF/PDGF network (Supplementary Figure S9C), thus linking neurological signaling pathways (and the functional effects of serotonin) with stimulatory growth factor signaling and self-renewal.
To independently test both the utility, and in vivo biological relevance of the self-renewal network as an analytical platform, we queried for the presence of self-renewal effectors identified from a recent in vivo screen wherein 16 novel nuclear factors with stimulatory activities on murine HSC self-renewal were identified (Deneault et al, 2009). Of the 15 genes with human orthologs, 6 (40%) are present in the active PPI network (Supplementary Figure S9D), a level of enrichment corresponding to P<10−6. This network is thus highly enriched for novel genes with potent functional effects on stem cell self-renewal.
This analysis therefore demonstrates that integrating experimental gene expression data with lists of literature-curated genes and protein interaction and pathway databases (i2D, PANTHER) can yield novel insights into the molecular mechanisms governing incompletely defined biological processes—in this case how a novel set of signaling molecules can modulate the self-renewal machinery of human blood stem cells. In particular, we have identified key molecular control points as targets for manipulation of self-renewal, information that should significantly accelerate the process of small molecule screening of blood progenitor cell fate modifiers, as demonstrated below.
Targeted intracellular molecular network perturbation
To experimentally test the intracellular signaling molecules computationally predicted as regulators of stem cell self-renewal, we searched for commercially available chemical modulators of the conserved signaling components. We obtained five small molecule antagonists of the kinases Phosphatidylinositol 3-kinase (PI3K), Raf, Akt, Phospholipase C (PLC), and MEK1. Because of non-specificity for gene family members, these five antagonists target 10 proteins represented in the self-renewal subnetwork, as indicated via numbers in Figure 6A and described in the adjacent table (Figure 1; step 7). Liquid cultures were supplemented with the five molecules individually, and resultant total cell (TNC), progenitor (CFC), and primitive progenitor (LTCIC) expansions were compared to control cultures. All five antagonists displayed differential inhibitory effects on TNC, CFC, and LTCIC growth (Figure 6B). The PLC antagonist U73122 was clearly inducing apoptosis, as cell numbers significantly declined within 2 days (data not shown) and did not recover. As the remaining four targets are likely involved in multiple cellular processes, we again used our model to deconvolute the functional effects on proliferation (and survival) versus self-renewal (Figure 1; step 8). We simulated liquid progenitor cultures over a range of HSC self-renewal probabilities (0–100%) and proliferation rates (0 to 4 per day), and compared TNC, CFC, and LTCIC outputs to our control results (Figure 6C). Note that inhibiting self-renewal has a more pronounced effect on progenitors (CFC and LTCIC) compared with total cell (TNC) output, whereas inhibiting proliferation has a very similar effect on all three cell populations. Again using the differential weighted residual sum of squares metric (ΔWRSS) for comparing experimental data and alternative model simulations (Supplementary information), the kinase inhibitors were classified into one of the four theoretical categories; inhibitors versus stimulators of self-renewal and proliferation (Supplementary Figure S11). This analysis cleanly classifies inhibition of PI3K and Raf activity as selectively targeting self-renewal, and inhibition of Akt activity with selectively targeting proliferation. MEK inhibition appears non-specific for these processes, and PLC activity is required for cell survival. In summary, this work indicates that a subset of the endogenous secreted regulators identified appear to be acting directly on stem cell self-renewal, identifies key pathways that may be important in regulating normal (and leukemic) stem cell fate machinery, and highlights the ability of our integrated computational and experimental strategy to identify novel molecular targets for cell fate modulation.
Discussion
To date, dynamic interactions between hierarchically related cell populations have not been experimentally interrogated. Using in vitro hematopoiesis as a model system, we have integrated genome-scale molecular profiling technologies, biological interaction databases, extensive literature curation, and mathematical modeling to identify secreted factor-mediated intercellular networks regulating blood stem cell fate decisions. To summarize, after defining culture manipulations capable of differentially modulating stem cell growth via non-cell autonomous effects, molecular profiling experiments were conducted to systematically explore the underlying molecular and cellular dynamics. Intercellular signaling networks were reconstructed using gene expression data, and network components (both secreted ligands and cell populations) tested for functional effects on blood stem cell growth in culture. An intracellular protein interaction network associated with blood stem cell self-renewal was then constructed from molecular databases, and used to identify core proteins onto which signaling pathways activated by the various functional ligands converge. Small molecule antagonists were used to perturb these intracellular targets, and a mechanistic model of blood cell development used to classify the effects of the extracellular and intracellular manipulations on cell population-specific kinetic parameters (self-renewal and proliferation).
The complex intercellular communication networks can be approximated as antagonistic positive–negative feedback circuit, wherein progenitor expansion is modulated by a balance of megakaryocyte-derived stimulatory factors (EGF, PDGFB, VEGF, and possibly serotonin) versus monocyte-derived inhibitory factors (CCL3, CCL4, CXCL10, TGFB2, and TNFSF9) (Figure 7). This complex milieu of endogenous regulatory signals is integrated and processed within a core intracellular network, converging on the signal integration nodes PI3K, Raf, Akt, and PLC, resulting in modulation of cell-level kinetic parameters (proliferation rates and self-renewal probabilities) (Figure 6A).
Figure 7.

Schematic summary of experimental findings. In addition to exogenous growth factors (FLT3LG, KITL, and THPO in our cultures), stem cell output is regulated by secreted factor-mediated cell–cell interactions. An antagonistic axis of intercellular communication is established, wherein culture-derived monocytes secrete high levels of factors (CCL3, CCL4, CXCL10, TGFB2, and TNSFS9), which inhibit stem cell self-renewal, whereas culture-derived megakaryocytes secrete high levels of factors (EGF, PDGFB, VEGF, and serotonin (5HT1)), which stimulate stem cell self-renewal, functioning as a coupled positive and negative intercellular feedback circuit.
Importantly, we did not set out to measure gene expression profiles of HSCs, as has been done extensively by others, but rather heterogeneous populations (Lin− and Lin+) comprising the HSC cellular microenvironment. Our results suggest new directions to modulate the stem cell niche in vitro and in vivo. Long-term repopulation activity (LT-SRC) is confined to VEGFR1+ cells, VEGF gene expression is upregulated in the bone marrow in response to hematopoietic injury (Gerber et al, 2002), and inhibiting VEGF signaling suppresses hematopoietic regeneration (Hattori et al, 2002), suggesting that autocrine and/or paracrine VEGF stimulation is required for HSC self-renewal in vivo. It has recently been shown that systemic VEGF administration induces blood progenitor cycling indirectly (Pitchford et al, 2009). Although (ongoing) in vivo studies are required to validate the effects of VEGF stimulation on LT-SRCs, our work indicates that direct manipulation of this pathway may serve as a new target for inducing HSC expansion in vitro. PDGF, in combination with other stimulatory cytokines, has been also shown to enhance the expansion of hematopoietic stem and progenitors in vitro (Su et al, 2002). However, there exists no published data on the effects of EGF signaling on hematopoietic stem and progenitor cells, or on the cell type-specific production and action of these factors within the blood stem cell hierarchy.
The bone marrow microenvironment is heavily innervated, and it has recently become apparent that complex cross-talk between nervous, bone, and blood cells regulates stem cell fate in vivo. Consistent with our results, the neurotransmitters dopamine and serotonin have both been shown to enhance HSC proliferation and engraftment in vivo (Spiegel et al, 2008). We extend these findings to show that serotonin is endogenously produced by blood cells in vitro, most likely megakaryocytes (Yang et al, 1996), and induces downstream signaling events that converge on the core self-renewal machinery.
There exists a wealth of literature on the potent inhibitory effects of TGF-β ligands on HSCs cycling in vitro and in vivo (Larsson and Karlsson, 2005); however, the effects on self-renewal are less clear due to the experimental difficulties in uncoupling the two processes. Although TNFSF2 (TNF-α) is a well-established inhibitor of HSC self-renewal (Dybedal et al, 2001), there exists no published data on the effects of other TNF family members, including TNFSF9. Many chemokines have been screened for effects on myeloid colony growth in vitro (Broxmeyer and Kim, 1999). Consistent with our findings, inhibitory effects were reported for CCL3 (MIP-1α), whereas IL8, CCL5 (RANTES), and CXCL7 (NAP-2) are reported to have no effects on colony growth. We have additionally identified CCL4 (MIP-1β), and CXCL10 (IP-10) as inhibitors of stem cell expansion in vitro, though predicted to be through different mechanisms (stimulation of proliferation and inhibition of self-renewal, respectively).
It is not surprising that some ligands (CCL3 and CXCL10) were not cleanly classified into one of the four theoretical functional categories (SF1-4), as ligands are known to display pleitropic functional activities. Because of the integrated molecular circuitry, the processes of self-renewal, proliferation, survival, and differentiation are not cleanly separated, and this classification scheme is therefore somewhat artificial. Indeed, many of the ‘self-renewal’ genes used as bait to construct the intracellular network (Supplementary Table S14) are well-established regulators of proliferation and survival, and our experimental results demonstrate that the tightly interconnected signal integration nodes affect self-renewal (PI3K and Raf) proliferation (Akt) and survival (PLC). Functional interactions between ligands, both at via intracellular ‘crosstalk’ and regulated secretion, add an additional complexity not accounted for by the model. Nonetheless, model simulations provide mechanistic insight into the direct versus indirect effects of exogenous regulators, inaccessible to experimental measurement.
It is very difficult (if not impossible) to differentiate between direct versus indirect effects when relying on the use of retrospective colony assays as functional readouts, as these measure proliferation and differentiation of heterogeneous, evolving cell populations. For example, PDGF is known to act as a positive feedback signal during megakaryopoiesis, secreted by platelets and stimulating the proliferation of megakaryocyte progenitors (Su et al, 2001). The stimulatory effects of PDGF may thus be mediated indirectly through enhanced megakaryocyte production and associated growth factor secretion (such as VEGF (Mohle et al, 1997)). The effects of exogenous ligands are thus mediated through complex and dynamic interactions with various cell populations and endogenous secreted ligands (Janes et al, 2006). In fact, the results of recent screen for nuclear factors stimulating HSC self-renewal found that 4/10 identified potent regulators acted through non-cell autonomous mechanisms (Deneault et al, 2009). This reveals an often neglected complexity of genetic studies—intercellular signaling can obscure direct versus indirect effects on target cell populations.
Although the results in Figure 4A show that ligands within the same functional category have little quantitative differences in their effects on fold LTCIC output, exogenous stimulation with ligands at saturating concentrations is distinct from the endogenous context in which these signals are received by the cells. Relative effects of the individual factors comprising the regulatory network will depend upon the cellular composition, ligand, and receptor expression levels, and KD values for ligand–receptor interactions. We are currently developing algorithms to ‘weight’ relative strength of interactions, to provide a more quantitative and nuanced view of the intercellular communication networks established in vitro and in vivo.
Furthermore, high-level combinatorial effects at both the intercellular and intracellular signaling levels are likely to have a role in mediating cellular responses (Natarajan et al, 2006), clearly demonstrated by non-linear effects observed in the combinatorial experiments (Supplementary Figure S5C). Although this context dependency was addressed somewhat implicitly in the experimental design, as endogenous produced factors will be present during exogenous ligand stimulation, detailed examination of the multivariate responses to combinatorial signals is essential to our understanding of intracellular signal processing machinery. Indeed IL16 and SPARC (as well as other molecules) may function as cofactors for other supportive cytokines; SPARC is in fact a matricellular protein in the same family as osteopontin, a key in vivo regulator of the HSC niche produced by megakaryocytes (Kacena et al, 2006). Other non-functional ligands may exert combinatorial effects with other stimulatory/inhibitory factors on stem and progenitor cell growth, and may display diverse functional effects on other cell populations. Factorial design experiments necessary to systematically assess context-dependent activities are largely impractical due to the labor-intensive nature of the (LTCIC and CFC) assays. However, microfluidic cell culture platforms may enable high-throughput experiments required for multidimensional response surface analyses in the near future (Gomez-Sjoberg et al, 2007).
One of the most fundamental questions in cell biology is ‘how are cells capable of converting complex information about their microenvironment into logical cell fate decisions?’ As the combinatorial possibilities of external stimuli converge on a limited set of cellular responses, we asked whether the various pathways regulating self-renewal divisions converge on a limited set of key nodes, and whether we could use available databases to identify these. From this framework, we attempted to systematically integrate the wealth of published literature on the genetic regulation of HSC self-renewal using PPI databases to construct an intracellular self-renewal signaling network. Using this network as a platform for further interrogation, we found that stimulatory and inhibitory signaling pathways converge on a core set of molecules integrated within this network, and targeted inhibition of a subset of these molecules specifically modulates self-renewal (Raf and PI3K). Our findings are consistent with recent genetic studies on fetal murine hematopoiesis, showing AKT and PI3K-deficient cells as deficient in cell cycle progression and self-renewal capacities respectively (Juntilla et al, 2010). A main limitation arises from the fact that the network does not contain information on the directionality or functional significance of protein interactions. It is also notable that most of the common signaling molecules interact with multiple functionally annotated genes, and vice versa, with no statistical bias between stimulatory/inhibitory pathways and genes. As a result, it is very difficult, if not impossible, to predict the functional effects of perturbing individual genes based solely on the intracellular network topology. Furthermore, the molecular antagonists available to perturb these targets most likely have multiple off-target effects (Bamborough et al, 2008), obscuring analysis and contributing to discrepancies between predicted and observed results.
We can speculate on the biological logic underlying the topology of the intercellular signaling network controlling stem cell self-renewal. It may be related to cellular localization—megakaryocytes are reported to have an integral part of the HSC niche via stimulating proliferation and differentiation of osteoblasts (Kacena et al, 2006), whereas monocytes, macrophages, granulocytes, and erythrocytes, comprising a large proportion of peripheral blood, may serve as sentinel markers of systemic cell density. Consistent with our results, it has recently been reported that CD14+ monocyte depletion enhances UCB ex vivo culture output (Yang et al, 2010). Data recently obtained from the Dr Benjamin Ebert's group (Harvard Medical School), consisting of expression profiles of >20 purified uncultured cell populations comprising the hematopoietic hierarchy, reveals that stimulatory ligands are enriched in megakaryocytes and inhibitory ligands are enriched in granulocytes, suggesting that the intercellular regulatory networks established in vitro recapitulate those found in vivo (not shown).
The most direct utility of these findings lay in designing strategies for the expansion of HSCs for clinical use (Delaney et al, 2010). An ideal culture media may consist of high-level supplementation with multiple stimulatory factors (EGF, PDGFB, VEGF, and/or serotonin) plus small molecule or antibody-based antagonists of the inhibitory factors (CCL3, CCL4, CXCL10, TGFB2, and TNFSF9). Because of non-linear interactions, combinatorial experiments are required to define optimal media supplements, which may in fact be dependent upon time and cellular composition. Combined with appropriate cell subpopulation selection and media dilution rates, we thus have a foundation to systematically manipulate intercellular signaling dynamics and thereby control HSC self-renewal in vitro (Delaney et al, 2010). Although we have tested and validated a limited number of intracellular targets using small molecule antagonists, the network should serve as a predictive platform for future (high throughput) screens for modulators of self-renewal. Because of the high-dimensional complexity and redundancy of extracellular signals, we predict that targeting key intracellular control points (i.e. PI3K, Raf, and Akt) will prove to be a better strategy for inducing robust HSC expansion.
Materials and methods
Cell sample collection and processing
UCB samples were obtained from consenting donors according to the procedures accepted by the ethics boards of Mt Sinai hospital (Toronto, ON, Canada), Joseph Brandt hospital (Burlington, ON, Canada), and Credit Valley Hospital (Mississauga, ON, Canada). Mononuclear cells were obtained and lineage depleted (Lin−) cells isolated from the mononuclear cell fraction using the StemSep system (Stem Cell Technologies Inc; STI, Vancouver, BC, Canada) as described in Kirouac et al (2009).
Cell culture
UCB Lin− cells were cultured in serum-free media with saturating amounts of the cytokines KITL, FLT3L, and THPO as described in Madlambayan et al (2006). Cultures were maintained on a rocking table so as to thoroughly mix the contents and minimize microenvironmental heterogeneity. For the ligand functional validation and signal transduction inhibitor studies, 1 ml cultures were supplemented with saturating amounts of recombinant human proteins or small molecules (estimated from the manufacturer's data sheets, and indicated below), and subject to a media exchange at day 4. ADIPOQ (1000 ng/ml), CCL2 (100 ng/ml), CCL3 (50 ng/ml), CCL4 (50 ng/ml), CCL5 (10 ng/ml), CXCL8 (100 ng/ml), CXCL10 (50 ng/ml), EGF (1 ng/ml), FST (500 ng/ml), HGF (50 ng/ml), IL16 (100 ng/ml), PDGFBB (5 ng/ml), TGFB2 (10 ng/ml), TNFSF9 (10 ng/ml), and VEGF (10 ng/ml) were purchased from Peprotech (Rocky Hill, NJ), and CXCL7 (100 ng/ml) and SPARC (100 ng/ml) were purchased from R&D Systems (Minneapolis, MN). The small molecule antagonists LY294002 (10 μM), Degulin (10 μM), U73122 (10 μM), BAY439006 (10 μM), and PD0325901 (1 μM) were purchased from Axon Medchem (Groningen, The Netherlands), and SB-505124 (1 μM) was purchased from R&D Systems. Seretonin–creatine sulphide complex (10 μM) was purchased from Sigma-Aldrich (St Louis, MO). All cultures were maintained on an orbital shaker at 37°C in a humidified atmosphere of 5% CO2 in air.
Progenitor cell assays
Cells were assayed for CFC and LTCIC frequency as described in Madlambayan et al (2005) using complete media from STI. A description of human and murine functional stem cell assays is provided in the Supplementary information.
Coculture bioassay
Differentiated cells were generated by seeding UCB Lin− cells at 104 cells/ml into serum-free Stem Span media (STI) supplemented with the SCF, FL, TPO cocktail myeloid cell production, or 20 ng/ml SCF, 2 ng/ml IL3, 1 ng/ml GM-CSF, and 1 U/mL EPO (all from R&D Systems) for erythrocyte production. Cultures were maintained in 25 ml T-flasks, with a media exchange and approximate five-fold culture dilution performed at day 7. At day 14, the cells were harvested, washed, and suspended in HBSS-HS at 106 to 107 cell/ml for staining with CD33-PE and CD14-FITC, CD33-PE and CD15-FITC, CD41-FITC, or CD71-FITC and CD235a-PE antibodies (Beckman Coulter, Fulleryon, CA). In all, 30 min prior to sorting, cells were stained with 7 aminoacitinomycin (7-AAD; Invitrogen, Carlsbad, CA) for live cell selection. In parallel, fresh Lin− cells were first stained with Rho123 then stained with CD34 and CD38 antibodies as described in the Supplementary information.
Cells were sorted under sterile conditions at the SickKids-UHN Flow Cytometry Facility (TMDT, Toronto, ON, Canada) on a MoFlo sorter (Dako Cytomation, Glostrup, Denmark). In all, 10 fresh Lin−RholoCD34+CD38− cells (Rholo defined as the lowest 25% of the population) were sorted into round-bottom 96-well culture plates (Starstedt, Numbrecht, Germany) containing 100 μl standard media. 100 live (7-AAD−) CD33+CD14+ (monocytes), CD33+CD15+ (granulocytes), CD41+ (megakaryocytes), or CD71+CD235a+ (erythrocytes) cells were then subsequently sorted into the wells. Round-bottom plates were chosen to ensure close contact between the cells, thereby enhancing paracrine signals. Plates were visually checked shortly after sorting using an inverted microscope to ensure the sorting procedure was effective. Culture plates were then incubated for 7 days, after which wells were pooled and re-plated at limiting dilutions (1:1, 1:2.5, and 1:10) onto 96-well flat bottom culture plates (Corning Inc., Corning, NY) with pre-established and irradiated M2-10B4 feeder layers maintained in MyeloCult H5100 media (STI). Cultures were maintained for 5 weeks with weekly half-media exchanges, after which media was gently aspirated and replaced with methylcellulose-based media (MethoCult H4435, STI). After 14 days of further incubation, wells were visually scored for the presence or absence of CFCs, and LTC-IC frequency determined using the maximum likelihood estimator based on Poisson statistics using L-Calc Software (STI).
RNA Isolation and GeneChip hybridization
The following time points/conditions were chosen for microarray analysis; d0, d4, d8-SE, d8-NSNE, and d12, as these cover a range of HSC culture activity. At each time point, cells were separated into Lin− and Lin+ fractions as described, yielding 10 cell populations in total for analysis in biological duplicate. Total RNA was purified using RNeasy Mini Kits (Qiagen GmbH, Hilden, Germany) according to the manufacturer's instructions. Yield and RNA quality was assessed using the Bioanalyzer 2100 system (Agilent, Waldbronin, Germany). Sample amplification, hybridization, and array scanning were performed at The Centre for Applied Genomics (TCAG; Toronto, ON, Canada). Raw data are available from GEO (http://www.ncbi.nlm.nih.gov/projects/geo/; series accession number GSE16589).
Microarray data processing and analysis
CEL files generated at the TCAG were analyzed using dChip v2006 software (http://www.dchip.org) as described in the Supplementary information. The PANTHER database and web-based software program (http://www.pantherdb.org/) was used to analyze gene lists for statistical enrichment of biological processes and 165 expert-curated signaling pathways using the binomial test. P-value cutoffs were set at P⩽10−3, equivalent to Bonferroni corrected values of P<0.05.
Comparison to published gene expression data
The 55 published gene sets used are summarized in Supplementary Table S1 and described in the Supplementary information. To quantify the expression level of the published gene lists in our microarray expression data in comparison to background levels, we calculated the gene set activity score (agj) for each gene set (g) in sample (j) as defined in Lee et al (2008):
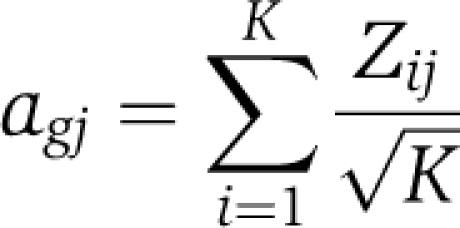 |
wherein Zij is the Z-score for gene i in sample j, normalized to background expression across the entire array, for K total genes comprising each gene set. Expression indices (Probe Match/Mismatch; f) were first log-transformed to produce a Gaussian distribution, and resulting ∣ag∣⩾2 corresponds to P⩽0.05 (t-test).
Intercellular network reconstruction
A list of 270 ligand–receptor interactions (Supplementary Table S12) was manually curated, largely based on the COPE database (http://www.copewithcytokines.de/). This list was used to define autocrine and paracrine intercellular signaling connections between Lin− and Lin+ cells at each time point/culture conditioned profiled (d4, d8-SE, d8-NENE, d12) based on expression patterns, as described in detail in the Supplementary information. An excel file that can be used to automate this process from Affymetrix expression data are provided (Supplementary information).
PPI network mapping
Entrez Gene IDs for gene lists of interest (HSC self-renewal genes and PANTHER-defined pathways) were searched against the i2D database (http://ophid.utoronto.ca/ophidv2.201/index.jsp).
All networks were visualized using Cytoscape v2.6 (http://www.cytoscape.org/).
Statistics
The effect of exogenous ligands on cell population expansions were determined using linear regression analysis of variance, implemented using JMP Student Edition v.6 software (SAS Institute Inc., Cary, NC).
The hypergenometric Z-score is given by
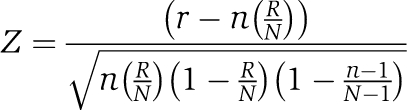 |
where N=total number of elements (i.e. genes), R=total number of positive elements, n=sample size, and r=number of positive elements in sample, as described in Doniger et al (2003). Individual calculations are described in detail in the Supplementary information.
Model simulations
Our mathematical model, described in the Supplementary information (Kirouac et al, 2009), was simulated using MATLAB R2008b (The Mathworks, Natick, MA) software.
Supplementary Material
Supplementary information, Supplementary figures S1–11
Acknowledgments
We thank Xiaolin Wang of The Centre for Applied Genomics for assistance with generating microarray data, and Sheyun Zhao at SickKids-UHN Flow cytometry facility for cell sorting. We thank Dr Julio Saez-Rodriguez as well as the reviewers for their many helpful comments and suggestions. Support for this work was provided by Insception Biosciences, the Guggenheim Foundation, the Canadian Stem Cell Network, and the Natural Sciences and Research Council of Canada (NSERC). DCK was an NSERC Post Graduate scholar and PWZ is the Canadian Research Chair in Stem Cell Bioengineering. The Ontario Genomics Institute Genomics Publication Fund has provided funds towards the open access publication of this manuscript.
Footnotes
The authors declare that they have no conflict of interest.
References
- Bamborough P, Drewry D, Harper G, Smith GK, Schneider K (2008) Assessment of chemical coverage of kinome space and its implications for kinase drug discovery. J Med Chem 51: 7898–7914 [DOI] [PubMed] [Google Scholar]
- Brown KR, Jurisica I (2005) Online predicted human interaction database. Bioinformatics 21: 2076–2082 [DOI] [PubMed] [Google Scholar]
- Broxmeyer HE, Kim CH (1999) Regulation of hematopoiesis in a sea of chemokine family members with a plethora of redundant activities. Exp Hematol 27: 1113–1123 [DOI] [PubMed] [Google Scholar]
- Bryder D, Ramsfjell V, Dybedal I, Theilgaard-Monch K, Hogerkorp CM, Adolfsson J, Borge OJ, Jacobsen SE (2001) Self-renewal of multipotent long-term repopulating hematopoietic stem cells is negatively regulated by Fas and tumor necrosis factor receptor activation. J Exp Med 194: 941–952 [DOI] [PMC free article] [PubMed] [Google Scholar]
- Cashman JD, Eaves AC, Raines EW, Ross R, Eaves CJ (1990) Mechanisms that regulate the cell cycle status of very primitive hematopoietic cells in long-term human marrow cultures. I. Stimulatory role of a variety of mesenchymal cell activators and inhibitory role of TGF-beta. Blood 75: 96–101 [PubMed] [Google Scholar]
- Cusick ME, Yu H, Smolyar A, Venkatesan K, Carvunis AR, Simonis N, Rual JF, Borick H, Braun P, Dreze M, Vandenhaute J, Galli M, Yazaki J, Hill DE, Ecker JR, Roth FP, Vidal M (2009) Literature-curated protein interaction datasets. Nat Methods 6: 39–46 [DOI] [PMC free article] [PubMed] [Google Scholar]
- Delaney C, Heimfeld S, Brashem-Stein C, Voorhies H, Manger RL, Bernstein ID (2010) Notch-mediated expansion of human cord blood progenitor cells capable of rapid myeloid reconstitution. Nat Med 16: 232–236 [DOI] [PMC free article] [PubMed] [Google Scholar]
- Deneault E, Cellot S, Faubert A, Laverdure JP, Frechette M, Chagraoui J, Mayotte N, Sauvageau M, Ting SB, Sauvageau G (2009) A functional screen to identify novel effectors of hematopoietic stem cell activity. Cell 137: 369–379 [DOI] [PMC free article] [PubMed] [Google Scholar]
- Doniger SW, Salomonis N, Dahlquist KD, Vranizan K, Lawlor SC, Conklin BR (2003) MAPPFinder: using Gene Ontology and GenMAPP to create a global gene-expression profile from microarray data. Genome Biol 4: R7. [DOI] [PMC free article] [PubMed] [Google Scholar]
- Dybedal I, Bryder D, Fossum A, Rusten LS, Jacobsen SE (2001) Tumor necrosis factor (TNF)-mediated activation of the p55 TNF receptor negatively regulates maintenance of cycling reconstituting human hematopoietic stem cells. Blood 98: 1782–1791 [DOI] [PubMed] [Google Scholar]
- Eisen MB, Spellman PT, Brown PO, Botstein D (1998) Cluster analysis and display of genome-wide expression patterns. Proc Natl Acad Sci USA 95: 14863–14868 [DOI] [PMC free article] [PubMed] [Google Scholar]
- Fambrough D, McClure K, Kazlauskas A, Lander ES (1999) Diverse signaling pathways activated by growth factor receptors induce broadly overlapping, rather than independent, sets of genes. Cell 97: 727–741 [DOI] [PubMed] [Google Scholar]
- Ferrari F, Bortoluzzi S, Coppe A, Basso D, Bicciato S, Zini R, Gemelli C, Danieli GA, Ferrari S (2007) Genomic expression during human myelopoiesis. BMC Genomics 8: 264. [DOI] [PMC free article] [PubMed] [Google Scholar]
- Frankenstein Z, Alon U, Cohen IR (2006) The immune-body cytokine network defines a social architecture of cell interactions. Biol Direct 1: 32. [DOI] [PMC free article] [PubMed] [Google Scholar]
- Gerber HP, Malik AK, Solar GP, Sherman D, Liang XH, Meng G, Hong K, Marsters JC, Ferrara N (2002) VEGF regulates haematopoietic stem cell survival by an internal autocrine loop mechanism. Nature 417: 954–958 [DOI] [PubMed] [Google Scholar]
- Gomez-Sjoberg R, Leyrat AA, Pirone DM, Chen CS, Quake SR (2007) Versatile, fully automated, microfluidic cell culture system. Anal Chem 79: 8557–8563 [DOI] [PubMed] [Google Scholar]
- Hattori K, Heissig B, Wu Y, Dias S, Tejada R, Ferris B, Hicklin DJ, Zhu Z, Bohlen P, Witte L, Hendrikx J, Hackett NR, Crystal RG, Moore MA, Werb Z, Lyden D, Rafii S (2002) Placental growth factor reconstitutes hematopoiesis by recruiting VEGFR1(+) stem cells from bone-marrow microenvironment. Nat Med 8: 841–849 [DOI] [PMC free article] [PubMed] [Google Scholar]
- Ito CY, Kirouac DC, Madlambayan GJ, Yu M, Rogers I, Zandstra PW (2009) The AC133+CD38-, but not the rhodamine-low, phenotype tracks LTC-IC and SRC function in human cord blood ex vivo expansion cultures. Blood 115: 257–260 [DOI] [PubMed] [Google Scholar]
- Janes KA, Gaudet S, Albeck JG, Nielsen UB, Lauffenburger DA, Sorger PK (2006) The response of human epithelial cells to TNF involves an inducible autocrine cascade. Cell 124: 1225–1239 [DOI] [PubMed] [Google Scholar]
- Juntilla MM, Patil VD, Calamito M, Joshi RP, Birnbaum MJ, Koretzky GA (2010) AKT1 and AKT2 maintain hematopoietic stem cell function by regulating reactive oxygen species. Blood 115: 4030–4038 [DOI] [PMC free article] [PubMed] [Google Scholar]
- Kacena MA, Gundberg CM, Horowitz MC (2006) A reciprocal regulatory interaction between megakaryocytes, bone cells, and hematopoietic stem cells. Bone 39: 978–984 [DOI] [PubMed] [Google Scholar]
- Kiel MJ, Morrison SJ (2008) Uncertainty in the niches that maintain haematopoietic stem cells. Nat Rev Immunol 8: 290–301 [DOI] [PubMed] [Google Scholar]
- Kirouac DC, Madlambayan GJ, Yu M, Sykes EA, Ito C, Zandstra PW (2009) Cell-cell interaction networks regulate blood stem and progenitor cell fate. Mol Syst Biol 5: 293. [DOI] [PMC free article] [PubMed] [Google Scholar]
- Kirouac DC, Zandstra PW (2006) Understanding cellular networks to improve hematopoietic stem cell expansion cultures. Curr Opin Biotechnol 17: 538–547 [DOI] [PubMed] [Google Scholar]
- Lander AD, Gokoffski KK, Wan FY, Nie Q, Calof AL (2009) Cell lineages and the logic of proliferative control. PLoS Biol 7: e15. [DOI] [PMC free article] [PubMed] [Google Scholar]
- Larsson J, Karlsson S (2005) The role of Smad signaling in hematopoiesis. Oncogene 24: 5676–5692 [DOI] [PubMed] [Google Scholar]
- Lee E, Chuang HY, Kim JW, Ideker T, Lee D (2008) Inferring pathway activity toward precise disease classification. PLoS Comput Biol 4: e1000217. [DOI] [PMC free article] [PubMed] [Google Scholar]
- Macarthur BD, Ma’ayan A, Lemischka IR (2009) Systems biology of stem cell fate and cellular reprogramming. Nat Rev Mol Cell Biol 10: 672–681 [DOI] [PMC free article] [PubMed] [Google Scholar]
- Madlambayan GJ, Rogers I, Kirouac DC, Yamanaka N, Mazurier F, Doedens M, Casper RF, Dick JE, Zandstra PW (2005) Dynamic changes in cellular and microenvironmental composition can be controlled to elicit in vitro human hematopoietic stem cell expansion. Exp Hematol 33: 1229–1239 [DOI] [PubMed] [Google Scholar]
- Madlambayan GJ, Rogers I, Purpura KA, Ito C, Yu M, Kirouac D, Casper RF, Zandstra PW (2006) Clinically relevant expansion of hematopoietic stem cells with conserved function in a single-use, closed-system bioprocess. Biol Blood Marrow Transplant 12: 1020–1030 [DOI] [PubMed] [Google Scholar]
- Mayack SR, Shadrach JL, Kim FS, Wagers AJ (2010) Systemic signals regulate ageing and rejuvenation of blood stem cell niches. Nature 463: 495–500 [DOI] [PubMed] [Google Scholar]
- Mohle R, Green D, Moore MA, Nachman RL, Rafii S (1997) Constitutive production and thrombin-induced release of vascular endothelial growth factor by human megakaryocytes and platelets. Proc Natl Acad Sci USA 94: 663–668 [DOI] [PMC free article] [PubMed] [Google Scholar]
- Natarajan M, Lin KM, Hsueh RC, Sternweis PC, Ranganathan R (2006) A global analysis of cross-talk in a mammalian cellular signalling network. Nat Cell Biol 8: 571–580 [DOI] [PubMed] [Google Scholar]
- Pitchford SC, Furze RC, Jones CP, Wengner AM, Rankin SM (2009) Differential mobilization of subsets of progenitor cells from the bone marrow. Cell Stem Cell 4: 62–72 [DOI] [PubMed] [Google Scholar]
- Spiegel A, Kalinkovich A, Shivtiel S, Kollet O, Lapidot T (2008) Stem cell regulation via dynamic interactions of the nervous and immune systems with the microenvironment. Cell Stem Cell 3: 484–492 [DOI] [PubMed] [Google Scholar]
- Su RJ, Li K, Yang M, Zhang XB, Tsang KS, Fok TF, Li CK, Yuen PM (2001) Platelet-derived growth factor enhances ex vivo expansion of megakaryocytic progenitors from human cord blood. Bone Marrow Transplant 27: 1075–1080 [DOI] [PubMed] [Google Scholar]
- Su RJ, Zhang XB, Li K, Yang M, Li CK, Fok TF, James AE, Pong H, Yuen PM (2002) Platelet-derived growth factor promotes ex vivo expansion of CD34+ cells from human cord blood and enhances long-term culture-initiating cells, non-obese diabetic/severe combined immunodeficient repopulating cells and formation of adherent cells. Br J Haematol 117: 735–746 [DOI] [PubMed] [Google Scholar]
- Yang H, Robinson SN, Lu J, Decker WK, Xing D, Steiner D, Parmar S, Shah N, Champlin RE, Munsell M, Leen A, Bollard C, Simmons PJ, Shpall EJ. (2010) CD3(+) and/or CD14(+) depletion from cord blood mononuclear cells before ex vivo expansion culture improves total nucleated cell and CD34(+) cell yields. Bone Marrow Transplant 45: 1000–1007 [DOI] [PMC free article] [PubMed] [Google Scholar]
- Yang M, Srikiatkhachorn A, Anthony M, Chesterman CN, Chong BH (1996) Serotonin uptake, storage and metabolism in megakaryoblasts. Int J Hematol 63: 137–142 [PubMed] [Google Scholar]
Associated Data
This section collects any data citations, data availability statements, or supplementary materials included in this article.
Supplementary Materials
Supplementary information, Supplementary figures S1–11