Abstract
Increased activity of Ser/Thr protein phosphatases types 1 (PP1) and 2A (PP2A) during maladaptive cardiac hypertrophy contributes to cardiac dysfunction and eventual failure, partly through effects on calcium metabolism. A second maladaptive feature of pressure overload cardiac hypertrophy that instead leads to heart failure by interfering with cardiac contraction and intracellular transport is a dense microtubule network stabilized by decoration with microtubule-associated protein 4 (MAP4). In an earlier study we showed that the major determinant of MAP4-microtubule affinity, and thus microtubule network density and stability, is site-specific MAP4 dephosphorylation at Ser-924 and to a lesser extent at Ser-1056; this was found to be prominent in hypertrophied myocardium. Therefore, in seeking the etiology of this MAP4 dephosphorylation, we looked here at PP2A and PP1, as well as the upstream p21-activated kinase 1, in maladaptive pressure overload cardiac hypertrophy. The activity of each was increased persistently during maladaptive hypertrophy, and overexpression of PP2A or PP1 in normal hearts reproduced both the microtubule network phenotype and the dephosphorylation of MAP4 Ser-924 and Ser-1056 seen in hypertrophy. Given the major microtubule-based abnormalities of contractile and transport function in maladaptive hypertrophy, these findings constitute a second important mechanism for phosphatase-dependent pathology in the hypertrophied and failing heart.
Keywords: Cytoskeleton, Heart, Microtubules, PP1, PP2A
Introduction
Pathological cardiac hypertrophy may be accompanied by increased density and MAP42 decoration of the cardiomyocyte microtubule network (1, 2), which causes defects in cellular contractile (3, 4) and transport (5, 6) function. We recently have described, in pathological but not physiological cardiac hypertrophy, site-specific dephosphorylation of three MAP4 serine residues (7); one site is in the MAP4 projection domain, and two are in the microtubule-binding domain. Of these, the striking dephosphorylation at feline MAP4 Ser-924 corresponding to human MAP4 Ser-914 within the first of the four KXGS repeats of the MAP4 microtubule-binding domain was especially interesting, because adenoviral expression of a dephosphomimetic Ser-924 → Ala feline MAP4 mutant in normal cardiomyocytes phenocopied the features of microtubule network densification, stabilization, and MAP4 overdecoration seen in pathological cardiac hypertrophy. Conversely, adenoviral expression of a phosphomimetic Ser-924 → Asp feline MAP4 mutant in normal cells caused microtubule depolymerization.
This first MAP4 microtubule-binding domain KXGS motif repeat is closely homologous to the corresponding first repeat in the neuronal MAP Tau, with feline MAP4 Ser-924 corresponding to human full-length Tau Ser-262, and it is known that phosphorylation of both MAP4 and Tau at the respective serine residues virtually abolishes MAP binding to microtubules, with consequent microtubule network destabilization (8, 9). Indeed, hyperphosphorylation of Tau Ser-262, leading to aggregation of the detached Tau into neurofibrillary tangles, is a hallmark of Alzheimer disease (10). These cytoskeletal changes are due to an increase in the relevant kinase activity and a decrease in the relevant phosphatase activity. Thus, it is known that in Alzheimer disease brain there is increased activity of the major microtubule affinity-regulating kinase (MARK) responsible for phosphorylating the KXGS motifs in the microtubule-binding domain of MAPs (11). It is also known that there is decreased activity of both PP1 and PP2A in Alzheimer disease (12), and PP2A is the phosphatase that controls Tau Ser-262 dephosphorylation (13, 14). The conceptual basis for the present study, which was framed within this context, is that microtubule changes in the hypertrophied and failing heart may be caused by mechanisms similar in kind to those causing Alzheimer disease, where a persistent imbalance between phosphatase and kinase activities causes hyperphosphorylation of Tau, which then has reduced microtubule affinity. In contrast, however, we are hypothesizing here that in cardiac hypertrophy and failure, a persistent but directionally opposite imbalance between phosphatase and kinase activities could cause dephosphorylation of MAP4, with the resultant increase in MAP4 affinity for microtubules leading to microtubule network stabilization and densification.
Turning first to the role of phosphatases in pathological hypertrophy, it seemed logical to start upstream with the multifunctional enzyme Pak1, a member of a family of proteins in the small G protein signaling pathway that is activated by Cdc42 and Rac1, because there is evidence in the heart that activation of Pak1 is linked to activation of PP2A (15). That is, Pak1 is known to form a heterodimeric complex with PP2A, and upon activation of Pak1, PP2A is known to undergo autodephosphorylation and activation (15). In addition, whereas PP1 activity is regulated by multiple inputs, activation of PP2A, as is the case with PP2B, may indirectly activate PP1 via PP2A-mediated inactivation (10, 16) of the endogenous PP1 inhibitor, I-1 (17). Further, upstream agonists that initiate Cdc42 and Rac1 signaling cascades are involved in cardiac hypertrophy (15), and there is early evidence from others (18) that Pak1 is activated as an initial response to cardiac pressure overloading. Thus, whereas multiple inputs activate both PP1 and PP2A, a Pak1-based cascade is an attractive initial candidate to examine in exploring hypertrophic activation of these two phosphatases. Turning next to the obverse, the role of kinases, we elected to examine here the quantity and activity of MARK2, because this member of the MARK family of kinases is abundant in the heart (11), and it has as a target the serine within the KXGS motif of the first microtubule-binding domain repeat of both Tau and MAP4 (8, 11). Taken together, the findings of the present study examining the relevant phosphatase and kinase activities support a predominant role of Pak1-driven activation of PP2A and to a lesser extent activation of PP1 in the site-specific MAP4 dephosphorylation that appears to be responsible for the microtubule network changes characteristic of pathological cardiac hypertrophy.
EXPERIMENTAL PROCEDURES
Right Ventricular Pressure Overloading
Pressure overload hypertrophy of the feline right ventricle (RV) without associated RV failure was created as before (19, 20) by placement of a 3.5-mm-inner diameter pulmonary artery band (PAB). The normally loaded left ventricle (LV) served as a same-animal control. Because the RV mass increase stabilizes by ∼4 weeks after a step increase in load (21), at 2 or 4 weeks after surgery, the intravascular pressures were measured in these and in normal control cats; the values in the systemic circulation were the same for all groups.
Transgenic Mice
Three strains of transgenic mice were used in this study. The first mouse, from U. Gergs and J. Neumann, has cardiac-restricted overexpression of catalytic subunit α of PP2A (PP2Acα) driven by the α-myosin heavy chain promoter; in this mouse, cardiac expression of PP2Acα is increased 2.1-fold, and PP2A activity is increased 1.7-fold (22). The second mouse, from A. A. DePaoli-Roach, has cardiac-restricted overexpression of catalytic subunit α of PP1 (PP1cα) driven by the α-myosin heavy chain promoter; in this mouse, cardiac expression of PP1cα is increased 3.5-fold, and PP1 activity is increased 2.8-fold (23). The third mouse from this laboratory has cardiac-restricted overexpression of MAP4 driven by the α-myosin heavy chain promoter (24); for the purposes of the present study we used a strain having a very high, ∼20-fold level of MAP4 overexpression. For both mice and cats, all of the operative procedures were carried out under full surgical anesthesia; all of the procedures and the care of the animals were in accordance with institutional guidelines.
Adenoviruses
Three replication-deficient recombinant adenoviruses were used in this study. The first, AdPak1, was a generous gift from R. J. Solaro (25); it encodes constitutively active Pak1. The second, AdKDPak1, was a generous gift from Q. Liang (18); it encodes kinase-dead Pak1-K299R. The third, AdI-1, was a generous gift from R. J. Hajjar (23); it encodes constitutively active PP1 I-1, an endogenous inhibitor of PP1 (17).
Immunoblots
For MAP4, myocardial samples were homogenized in a high salt buffer (100 mm Tris-HCl, pH 7.4, 10 mm EGTA, 0.35 m NaCl), immediately put on ice for 20 min, boiled, and centrifuged at 16,000 × g at 4 °C for 30 min. SDS-PAGE was carried out on the supernatants with equal protein loading for each sample using a pre-cast 3–8% gradient Tris acetate gel (NuPAGE; Invitrogen). Isolated cardiomyocyte samples were prepared in the same way with the exception that 1% Nonidet P-40 was added to the high salt buffer. Separated proteins were transferred to polyvinylidene difluoride membranes (Immobilon; Millipore), incubated overnight with a 1:5000 dilution of our MAP4 antibody (24), incubated with peroxidase-labeled secondary antibody for 1 h at room temperature, and visualized via enhanced chemiluminescence (DuPont).
For the tubulin heterodimer and microtubule fractions, the samples were homogenized in a microtubule stabilization buffer (3, 26) (1% Nonidet P-40, 50% glycerol, 5% Me2SO, 0.5 mm GTP, 10 mm Na2HPO4, 0.5 mm EGTA, 0.5 mm MgSO4, 25 mm Na4P2O7). Protease and phosphatase inhibitor cocktails were included in this buffer, and the lysate was centrifuged at 100,000 × g at 25 °C for 20 min. This supernatant was saved as the tubulin heterodimer fraction. The pellet was resuspended in 1% SDS buffer and boiled for 5 min to dissolve the pellet. This was saved as the microtubule fraction. The tubulin heterodimer and microtubule fractions were each mixed with an equal volume of SDS sample buffer and boiled for 3 min. For subsequent gel electrophoresis, to compare the amount of tubulin in the heterodimer versus microtubule fraction of a given sample, an equal proportion of the two fractions from the same sample, based on a BCA assay, was applied.
For immunoblots using our non-Ser(P)-924 MAP4 and non-Ser(P)-1056 MAP4 antibodies, employed here as before (7) to estimate the extent of MAP4 dephosphorylation at these two sites, the samples were homogenized in a 50 mm Tris buffer containing 0.5% Nonidet P-40, 150 mm NaCl, 50 mm NaF, and 1 mm Na3VO4; pH was adjusted to 7.2. A protease inhibitor mixture (catalog number P8340; Sigma), as well as phosphatase inhibitor cocktails 1 (catalog number P2850; Sigma) and 2 (catalog number P5726; Sigma) and 1 mm DTT were added to the buffer just before use. The lysate was centrifuged at 16,000 × g at 4 °C for 15 min to remove insoluble protein. SDS-PAGE was carried out after equal BCA-based protein loading for each sample using pre-cast 3–8% gradient Tris acetate gels (NuPAGE; Invitrogen). Separated proteins were transferred to polyvinylidene difluoride membranes (Immobilon; Millipore), which were blocked with 1× Animal-Free Blocker (catalog number SP-5030; Vector Laboratories) and incubated overnight at 4 °C with a 1:1000 dilution of our anti-non-Ser(P)-924 MAP4 or anti-non-Ser(P)-1056 MAP4 primary antibody (7). After incubating with biotinylated secondary antibody, specific protein bands were detected using horseradish peroxidase in conjunction with enhanced chemiluminescence.
Immunofluorescence Confocal Microscopy
The cells were fixed and stained as described previously (4). Briefly, cardiomyocytes plated on coverslips were permeabilized for 1 min in a 1% Triton X-100 buffer containing 2 mm EGTA, 0.1 mm EDTA, 1 mm MgSO4, and 100 mm MES, pH 6.75. They were then rinsed three times in the same buffer with no detergent and fixed in 3.7% formaldehyde in this same buffer for 30 min. After each coverslip was blocked with 10% donkey serum in 0.10 m glycine in PBS for 30 min at room temperature, the cells were incubated at 4 °C overnight in a 1:200 dilution of primary antibody in 2% normal donkey serum in PBS. After being washed three times with PBS, the cells were incubated at room temperature for 2 h in a 1:200 dilution of fluorescein-conjugated secondary antibody in 2% normal donkey serum in PBS. Optical sections (0.1 μm) were acquired using a Zeiss LSM510META confocal microscope equipped with a 30-milliwatt argon laser (458, 477, 488, and 514 nm), a 1-milliwatt helium-neon laser (543 nm), a 5-milliwatt helium-neon laser (633 nm), and a Plan-Apochromat 63×/1.40 differential interference contrast objective to obtain high resolution images. Adobe Photoshop® 7.0 software was used for superimposing the laser channels and for cropping and rotating images. To derive semiquantitative data from cardiomyocyte micrographs, the “Lasso” tool in Adobe Photoshop® 7.0 software was used to outline the cell boundary, and the mean pixel intensity within this boundary was then determined using the “Histogram” tool.
Pak1 Activity
To examine this, we took advantage of the fact that phosphorylation of Pak1 at Thr-423, a conserved threonine in the activation loop, induces and is essential for Pak1 activity (27, 28). It is also known that multiple hypertrophic agents and growth factors activate myocardial Pak1 as determined by phosphorylation of Pak1 at Thr-423 (18). Therefore, we examined both total and active Pak1 via myocardial immunoblots prepared with an antibody to total Pak1 (anti-Pak1, sc-881; Santa Cruz Biotechnology) and an antibody to active Pak1 (anti-Thr(P)-423 Pak1, 2601A; Cell Signaling) (18).
PP2A Activity
This was determined as reported elsewhere (29) using a PP2A immunoprecipitation assay system (catalog number 17-313; Upstate Biotech) that measures free phosphate with a malachite green dye. Total protein from isolated feline cardiomyocytes or from the RVs and LVs of control and PAB cats was extracted with lysis buffer (50 mm Tris-HCl, 1% Triton X-100, 150 mm NaCl, pH 7.4) containing a 1% protease inhibitor mixture (catalog number P8340; Sigma). To immunoprecipitate PP2A, lysates containing 200 μg of protein were incubated with 4 μg of anti-PP2A-C subunit antibody (catalog number 05-421; Upstate Biotech) and 40 μl of protein A-agarose slurry for 2 h at 4 °C with constant rocking. The immunoprecipitates were washed three times in Tris-buffered saline and once with Ser/Thr phosphatase assay buffer (50 mm Tris-HCl, pH 7.0, 100 μm CaCl2) and resuspended in 20 μl of Ser/Thr assay buffer. The reaction was initiated by the addition of 60 μl of phosphopeptide substrate (750 mm) (KRpTIRR). Following incubation for 10 min at 30 °C in a shaking incubator, the reaction mixture was centrifuged briefly, and the supernatant was transferred to a 96-well microtiter plate. Malachite green phosphate detection solution was added to each well, and after 15 min at room temperature, any free phosphate was quantified by measuring the absorbance of the mixture at 650 nm using a microplate reader; absorbance values of negative controls containing no enzyme were subtracted from the experimental values. All of the reactions for this study were performed under conditions that ensured that substrate was not limiting and dephosphorylation of substrate was linear.
PP1 Activity
Protein Ser/Thr phosphatase activity of PP1 was determined as reported elsewhere (30) using the PSP assay system (catalog number P0780S; New England Biolabs). Total protein from isolated feline cardiomyocytes or from the RVs and LVs of control and PAB cats was extracted with lysis buffer (50 mm Tris-HCl, 1% Triton X-100, 150 mm NaCl, pH 7.4); 10 μl of the protein fraction (1 μg protein/μl) was used for the phosphatase activity assay. The assays were performed in 50 μl of a buffer (50 mm Tris-HCl, 0.1 mm Na2EDTA, 5 mm DTT, 5 mm caffeine, 0 °C). The PP1 activity was measured with 32P-labeled myelin basic protein as a substrate in the presence of either 4 nm okadaic acid to block PP2A activity or 1 μm okadaic acid to block both PP1 and PP2A activity, as has been done before using these okadaic acid concentrations in tissue extracts (23). Thus, PP1 activity was calculated from okadaic acid-sensitive protein phosphatase activity by deducting phosphatase activity with 1 μm okadaic acid from activity with 4 nm okadaic acid. The reaction was initiated by adding 32P-labeled myelin basic protein as a substrate to a final concentration of 10 μm and incubated at 30 °C for 10 min. The reaction was terminated by the addition of 200 μl of 20% trichloroacetic acid, cooled on ice for 5 min, and centrifuged; 200 μl of the trichloroacetic acid supernatant was used to count the released 32P in the assay. Radioactivity was measured by scintillation counting. Dephosphorylation of 32P-myelin basic protein was measured within the linear range, and substrate remained at a saturating concentration during all of the reactions performed for this study.
Determining the Effects of Transgenic Cardiac Overexpression of PP2A and PP1
Ventricular cardiomyocytes were isolated as before (4) via enzymatic coronary artery perfusion from the hearts of 4-month-old male mice that were either wild-type or had cardiac-restricted overexpression of PP2Acα (22) or PP1cα (23). The cells were plated on laminin-coated culture dishes containing MEM (Invitrogen). Drug treatment or adenovirus-directed gene transfer was begun after the cells were cultured for 1 h to achieve substrate attachment. To test the specificity of any PP2A effect on polymerized tubulin amount and microtubule network density, 10 nm okadaic acid (Sigma) was added to the culture dishes and incubated for 8 h at 37 °C under 5% CO2 before the cells were used for experimentation. This duration and concentration of okadaic acid exposure is reported to inhibit PP2A but not PP1 in cultured cells (31), and it did not cause either spontaneous contractions or other signs of cytotoxicity in the treated cardiomyocytes. To test the specificity of any PP1 effect on polymerized tubulin amount and microtubule network density, the cardiomyocytes were infected at a multiplicity of infection of 1 for 24 h with AdI-1, an adenovirus encoding constitutively active PP1 I-1 (23), an endogenous inhibitor of PP1 (17). The cells were then rinsed and incubated for a further 24 h to permit transgene expression. This did not cause either spontaneous contractions or other signs of cytotoxicity in the transfected cardiomyocytes.
MARK2 Activity
MARK2 activity was determined using methods described previously (32). Total protein from the RVs and LVs of control and PAB cats was extracted with lysis buffer (50 mm Tris-HCl, 1% Triton X-100, 150 mm NaCl, pH 7.4) containing a protease inhibitor mixture (catalog number P8340; Sigma) as well as phosphatase inhibitor cocktails 1 (catalog number P2850; Sigma) and 2 (catalog number P5726; Sigma). To immunoprecipitate MARK2, lysates containing 400 μg of protein were incubated at 4 °C for 2 h on a shaking platform with 10 μg of anti-C-TAK1 antibody (catalog number 05-680; Millipore), which had been conjugated previously to 40 μl of protein G-Sepharose. The immunoprecipitates were washed two times in lysis buffer and once with assay buffer (50 mm Tris-HCl, 20 mm magnesium acetate, pH 7.4). Incorporation of 32P into the minimal kinase substrate AMARA peptide (AMARAASAAALARRR) (33) was determined by the addition of 50 μl of 20 mm magnesium acetate, 100 μm ATP, 100 μm [γ-32P]ATP (∼200 cpm/pm), and 200 μm AMARA peptide (catalog number 62596; AnaSpec). After incubation for 10 min at 30 °C in a shaking incubator, the reaction mixture was centrifuged briefly, and the 40-μl supernatants were transferred onto p81 Whatman membranes. These membranes were washed in 0.75% phosphoric acid, and the incorporated radioactivity was measured by scintillation counting. Because the MARK2 activity assay was done in immunoprecipitated samples from tissue lysates, it was not possible to express activity/mg of protein. Thus, we determined the relative activity by subtracting counts incorporated in assays of nonimmune immunoprecipitates from gross counts to determine net cpm, and the ratio of RV cpm/LV cpm was used as the index of MARK2 activity.
RESULTS
Characteristics of the Experimental Animals
The time-dependent percentage increases after PAB in RV systolic pressure and RV mass in adult cats of random sex weighing 2.4–3.6 kg are given in Table 1. In no case was there an increase in RV end diastolic pressure or any other evidence of congestive heart failure. In all cases for all groups, the mass of the normally loaded same-animal control LV was unchanged.
TABLE 1.
Percentage increase in RV pressure and mass after pulmonary artery banding
The values are the means ± S.E.; n = 5 at each time point.
| Time after PAB | Percentage increase in RV systolic pressure | Percentage increase in RV mass (RV/body weight) |
|---|---|---|
| mm Hg | g/kg | |
| 24 h | 82 ± 13 | 16 ± 9 |
| 48 h | 113 ± 26 | 38 ± 3 |
| 1 week | 143 ± 34 | 59 ± 16 |
| 2 weeks | 160 ± 20 | 76 ± 5 |
| 4 weeks | 174 ± 14 | 85 ± 12 |
| 10 weeks | 186 ± 22 | 69 ± 14 |
Pak1 Level and Activity in Normal and Hypertrophied Myocardium
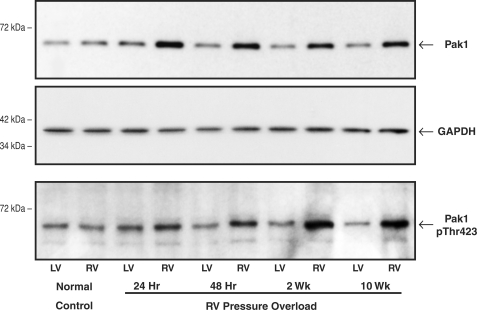
For this experiment, the quantity and activity of Pak1 were examined in the RV and LV of a control cat and PAB cats at specified times after RV pressure overloading. As shown in the top panel of Fig. 1, immunoblotting with a Pak1 antibody showed that there was a moderate increase to a relatively constant greater level in the quantity of RV Pak1 at 24 h to 10 weeks after RV pressure overloading. As shown for the same samples in the bottom panel of Fig. 1, there was an increase in RV Thr(P)-423 Pak1, a marker of Pak1 activity, after RV pressure overloading that was persistent and apparently progressive. These results were confirmed in two additional control cats and PAB cats at each time point. Thus, as shown by the values for RV pPak1/RV Pak1 given in the figure legend, comparison of the top and bottom panels of Fig. 1 indicates that the proportion of the total Pak1 that is phosphorylated and thus presumably active is increased when hypertrophy is well established at 2 weeks (21) as well as at 10 weeks after PAB. That is, RV Pak1 activation persists well after the 2 weeks of hypertrophic growth that follows pulmonary artery banding (21), which is a step increase in RV load.
FIGURE 1.
Myocardial total Pak1 and active Pak1 phosphorylated on Thr-423. These immunoblots were prepared from myocardial homogenates from the RV and LV of control cats and RV pressure-overloaded cats at the specified times after PAB. The blots were prepared using a polyclonal anti-Pak1 (α-Pak) antibody (sc-881; Santa Cruz Biotechnology), a polyclonal anti-Thr(P)-423 Pak1 antibody (catalog number 2601S; Cell Signaling), and, as a loading control, a monoclonal anti-GAPDH antibody (clone 6C5; Upstate Biotech). For three experiments such as that shown here, the densitometric ratio of RV/LV Pak1 was 1.32 ± 0.02 for control, 1.72 ± 0.03 for 24-h PAB, 1.71 ± 0.02 for 48-h PAB, 1.70 ± 0.02 for 2-week PAB, and 1.77 ± 0.03 for 10-week PAB. For the ratio of RV/LV p-Pak1, these values were 1.00 ± 0.05 for control, 1.17 ± 0.09 for 24-h PAB, 1.83 ± 0.13 for 48-h PAB, 2.45 ± 0.25 for 2-week PAB, and 2.96 ± 0.20 for 10-week PAB. For the ratio of RV pPak1/RV Pak1, these values were 1.20 ± 0.31 for control, 0.81 ± 0.34 for 24-h PAB, 1.05 ± 0.30 for 48-h PAB, 2.05 ± 0.37 for 2-week PAB, and 1.94 ± 0.39 for 10-week PAB.
Pak1 Effects on the Cardiac Microtubule Network
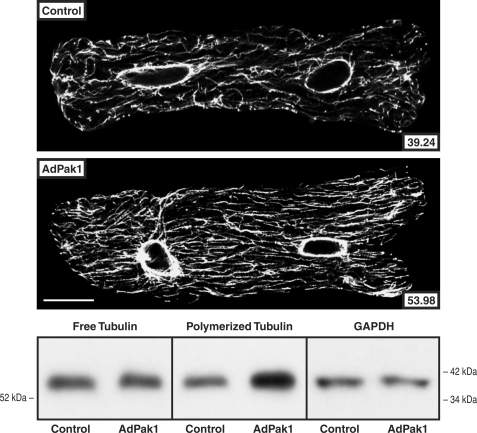
To determine whether increased Pak1 activity has an effect on the extent of cardiomyocyte microtubule polymerization independent of other biochemical or mechanical input, normal adult feline isolated cardiomyocytes were transfected with AdPak1, an adenovirus encoding constitutively active Pak1 (25), and studied 2 days later. Fig. 2 shows that in the AdPak1-infected cells there was an increased proportion of tubulin in the microtubule fraction in immunoblots of cellular homogenates and increased density of the cardiomyocyte microtubule network in confocal micrographs. The immunoblots in supplemental Fig. S1 show that these effects are Pak1-specific.
FIGURE 2.
Cardiomyocyte free and polymerized tubulin after AdPak1 infection. These confocal micrographs and immunoblots were prepared from cultured quiescent adult feline cardiomyocytes infected 48 h earlier with AdPak1, an adenovirus encoding constitutively active Pak1, at a multiplicity of infection of ∼1. Control cells were infected at the same multiplicity of infection with AdβGal, an adenovirus encoding bacterial β-galactosidase, and additional controls for these adenovirus infection data are provided in supplemental Fig. S1. The greater microtubule network density and concentration of polymerized tubulin in the AdPak1-infected cells is apparent. A monoclonal anti-β-tubulin antibody (clone DM-1B; Abcam) was used for the micrographs and immunoblots, and for the immunoblot loading control, a monoclonal anti-GAPDH antibody (clone 6C5; Upstate Biotech) was used for the same samples as used for free tubulin. The number inset into each micrograph gives the mean pixel intensity (white level) of the microtubule network within the boundary of that cell; each micrograph is a single 0.1-μm confocal section taken at the level of the nuclei. For this and two other immunoblots, the densitometric ratio of AdPak1/control signals was 0.96 ± 0.05 for free tubulin and 2.19 ± 0.13 for polymerized tubulin. Scale bar, 20 μm.
Pak1 Effects on PP2A and PP1 Activity
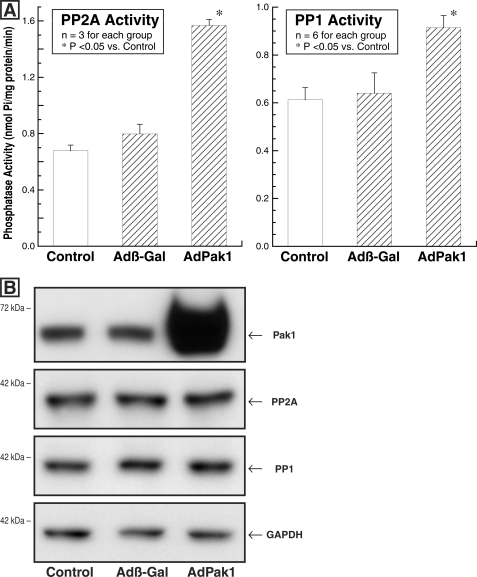
To ascertain whether our proposal of a Pak1-based cascade leading to activation of PP2A and PP1 during cardiac hypertrophy is reasonable, normal adult feline isolated cardiomyocytes were transfected with an adenovirus encoding constitutively active Pak1 (25) and studied 3 days later. Parallel control cultures were either uninfected or infected at the same multiplicity of infection with Adβ-gal. Fig. 3A shows that the activity of each phosphatase was increased in the cells infected with AdPak1, whereas the immunoblots in Fig. 3B show that the quantity of PP2A and PP1 was invariant in these three groups of cells. Of interest, the absolute phosphatase activity shown here for PP2A and PP1 in normal feline, predominantly LV cardiomyocytes is quite similar to that reported below in normal feline RV myocardium.
FIGURE 3.
Cardiomyocyte PP2A and PP1 activity and quantity after AdPak1 infection. The feline cardiomyocytes used for these assays were either uninfected (control) or infected with AdPak1 or Adβ-gal 72 h earlier. A, PP2A activity was measured using an immunoprecipitation assay kit (catalog number 17-313; Upstate Biotech) as described under “Experimental Procedures.” PP1 activity was determined using the PSP assay system (catalog number P0780S; New England Biolabs), as is also described under “Experimental Procedures.” B, these immunoblots were prepared from the same cardiomyocyte lysates used for the PP2A and PP1 activity assays. The blots were prepared using a polyclonal anti-Pak1 (α-Pak) antibody (sc-881; Santa Cruz Biotechnology), a monoclonal antibody to the catalytic subunit of PP2A (clone 1D6; Upstate Biotech), a monoclonal antibody to PP1 (clone E-9; Santa Cruz Biotechnology), and, as the loading control, a monoclonal antibody to GAPDH (clone 6C5; Upstate Biotech). *, p < 0.05 by one-way ANOVA with Bonferroni post hoc analysis.
PP2A and PP1 Level and Activity in Normal and Hypertrophied Myocardium
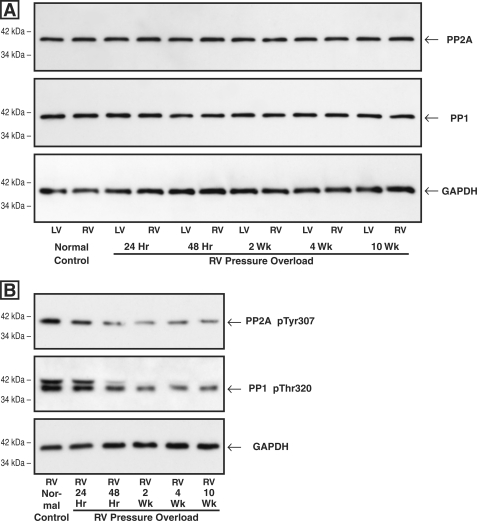
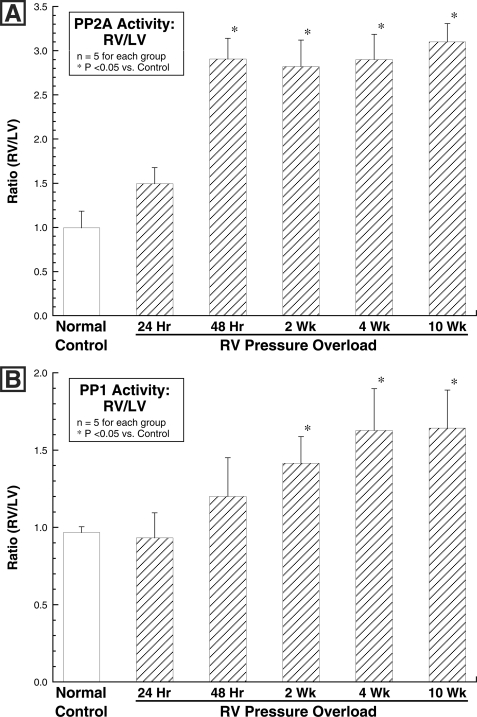
As shown in Fig. 4A, there was no hypertrophy-related change in the level of either PP2A or PP1 in the hypertrophied RV as compared with either the same-animal normally loaded LV or the normal control RV or LV at any of the times after RV pressure overloading that were examined. However, as shown in Fig. 4B, there was a striking decrease in the inactive forms of both PP2A and PP1 in the pressure-overloaded RVs at times greater than 48 h after PAB. That is, despite an unchanged quantity of both PP2A and PP1, there are decreases in both the inactive Tyr-307-phosphorylated form of PP2A (34, 35) and the inactive Thr-320-phosphorylated form of PP1 (36, 37). Thus, as would be expected, Fig. 5 shows that in the PAB model of pathological RV hypertrophy, there was a persistent increase in the activity of each of the two major cardiac phosphatases, PP2A and PP1, when measured as the ratio of RV/LV activity in the same myocardial samples as those used to prepare the immunoblots shown in the previous figure.
FIGURE 4.
Myocardial levels of total and inactive PP2A and PP1 after RV pressure overloading. Myocardial homogenates used for all of these blots were prepared from the same-animal RVs and LVs at the indicated times after hypertrophy induction via PAB. A, levels of total PP2A and PP1. The antibodies used for these blots were a monoclonal antibody to the catalytic subunit of PP2A (clone 1D6; Upstate Biotech), a monoclonal antibody to PP1 (clone E-9; Santa Cruz Biotechnology), and, as the loading control, a monoclonal antibody to GAPDH (clone 6C5; Upstate Biotech). The densitometric ratio of RV/LV PP2A and PP1 signals in this and two other sets of immunoblots did not differ more than 10% from unity at any time point. B, levels of inactive PP2A and PP1. The antibodies used for these blots were a phosphopeptide antibody to inactive PP2A Tyr(P)-307 (clone E155; Epitomics), a phosphopeptide antibody to inactive PP1 Thr(P)-320 (clone EP1512Y; Epitomics), and, as the loading control, a monoclonal antibody to GAPDH (clone 6C5; Upstate Biotech). In this and one other PP2A Tyr(P)-307 blot, the average ratio of pressure-overloaded RV/control RV was 0.77 for the 24-h RV, 0.47 for the 48-h RV, 0.36 for the 2-week RV, 0.50 for the 4-week RV, and 0.39 for the 10-week RV; in this and one other PP1 Thr(P)-320 blot, the average ratio of pressure-overloaded RV/control RV was 0.81 for the 24-h RV, 0.60 for the 48-h RV, 0.46 for the 2-week RV, 0.43 for the 4-week RV, and 0.45 for the 10-week RV.
FIGURE 5.
Myocardial activity of PP2A and PP1 after RV pressure overloading. Myocardial homogenates for these assays were prepared from the same animals as those used to prepare the immunoblots in Fig. 4. A, PP2A activity was measured using an immunoprecipitation assay kit (catalog number 17-313; Upstate Biotech) as described under “Experimental Procedures.” B, PP1 activity was determined using the PSP assay system (catalog number P0780S; New England Biolabs), as is also described under “Experimental Procedures.” *, p < 0.05 by one-way ANOVA with Bonferroni post hoc analysis.
In terms of absolute RV phosphatase activity (nmol phosphate/mg protein/min), the values for PP2A ranged from 0.57 ± 0.16 for the normal control RVs to 1.80 ± 0.03 for the 10 weeks PAB RVs (a 216% increase), and for PP1 they ranged from 0.59 ± 0.05 for the normal control RVs to 0.91 ± 0.07 for the 10 weeks PAB RVs (a 54% increase); absolute same-animal LV PP2A and PP1 activities were statistically invariant during RV hypertrophy. Thus, the percentage increase in absolute RV phosphatase activity from the respective control was 4-fold greater for PP2A than it was for PP1. Importantly, as was the case for Pak1 activation, RV activation of PP2A and PP1 does not decrease after the period of active RV hypertrophic growth is complete. It is also important to note that increased phosphatase activity is a characteristic of pathological rather than physiological cardiac hypertrophy, because for our atrial septal defect model of physiological hypertrophy in which MAP4 dephosphorylation is not seen (7), the ratio of RV/LV phosphatase activity at 4 weeks after atrial septostomy in five cats was 1.11 ± 0.07 for PP2A and 1.09 ± 0.06 for PP1 (means ± S.E., p was not significant versus control by unpaired Student's t test in each case).
PP2A and PP1 Effects on the Cardiac Microtubule Network Density
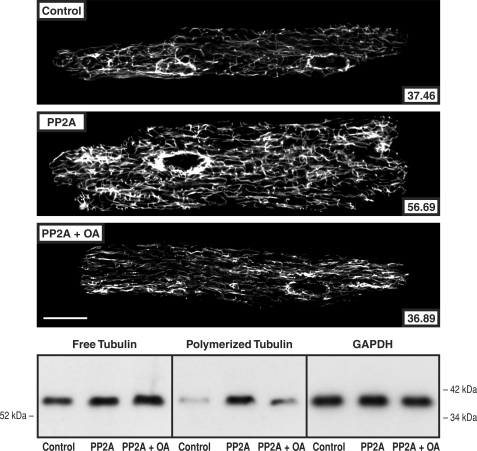
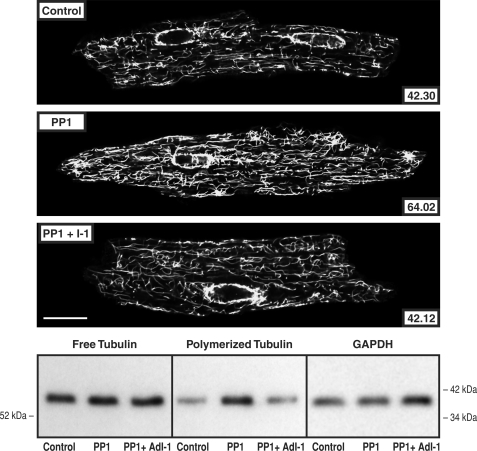
To determine whether increased PP2A or PP1 activity has an effect on the extent of cardiomyocyte microtubule polymerization independent of other biochemical or mechanical input, cardiomyocytes isolated from mice with cardiac-restricted overexpression of PP2Acα (22) or PP1cα (23) were studied. Fig. 6 shows that in cardiomyocytes isolated from the PP2Acα-overexpressing mouse, there was an increased proportion of tubulin in the microtubule fraction in immunoblots of cellular homogenates and increased density of the cardiomyocyte microtubule network in confocal micrographs. In addition, these changes were reversed by 8 h of exposure of the cardiomyocytes to 10 nm okadaic acid. This fact, together with data in supplemental Fig. S2 validating the relative selectivity of 10 nm okadaic acid for PP2A as opposed to PP1 effects on cardiomyocyte microtubules, suggests that these microtubule network changes are related specifically to increased PP2A activity. Fig. 7 shows similar data for cardiomyocytes isolated from the PP1cα-overexpressing mouse. Here too there was an increased proportion of tubulin in the microtubule fraction in immunoblots of cellular homogenates and increased density of the cardiomyocyte microtubule network in confocal micrographs. These changes were reversed in cardiomyocytes transfected with AdI-1, suggesting that these microtubule network changes are related specifically to increased PP1 activity.
FIGURE 6.
Cardiomyocyte free and polymerized tubulin in mice overexpressing PP2A. Microtubule network density and free and polymerized β-tubulin in cardiomyocytes isolated from control mice, from mice having cardiac-restricted overexpression of PP2A, and the same cells treated for 8 h with 10 nm okadaic acid. The greater microtubule network density and concentration of polymerized tubulin in the PP2A mice are returned to control by okadaic acid. The antibody used for the confocal micrographs and tubulin immunoblots was a monoclonal anti-β-tubulin antibody (clone DM-1B; Abcam). For the immunoblot loading control, a monoclonal anti-GAPDH antibody (clone 6C5; Upstate Biotech) was used in the same samples as those used for free tubulin. For the confocal micrographs, the mean pixel intensity (white level) within the boundary of each cardiomyocyte is given numerically; each micrograph is a single 0.1-μm confocal section taken at the level of the nuclei. For this and two other immunoblots, the densitometric ratio of PP2A/control signals was 1.24 ± 0.03 for free tubulin and 4.91 ± 0.56 for polymerized tubulin; for PP2A + OA/control, it was 1.39 ± 0.02 for free tubulin and 2.19 ± 0.38 for polymerized tubulin. Scale bar, 20 μm.
FIGURE 7.
Cardiomyocyte free and polymerized tubulin in mice overexpressing PP1. Microtubule network density and free and polymerized β-tubulin in cardiomyocytes isolated from control mice, from mice having cardiac-restricted overexpression of PP1, and the same isolated cells infected for 48 h with AdI-1, an adenovirus encoding PP1 I-1, the endogenous inhibitor of PP1. The greater microtubule network density and concentration of polymerized tubulin in the PP2A mice is returned to control by PP1 I-1 expression. The antibody used for the confocal micrographs and tubulin immunoblots was a monoclonal anti-β-tubulin antibody (clone DM-1B; Abcam). For the immunoblot loading control, a monoclonal anti-GAPDH antibody (clone 6C5; Upstate Biotech) was used in the same samples as those used for free tubulin. For the confocal micrographs, the mean pixel intensity (white level) within the boundary of each cardiomyocyte is given numerically; each micrograph is a single 0.1-μm confocal section taken at the level of the nuclei. For this and two other immunoblots, the densitometric ratio of PP1/control signals was 1.08 ± 0.05 for free tubulin and 2.04 ± 0.09 for polymerized tubulin; for PP1 + I-1/control, it was 1.08 ± 0.03 for free tubulin and 0.92 ± 0.05 for polymerized tubulin. Scale bar, 20 μm.
PP2A and PP1 Effects on the Cardiac Microtubule Network Stability
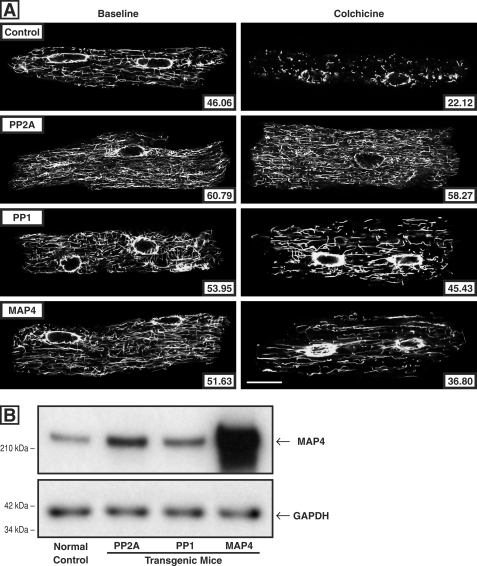
Because increased microtubule stability is a prominent feature of pressure-overloaded myocardium (38) such as that studied here and because we have attributed this to increased binding of dephosphorylated MAP4 to microtubules, the potential role of increased phosphatase activity in this cytoskeletal alteration was assessed in terms of measures of microtubule drug resistance and microtubule age. For the measure of microtubule drug resistance, we took advantage of the fact that colchicine binding to microtubule-incorporated β-tubulin prevents the αβ-tubulin heterodimers that disassemble from dynamic microtubules from reassembling, such that microtubule network density after colchicine exposure is a function of microtubule stability. Because we had determined that parenteral colchicine at a dosage of 0.50 mg/kg intraperitoneally given 4 h before sacrifice causes essentially complete microtubule depolymerization in the normal murine heart in vivo (4), we repeated this protocol in control mice and in mice having cardiac-restricted overexpression of PP2Acα (22), PP1cα (23), or MAP4 (24). The confocal micrographs in Fig. 8A show that in cardiomyocytes isolated from these four groups of mice, base-line microtubule network density is greater than control in all three experimental groups and that this is also true after parenteral colchicine administration; note that the post-colchicine microtubule persistence is especially prominent in cardiomyocytes from the PP2Acα-overexpressing mice. Note also that the increased microtubule network density and stability in the PP2Acα- and PP1cα-overexpressing mice do not appear to be simply the result of greater MAP4 quantity. As shown in the immunoblot in Fig. 8B, in these mice there is a 2–3-fold increase in total MAP4, presumably caused by dephosphorylation-driven MAP4 binding to and stabilization of microtubules. However, the base-line and post-colchicine micrographic microtubule network changes in cardiomyocytes from these mice are at least as striking as those in cardiomyocytes from MAP4-overexpressing mice having an ∼20-fold increase in MAP4 expression. Finally, the immunoblots in supplemental Fig. S3 confirm the findings regarding microtubule colchicine resistance shown in Fig. 8 in terms of the levels of free and polymerized tubulin in the same four groups of identically treated mice.
FIGURE 8.
Cardiomyocyte microtubule network density and stability. A, confocal micrographs of cardiomyocytes isolated from the hearts of control and colchicine-treated mice. For these micrographs, prepared using a monoclonal anti-β-tubulin antibody (clone DM-1B; Abcam), the left column shows cardiomyocytes isolated from vehicle-treated mice, and the right column shows cardiomyocytes isolated from colchicine-treated mice (0.50 mg/kg given intraperitoneally 4 h before sacrifice). The mice were either normal controls or had cardiac-restricted overexpression of PP2Acα, PP1cα, or MAP4. The number inset in each micrograph gives the mean pixel intensity (white level) within the boundary of each cardiomyocyte. Scale bar, 20 μm. B, level of cardiac MAP4 protein. The MAP4 immunoblot, prepared using our anti-MAP4 antibody (24), and its loading control, prepared using an anti-GAPDH antibody (clone 6C5; Upstate Biotech), show the relative level of MAP4 protein in the myocardium from WT control mice and mice with cardiac-restricted overexpression of PP2A, PP1, or MAP4. The mean densitometric ratios for three measurements were: PP2A/control, 3.26 ± 0.05; PP1/control, 2.32 ± 0.02; and MAP4/control, 21.10 ± 0.78.
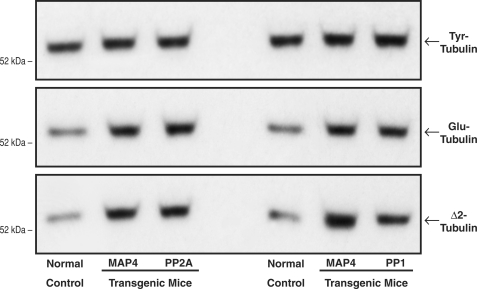
Turning next in Fig. 9 to a measure of intrinsic microtubule age in vivo, we took advantage of the fact that after αβ-tubulin heterodimer assembly into microtubules, the α-tubulin moiety undergoes two sequential time-dependent post-translational changes: reversible carboxyl-terminal detyrosination (Tyr-tubulin ↔ Glu-tubulin) and then irreversible deglutamination (Glu-tubulin → Δ2-tubulin), such that Glu-tubulin and Δ2-tubulin are intrinsic markers for long-lived, stable microtubules (38, 39). The immunoblots in Fig. 9, prepared using our peptide antibodies for Tyr-, Glu-, and Δ2-tubulin (38), show that the apparent average age of the microtubules is greater than control in all three experimental groups. Thus, the net effect on microtubule properties is apparently similar when the native MAP4 pool exists in the persistently high phosphatase environment of the PP2Acα- or PP1cα-overexpressing heart and when a greatly augmented MAP4 pool exists in the likely normal phosphatase environment of the MAP4-overexpressing heart, wherein presumably there are increases in both phospho- and dephospho-MAP4.
FIGURE 9.
Intrinsic microtubule stability. These immunoblots were prepared, using our peptide antibodies to Tyr-tubulin, Glu-tubulin, and Δ2-tubulin (38), from myocardial homogenates from the same groups of mice used for Fig. 8. The increases relative to control in the post-translationally modified Glu and Δ2 α-tubulin isoforms reflect greater microtubule stability in vivo, because these modifications occur only in the microtubule-assembled αβ-tubulin heterodimers (38, 39). For this and two other sets of immunoblots, for the left set of blots, the densitometric ratio of MAP4/control signals was 1.11 ± 0.06 for Tyr-tubulin, 1.66 ± 0.05 for Glu-tubulin, and 2.64 ± 0.12 for Δ2-tubulin; for PP2A/control, it was 1.13 ± 0.08 for Tyr-tubulin, 1.77 ± 0.06 for Glu-tubulin, and 2.55 ± 0.13 for Δ2-tubulin. For the right set of blots the densitometric ratio of MAP4/control signals was 1.06 ± 0.03 for Tyr-tubulin, 1.70 ± 0.31 for Glu-tubulin, and 2.70 ± 0.51 for Δ2-tubulin; for PP1/control, it was 1.16 ± 0.14 for Tyr-tubulin, 1.58 ± 0.03 for Glu-tubulin, and 2.55 ± 0.12 for Δ2-tubulin.
Activity of PP2A and PP1 at the Ser-924 and Ser-1056 Sites of MAP4
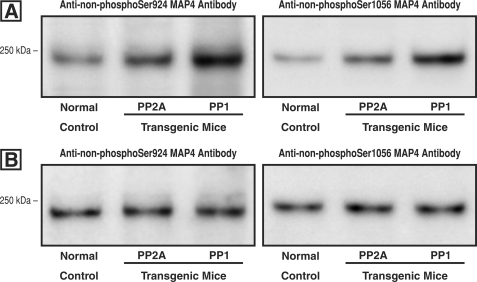
An important mechanistic question is whether increased activity of PP2A and/or PP1 in otherwise normal hearts reproduces the MAP4 dephosphorylation at these two sites that we see in the biologically complex setting of cardiac hypertrophy (7). We addressed this question using our antibodies for non-Ser(P)-924 MAP4 and non-Ser(P)-1056 MAP4 whose specificity was validated in our previous study (Fig. 4 in Ref. 7). Fig. 10A shows that dephosphorylation at these two MAP4 sites does in fact occur in the hearts of both the PP2Acα- and PP1cα-overexpressing transgenic mice. Further, because the activities of PP2A and PP1 are differentially regulated and because MAP4 dephosphorylation at Ser-924 and to a lesser extent at Ser-1056 increases MAP4-microtubule binding during pressure overload cardiac hypertrophy (7), it was of interest to know whether there is a different sensitivity of either MAP4 site to the dephosphorylating activity of these two phosphatases. Although Fig. 10A would suggest initially that such is the case, Fig. 10B shows that when protein loading is adjusted to account for the differing activities of PP2A and PP1 relative to control in transgenic mice overexpressing the respective phosphatases (22, 23), cardiac MAP4 dephosphorylation activity at Ser-924 and Ser-1056 is actually equivalent in the control and each of the transgenic mice. Thus, whereas the lesser myocardial phosphatase activity of PP2Acα-overexpressing as opposed to PP1cα-overexpressing transgenic mice has some bearing on the data in Figs. 6–9, the reason that PP2A seems to be more important than PP1 in the setting of myocardial hypertrophy is simply that, as shown in Fig. 5, the level of RV PP2A phosphatase activity is much greater than the level of PP1 activity.
FIGURE 10.
Site-specific MAP4 dephosphorylation in mice overexpressing PP2A and PP1. A, using our antibodies (7) to MAP4 that is dephosphorylated at either Ser-924 or Ser-1056, these immunoblots were prepared from homogenates of the hearts of normal mice or mice with cardiac-restricted overexpression of either PP2A or PP1. These are the same transgenic mice that were used in Figs. 6 and 7, respectively. Equal protein loading as verified by Coomassie Blue staining was employed for each lane. B, cardiac PP2A activity is increased 1.7-fold over control in the PP2A-overexpressing mouse (22), and PP1 activity is increased 2.8-fold in the PP1-overexpressing mouse (23). Based on these data, for these two blots protein loading for PP2A and PP1 was adjusted such that the activity of each phosphatase relative to the same-blot control was the same.
MARK2 Level and Activity in Normal and Hypertrophied Myocardium
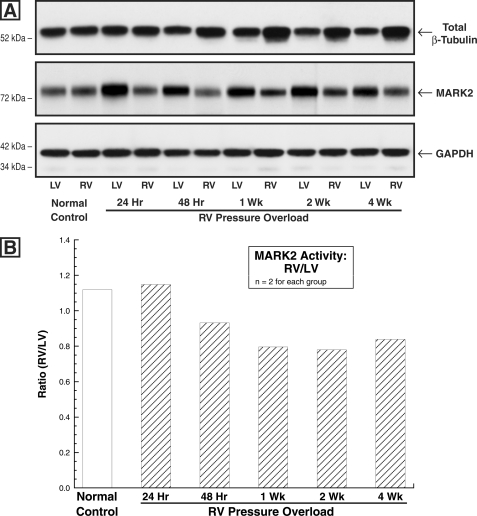
Turning finally to the kinase side of the regulation of MAP4 phosphorylation, this was examined to assess the potential contribution of the MARKs, a subset of the family of AMP-activated protein kinases (40), to increased affinity of MAP4 for microtubules in hypertrophied myocardium. The four MARKs, which share a highly conserved amino-terminal catalytic domain, were discovered as novel Ser/Thr kinases that phosphorylate the KXGS repeats within the microtubule-binding domain of the MAPs, including MAP4, thereby regulating MAP-microtubule affinity (8, 9, 41). Of these, MARK2 expression is especially prominent in the heart of human adults (11). Fig. 11A shows that the level of MARK2 is modestly decreased during the development of pressure overload hypertrophy, and Fig. 11B shows that the same is true for MARK2 activity. Indeed, the percentage of reduction in each, which at times is greater than 1 week after PAB averaged 33% for quantity and 20% for activity, is fairly similar, such that MARK2 specific activity appears to be little if at all affected. Further, as was the case for phosphatase activity, in two cats having atrial septal defects for 4 weeks there was no significant change in RV MARK2 quantity or activity (RV/LV quantity = 1.34; RV/LV activity = 1.11). Most notably, however, it would appear that based on the rather modest decrease in hypertrophy-related MARK2 activity, a reduction in MARK2-based MAP4 phosphorylation is unlikely to play a major role in the pressure overload hypertrophy-related MAP4 dephosphorylation that we have described (7).
FIGURE 11.
Myocardial MARK2 quantity and activity. A, MARK2 and β-tubulin levels in control and PAB hearts. These immunoblots were prepared from myocardial homogenates from the matched RVs and LVs of cats at the indicated times after PAB using a monoclonal anti-β-tubulin antibody (clone DM-1B; Abcam), an anti-C-TAK1 antibody (catalog number 05-680; Millipore) that has equal affinity for MARK2 and MARK3 (40), and, as the loading control, a monoclonal anti-GAPDH antibody (clone 6C5; Upstate Biotech). They show that in the pressure-overloaded RVs wherein there is a persistent increase in total β-tubulin, there is a modest reduction in the level of MARK2. Because MARK2 is highly expressed in the heart (11, 41), whereas MARK3 is much more highly expressed in brain and pancreas (41), it is assumed here that the predominant protein seen in this immunoblot is MARK2. For two experiments such as that shown here, the average densitometric ratio of RV/LV total β-tubulin was 1.06 for control, 1.04 for 24-h PAB, 1.39 for 48-h PAB, 1.44 for 1-week PAB, 1.55 for 2-week PAB, and 1.91 for 4-week PAB. For MARK2, these values were 1.11 for control, 0.57 for 24-h PAB, 0.58 for 48-h PAB, 0.65 for 1-week PAB, 0.62 for 2-week PAB, and 0.74 for 4-week PAB. B, MARK2 activity in control and PAB hearts. The ratio of RV/LV activity was measured in hearts from PAB cats at the indicated times after surgery via an immunoprecipitation assay as described under “Experimental Procedures.”
DISCUSSION
In our previous report (7), we showed that site-specific MAP4 dephosphorylation occurs in pathological myocardial hypertrophy when a dense, stabilized microtubule array forms. Of special interest, there was striking dephosphorylation at feline MAP4 Ser-924 within the first of the four KXGS repeats of the microtubule-binding domain, and a dephosphomimetic Ser-924 → Ala mutation reproduced in normal cardiomyocytes the microtubule phenotype ordinarily seen in pathological, high wall stress hypertrophy, whereas a phosphomimetic Ser-924 → Asp mutation caused microtubule depolymerization. As shown in supplemental Fig. S4, there is a very high degree of homology in the region of this first KXGS repeat among full-length human Tau and MAP4 from multiple species. Because of this homology and because microtubule destabilizing hyperphosphorylation of the human Tau Ser-262 in Alzheimer disease that corresponds to feline MAP4 Ser-924 is regulated both by increased activity of the relevant kinase, MARK (11), and by decreased phosphatase activity (12), especially of the PP2A that is primarily responsible for human Tau Ser-262 dephosphorylation (13, 14), we framed this research within the question of whether a directionally opposite kinase/phosphatase dysregulation from that seen in Alzheimer disease could be responsible for the site-specific MAP4 dephosphorylation that appears to be responsible for microtubule stabilization in pathological cardiac hypertrophy.
We elected to begin this research by examining phosphatase regulation. As a first step, we went upstream to Pak1, a reasonable candidate for hypertrophy-dependent control of phosphatase activity. That is, there was already evidence that activation of this multifunctional stress-related kinase is a very early signaling response to hemodynamic cardiac overloading (18), and Pak1 activation would be expected to activate PP2A directly (15) and then could activate PP1 indirectly via a PP2A-mediated decrease in the activity (10, 16) of the endogenous PP1 inhibitor I-1 (17). As shown in Fig. 1, Pak1 quantity and especially activity are in fact significantly and persistently increased after hypertrophy induction. Further, Figs. 2 and 3 provide an initial indication that the events downstream from Pak1 activation may well play a role in microtubule network densification. That is, in Fig. 2 a shift of tubulin into the microtubule fraction is apparent both in the micrographs and in the immunoblots after adenovirus-induced Pak1 expression in normal cardiomyocytes, and Fig. 3 shows Pak1 linked to increased activity of PP2A and PP1 in AdPak1-infected cells.
Going downstream one step, we next examined the quantity and activity of PP2A and PP1 in hypertrophied myocardium. As seen in Fig. 4A, there is no change in the quantity of either phosphatase after hypertrophy induction, but Fig. 4B shows that there is a decrease in the inactive form of both phosphatases, i.e. one would expect the activity of both PP2A and PP1 to be increased. Fig. 5 shows that such is the case. There is a striking and persistent increase in PP2A activity in hypertrophied RV myocardium compared with that in the same-animal normally loaded LV, and this is true to a lesser extent for PP1. Although these data certainly do not establish a direct cause-and-effect relationship between Pak1 and phosphatase activities in this setting, they are very suggestive, as reviewed elsewhere (15), of such a linkage in the myocardial context.
In experiments analogous to that in Fig. 2, we then looked for evidence that increased activity of these phosphatases could be a primary etiology for the downstream events leading to microtubule network densification, as well as evidence for the specificity of any such effect. For PP2A, Fig. 6 shows that in cardiomyocytes isolated from the hearts of mice having cardiac-restricted transgenic overexpression of PP2Acα (22), a shift of tubulin into the microtubule fraction is apparent both in the micrographs and in the immunoblots. Further, the specificity of this effect is indicated by its inhibition by a PP2A-selective concentration of okadaic acid (31). Similarly for PP1, Fig. 7 shows that in cardiomyocytes isolated from the hearts of mice having cardiac-restricted transgenic overexpression of PP1cα (23), a shift of tubulin into the microtubule fraction is apparent both in the micrographs and in the immunoblots. Further, the inhibition of this effect by adenovirus-induced overexpression of PP1 I-1 in these cells indicates that it is a PP1-specific effect. Of note, in both the PP2A- and PP1-overexpressing mice, it is likely that the increase in cardiomyocyte microtubules is related to phosphatase-induced dephosphorylation and therefore microtubule binding of MAP4, because the immunoblots in supplemental Fig. S5 show that under the conditions of Figs. 6 and 7, changes in tubulin and MAP4 quantity track together in the microtubule fraction of myocardial homogenates.
Because a goal here was to determine whether increased phosphatase activity reproduces the microtubule network features seen in pathological cardiac hypertrophy, and this includes not only increased network density but also network stabilization (38), we next examined this variable in both PP2Acα- and PP1cα-overexpressing mice. Because as shown in the immunoblot in Fig. 8B there is a modest increase in MAP4 quantity in the myocardium of both phosphatase-overexpressing strains of transgenic mice, we also examined microtubule stability in hearts from mice having cardiac-restricted transgenic overexpression of MAP4 (24). Fig. 8A shows that at base line in all three transgenic mice, there is an increase over control in microtubule network density, just as we see in hypertrophy. However, microtubule network density among these three strains following the parenteral administration of colchicine is quite different. There is extensive microtubule depolymerization in the control cardiomyocyte, and this is true to only a slightly lesser extent in the MAP4 cardiomyocyte, likely reflecting the fact that despite the marked cardiac overexpression of MAP4 in the latter mouse, there has been no alteration that would be expected to increase the MAP4-microtubule affinity that causes microtubule stabilization. In striking contrast, a lesser degree of microtubule depolymerization is seen in the PP1 cardiomyocyte and almost none in the PP2A cardiomyocyte. This is likely because microtubule depolymerization after colchicine exposure is caused by the colchicine-bound β-subunit of the αβ-tubulin-free heterodimer inhibiting the reassembly of tubulin heterodimers into the ordinarily dynamic interphase microtubules rather than colchicine directly causing depolymerization of preexisting microtubules (42, 43). Thus, this is the expected result if there is a phosphatase-induced increase in MAP4-microtubule affinity and thus microtubule stability.
This same result is borne out at the tissue level in supplemental Fig. S3. The set of blots in supplemental Fig. S3A shows that in myocardial immunoblots from the same four groups of mice as those used to prepare the data in Fig. 8, both MAP4 overexpression and PP2Acα overexpression cause at base line a shift of tubulin from the free heterodimer fraction to the polymerized microtubule fraction and an increase in total tubulin. For total tubulin, as shown before for the MAP4 mouse (Fig. 7 in Ref. 24), and as elaborated more generally in our previous study (7), this is likely due to feedback stimulation of tubulin synthesis in a setting wherein free tubulin heterodimers are effectively being removed from their ordinarily highly dynamic heterodimer-microtubule interchange by incorporation into heavily MAP4-decorated, stabilized microtubules. As in Fig. 8, after parenteral colchicine there is a relatively lesser shift of tubulin from the free to the polymerized fraction in the MAP4 mice and an even smaller relative shift for the PP2Acα mice. The set of blots in supplemental Fig. S3B shows similar findings at base line for the PP1cα mice, but as in Fig. 8 the post-colchicine microtubule stabilization effect is somewhat less striking than in the PP2Acα mice.
Because microtubule stability as assayed by resistance to colchicine-induced depolymerization may not be controlled by a set of factors identical to those that control long term intrinsic microtubule stability in vivo, this intrinsic stability was assayed in the same groups of mice as those used for Figs. 8 and supplemental Fig. S3. This assay depends on the fact that the sequential post-translational removal of two carboxyl-terminal amino acids from α-tubulin occurs only in tubulin heterodimers that are assembled into microtubules, such that the quantity of these two forms of α-tubulin serves as a “clock” indicative of microtubule age (38). The immunoblots for native and post-translationally modified α-tubulin, shown in Fig. 9, provide evidence that stabilized microtubules containing the two post-translationally modified forms of α-tubulin are increased relative to control in all three strains of transgenic mice.
Turning finally to an examination of kinase as opposed to phosphatase regulation of microtubule stabilization in cardiac hypertrophy, we characterized MARK2, the member of the MARK family of kinases that is abundant in the heart (11). The data shown in Fig. 11 suggest that although directionally appropriate, the modest changes in MARK2 quantity and activity shown here are probably unlikely to have a major role in this phenomenon. That is, given that MARK2 has as its substrate serine residues within the KXGS repeats of the MAP microtubule-binding domain (8, 11), the changes shown here would be expected to contribute to site-specific MAP4 dephosphorylation, especially at the highly relevant feline Ser-924. However, the proportional change in total MARK2 activity is relatively much less than that for the phosphatases.
Our previous study (7) showed that MAP4-microtubule affinity, as well as microtubule network stability and density, are each markedly increased by MAP4 dephosphorylation at Ser-924. These three increases make up the changes in microtubule properties that are characteristic of pathological pressure overload cardiac hypertrophy, and that study also showed that there is a persistent and virtually complete dephosphorylation of myocardial MAP4 Ser-924 in a feline model of this disease. Our present study provides a mechanism for these microtubule network changes in terms of what appears to be a remarkably persistent Pak1-driven phosphatase activation, and especially that of PP2A, because although the specific activities of PP2A and PP1 at the MAP4 Ser-924 site appear in Fig. 10B to be equivalent, the increase in RV/LV phosphatase activity shown in Fig. 5 is 3-fold greater for PP2A than it is for PP1 during RV hypertrophy, and the increase in absolute RV phosphatase activity was 4-fold greater for PP2A than it was for PP1. Further, because it is well known that continuous activation of the sympathetic nervous system is a hallmark of pathological cardiac hypertrophy and failure (44), because chronic β-adrenergic stimulation increases cardiac PP2A and PP1 activity (45), because there is evidence for β-adrenergic activation of the upstream kinase Pak1 (18), and because Pak1 activation leads to PP2A activation (25), the potential role of β-adrenergic overdrive in causing the dense, heavily MAP4 decorated microtubule network found in pathological cardiac hypertrophy and failure will be an important new area of investigation.
In contrast to the usually transient changes in kinase/phosphatase activity seen in response to cellular stressors, the kinase/phosphatase dysregulation in chronic cardiac disease shown here has, once again, a salient feature in common with the directionally opposite kinase/phosphatase dysregulation found in chronic neurodegenerative Alzheimer disease (46). This common feature is the striking persistence of the dysregulation in each of these chronic conditions. Further, this cardiac cytoskeletal change is responsible for functionally important decrements in cardiomyocyte contractile mechanics (1) and intracellular transport (5), and it is found in clinical heart disease (47, 48). Thus, it is particularly important that this initially descriptive story (3) has now been moved this far upstream with tight mechanistic specificity, because this provides opportunities both to establish the precise myocardial stress response that causes this cytoskeletal change and to interrupt this maladaptive response therapeutically.
Supplementary Material
Acknowledgments
We gratefully acknowledge the generous gift of an adenovirus encoding constitutively active Pak1 from R. J. Solaro (Department of Physiology and Biophysics, Center for Cardiovascular Research, University of Illinois, Chigago, IL) and an adenovirus encoding constitutively active PP1 I-1 from R. J. Hajjar (Cardiovascular Research Center, Mount Sinai School of Medicine, New York, NY). We thank Thirumagal Thiyagarajan for technical assistance.
This work was supported, in whole or in part, by National Institutes of Health Grants HL48788 (to G. C., D. K., and D. R. M.) and HL094545 and HL104287 (to G. C.). This work was also supported by a Department of Veterans Affairs Merit Review Grant (to G. C.).

The on-line version of this article (available at http://www.jbc.org) contains supplemental Figs. S1–S5.
- MAP
- microtubule-associated protein
- PAB
- pulmonary artery band
- RV
- right ventricle
- LV
- left ventricle
- MARK
- microtubule affinity-regulating kinase
- Pak1
- p21-activated kinase 1
- PP
- protein phosphatase
- MES
- 4-morpholineethanesulfonic acid.
REFERENCES
- 1.Cooper G., 4th (2006) Am. J. Physiol. Heart Circ. Physiol. 291, H1003–H1014 [DOI] [PubMed] [Google Scholar]
- 2.Kostin S., Hein S., Arnon E., Scholz D., Schaper J. (2000) Heart Fail. Rev. 5, 271–280 [DOI] [PubMed] [Google Scholar]
- 3.Tsutsui H., Ishihara K., Cooper G., 4th (1993) Science 260, 682–687 [DOI] [PubMed] [Google Scholar]
- 4.Cheng G., Zile M. R., Takahashi M., Baicu C. F., Bonnema D. D., Cabral F., Menick D. R., Cooper G., 4th (2008) Am. J. Physiol. Heart Circ. Physiol. 294, H2231–H2241 [DOI] [PubMed] [Google Scholar]
- 5.Scholz D., Baicu C. F., Tuxworth W. J., Xu L., Kasiganesan H., Menick D. R., Cooper G., 4th (2008) Am. J. Physiol. Heart Circ. Physiol. 294, H1135–H1144 [DOI] [PubMed] [Google Scholar]
- 6.Hein S., Kostin S., Schaper J. (2008) Am. J. Physiol. Heart Circ. Physiol. 294, H1130–H1132 [DOI] [PubMed] [Google Scholar]
- 7.Chinnakkannu P., Samanna V., Cheng G., Ablonczy Z., Baicu C. F., Bethard J. R., Menick D. R., Kuppuswamy D., Cooper G., 4th (2010) J. Biol. Chem. 285, 21837–21848 [DOI] [PMC free article] [PubMed] [Google Scholar]
- 8.Illenberger S., Drewes G., Trinczek B., Biernat J., Meyer H. E., Olmsted J. B., Mandelkow E. M., Mandelkow E. (1996) J. Biol. Chem. 271, 10834–10843 [DOI] [PubMed] [Google Scholar]
- 9.Drewes G., Ebneth A., Mandelkow E. M. (1998) Trends Biochem. Sci. 23, 307–311 [DOI] [PubMed] [Google Scholar]
- 10.Iqbal K., Alonso Adel C., Chen S., Chohan M. O., El-Akkad E., Gong C. X., Khatoon S., Li B., Liu F., Rahman A., Tanimukai H., Grundke-Iqbal I. (2005) Biochim. Biophys. Acta 1739, 198–210 [DOI] [PubMed] [Google Scholar]
- 11.Drewes G., Ebneth A., Preuss U., Mandelkow E. M., Mandelkow E. (1997) Cell 89, 297–308 [DOI] [PubMed] [Google Scholar]
- 12.Iqbal K., Grundke-Iqbal I. (2008) J. Cell. Mol. Med. 12, 38–55 [DOI] [PMC free article] [PubMed] [Google Scholar]
- 13.Drewes G., Mandelkow E. M., Baumann K., Goris J., Merlevede W., Mandelkow E. (1993) FEBS Lett. 336, 425–432 [DOI] [PubMed] [Google Scholar]
- 14.Gong C. X., Lidsky T., Wegiel J., Zuck L., Grundke-Iqbal I., Iqbal K. (2000) J. Biol. Chem. 275, 5535–5544 [DOI] [PubMed] [Google Scholar]
- 15.Sheehan K. A., Ke Y., Solaro R. J. (2007) Am. J. Physiol. Regul. Integr. Comp. Physiol. 293, R963–R973 [DOI] [PubMed] [Google Scholar]
- 16.El-Armouche A., Bednorz A., Pamminger T., Ditz D., Didié M., Dobrev D., Eschenhagen T. (2006) Biochem. Biophys. Res. Commun. 346, 700–706 [DOI] [PubMed] [Google Scholar]
- 17.Huang F. L., Glinsmann W. H. (1976) Eur. J. Biochem. 70, 419–426 [DOI] [PubMed] [Google Scholar]
- 18.Mao K., Kobayashi S., Jaffer Z. M., Huang Y., Volden P., Chernoff J., Liang Q. (2008) J. Mol. Cell. Cardiol. 44, 429–434 [DOI] [PMC free article] [PubMed] [Google Scholar]
- 19.Cooper G., 4th, Satava R. M., Jr., Harrison C. E., Coleman H. N., 3rd (1973) Circ. Res. 33, 213–223 [DOI] [PubMed] [Google Scholar]
- 20.Tagawa H., Koide M., Sato H., Cooper G., 4th (1996) Proc. Assoc. Am. Physicians 108, 218–229 [PubMed] [Google Scholar]
- 21.Tagawa H., Rozich J. D., Tsutsui H., Narishige T., Kuppuswamy D., Sato H., McDermott P. J., Koide M., Cooper G., 4th (1996) Circulation 93, 1230–1243 [DOI] [PubMed] [Google Scholar]
- 22.Gergs U., Boknik P., Buchwalow I., Fabritz L., Matus M., Justus I., Hanske G., Schmitz W., Neumann J. (2004) J. Biol. Chem. 279, 40827–40834 [DOI] [PubMed] [Google Scholar]
- 23.Carr A. N., Schmidt A. G., Suzuki Y., del Monte F., Sato Y., Lanner C., Breeden K., Jing S. L., Allen P. B., Greengard P., Yatani A., Hoit B. D., Grupp I. L., Hajjar R. J., DePaoli-Roach A. A., Kranias E. G. (2002) Mol. Cell. Biol. 22, 4124–4135 [DOI] [PMC free article] [PubMed] [Google Scholar]
- 24.Takahashi M., Shiraishi H., Ishibashi Y., Blade K. L., McDermott P. J., Menick D. R., Kuppuswamy D., Cooper G., 4th (2003) Am. J. Physiol. Heart Circ. Physiol. 285, H2072–H2083 [DOI] [PubMed] [Google Scholar]
- 25.Ke Y., Wang L., Pyle W. G., de Tombe P. P., Solaro R. J. (2004) Circ. Res. 94, 194–200 [DOI] [PubMed] [Google Scholar]
- 26.Ostlund R. E., Jr., Leung J. T., Hajek S. V. (1979) Anal. Biochem. 96, 155–164 [DOI] [PubMed] [Google Scholar]
- 27.King C. C., Gardiner E. M., Zenke F. T., Bohl B. P., Newton A. C., Hemmings B. A., Bokoch G. M. (2000) J. Biol. Chem. 275, 41201–41209 [DOI] [PubMed] [Google Scholar]
- 28.Sheehan K. A., Ke Y., Wolska B. M., Solaro R. J. (2009) Am. J. Physiol. Cell. Physiol. 296, C47–C58 [DOI] [PMC free article] [PubMed] [Google Scholar]
- 29.Guan L., Song K., Pysz M. A., Curry K. J., Hizli A. A., Danielpour D., Black A. R., Black J. D. (2007) J. Biol. Chem. 282, 14213–14225 [DOI] [PubMed] [Google Scholar]
- 30.Rodriguez P., Mitton B., Waggoner J. R., Kranias E. G. (2006) J. Biol. Chem. 281, 38599–38608 [DOI] [PubMed] [Google Scholar]
- 31.Yoon S. Y., Choi J. E., Choi J. M., Kim D. H. (2008) Neurosci. Lett. 437, 111–115 [DOI] [PubMed] [Google Scholar]
- 32.Sakamoto K., Göransson O., Hardie D. G., Alessi D. R. (2004) Am. J. Physiol. Endocrinol. Metab. 287, E310–E317 [DOI] [PubMed] [Google Scholar]
- 33.Salt I. P., Johnson G., Ashcroft S. J., Hardie D. G. (1998) Biochem. J. 335, 533–539 [DOI] [PMC free article] [PubMed] [Google Scholar]
- 34.Chen J., Martin B. L., Brautigan D. L. (1992) Science 257, 1261–1264 [DOI] [PubMed] [Google Scholar]
- 35.Liu R., Zhou X. W., Tanila H., Bjorkdahl C., Wang J. Z., Guan Z. Z., Cao Y., Gustafsson J. A., Winblad B., Pei J. J. (2008) J. Cell. Mol. Med. 12, 241–257 [DOI] [PMC free article] [PubMed] [Google Scholar]
- 36.Kwon Y. G., Lee S. Y., Choi Y., Greengard P., Nairn A. C. (1997) Proc. Natl. Acad. Sci. U.S.A. 94, 2168–2173 [DOI] [PMC free article] [PubMed] [Google Scholar]
- 37.Liu C. W., Wang R. H., Dohadwala M., Schönthal A. H., Villa-Moruzzi E., Berndt N. (1999) J. Biol. Chem. 274, 29470–29475 [DOI] [PubMed] [Google Scholar]
- 38.Sato H., Nagai T., Kuppuswamy D., Narishige T., Koide M., Menick D. R., Cooper G., 4th (1997) J. Cell Biol. 139, 963–973 [DOI] [PMC free article] [PubMed] [Google Scholar]
- 39.Paturle-Lafanechère L., Manier M., Trigault N., Pirollet F., Mazarguil H., Job D. (1994) J. Cell Sci. 107, 1529–1543 [DOI] [PubMed] [Google Scholar]
- 40.Lizcano J. M., Göransson O., Toth R., Deak M., Morrice N. A., Boudeau J., Hawley S. A., Udd L., Mäkelä T. P., Hardie D. G., Alessi D. R. (2004) EMBO J. 23, 833–843 [DOI] [PMC free article] [PubMed] [Google Scholar]
- 41.Drewes G. (2004) Trends Biochem. Sci. 29, 548–555 [DOI] [PubMed] [Google Scholar]
- 42.Burns R. G. (1992) FEBS Lett. 297, 205–208 [DOI] [PubMed] [Google Scholar]
- 43.Schulze E., Kirschner M. (1986) J. Cell Biol. 102, 1020–1031 [DOI] [PMC free article] [PubMed] [Google Scholar]
- 44.Chidsey C. A., Braunwald E. (1966) Pharmacol. Rev. 18, 685–700 [PubMed] [Google Scholar]
- 45.Boknik P., Fockenbrock M., Herzig S., Knapp J., Linck B., Luss H., Muller F. U., Muller T., Schmitz W., Schroder F., Neumann J. (2000) Naunyn Schmiedeberg's Arch. Pharmacol. 362, 222–231 [DOI] [PubMed] [Google Scholar]
- 46.Echeverria V., Burgess S., Gamble-George J., Arendash G. W., Citron B. A. (2008) Neurosci. Lett. 444, 92–96 [DOI] [PubMed] [Google Scholar]
- 47.Heling A., Zimmermann R., Kostin S., Maeno Y., Hein S., Devaux B., Bauer E., Klövekorn W. P., Schlepper M., Schaper W., Schaper J. (2000) Circ. Res. 86, 846–853 [DOI] [PubMed] [Google Scholar]
- 48.Zile M. R., Green G. R., Schuyler G. T., Aurigemma G. P., Miller D. C., Cooper G., 4th (2001) J. Am. Coll. Cardiol. 37, 1080–1084 [DOI] [PubMed] [Google Scholar]
Associated Data
This section collects any data citations, data availability statements, or supplementary materials included in this article.


