

Abstract
BACKGROUND AND PURPOSE
Fungal infection is prevalent in patients with diabetes mellitus. Thus, we investigated whether a pharmacokinetic interaction occurs between the anti-fungal agent itraconazole and the anti-glycaemic drug metformin, as both drugs are commonly administered together to diabetic patients and are metabolized via hepatic CYP3A subfamily in rats.
EXPERIMENTAL APPROACH
Itraconazole (20 mg·kg−1) and metformin (100 mg·kg−1) were simultaneously administered i.v. and p.o. to rats. Concentrations (I) of each drug in the liver and intestine, maximum velocity (Vmax), Michaelis–Menten constant (Km) and intrinsic clearance (CLint) for the disappearance of each drug, apparent inhibition constant (Ki) and [I]/Ki ratios of each drug in the liver and intestine were determined. Also the metabolism of each drug in rat and human CYPs was measured in vitro.
KEY RESULTS
After simultaneous administration of both drugs, either i.v. or p.o., the total area under the plasma concentration–time curve from time zero to infinity (AUC)s of itraconazole and metformin were significantly greater than that of either drug administered alone. The metabolism of itraconazole and metformin was significantly inhibited by each other via CYP3A1 and 3A2 in rat and 3A4 in human microsomes.
CONCLUSIONS AND IMPLICATIONS
The significantly greater AUCs of itraconazole and metformin after i.v. administration of both drugs are probably due to competitive inhibition of the metabolism of each drug by each other via hepatic CYP3A1/2. Whereas after oral administration of both drugs, the significantly greater AUCs of each drug administered together than that of either drug alone is mainly due to competitive inhibition of intestinal metabolism of each drug by each other via intestinal CYP3A1/2.
Keywords: itraconazole, metformin, pharmacokinetics, drug interaction, CYP3A1/2
Introduction
In clinical situations drug interactions, pharmacological effects and side effects are usually evaluated by measuring changes in plasma levels of the drug. Hence, laboratory animals, such as rats, are commonly used to perform experiments that are not possible in humans, to predict drug–drug interactions based on the inhibition of cytochrome P450 (CYP)-mediated drug metabolism.
In patients with diabetes mellitus, fungal infection is prevalent (Tan and Joseph, 2004) and itraconazole, a triazole anti-fungal agent, is one of the most common and safe agents for the treatment of dermatophyte onychomycosis in these patients (Gupta et al., 2006). In humans, it has been suggested that hepatic CYP3A4 could be involved in the metabolism of itraconazole to form several metabolites, including 7-hydroxyitraconazole, the major metabolite (Penzak et al., 1999), which is an inhibitor of the CYP3A subfamily (Sagir et al., 2003). Recently, both the metabolism of itraconazole and formation of 7-hydroxyitraconazole were shown to be mediated by CYP3A1/2 in rats (Lee et al., 2009). Human CYP3A4 and rat CYP3A1 proteins have 73% homology (Lewis, 1996). After i.v., p.o., intraportal, intragastric or intraduodenal administration of itraconazole at a dose of 10 mg·kg−1 to male Sprague–Dawley rats, the extent of absolute oral bioavailability (F) value was approximately 35%, the hepatic first-pass effect after absorption into the portal vein was almost negligible, and the intestinal first-pass effect was approximately 70% of the oral dose (Shin et al., 2004).
Metformin, a biguanide anti-hyperglycaemic agent, has been widely used in the management of type 2 diabetes mellitus; it lowers blood glucose concentration without causing hypoglycaemia (Scheen, 1996). In humans, approximately 20% of an i.v. dose is thought to be metabolized (Scheen, 1996). After i.v., p.o., intraportal, intragastric or intraduodenal administration of metformin at a dose of 100 mg·kg−1 to male Sprague–Dawley rats, the F was approximately 29.9%, the hepatic first-pass effect after absorption into the portal vein was 26.0% and the intestinal first-pass effect was 53.8% of the p.o. dose (Choi et al., 2006). Metformin is metabolized via hepatic CYP2C11, 2D1 and 3A1/2 (but not via CYP1A2, 2B1/2 or 2E1) in male Sprague–Dawley rats (Choi and Lee, 2006). Therefore, as itraconazole and metformin are often administered together to diabetic patients and have been shown to be metabolized via the same hepatic CYP3A subfamily in rats (Choi and Lee, 2006; Lee et al., 2009), it is important to assess any possible interactions between these two drugs.
We used a rat model to study the pharmacokinetic interaction between itraconazole and metformin, after simultaneous i.v. or p.o. administration of the drugs.
Methods
Animals
Protocols for the animal studies were approved by the Animal Care and Use Committee of the College of Pharmacy, Seoul National University, Seoul, South Korea. Male Sprague–Dawley rats (5–8 weeks old, weighing 190–300 g) were purchased from Taconic Farms Inc. (Samtako Bio Korea, O-San, South Korea). The procedures used for housing and handling of the rats were similar to those reported previously (Choi and Lee, 2006; Choi et al., 2006; 2008;).
In vitro studies
Competitive inhibition for metabolism of itraconazole and metformin by each other in rat hepatic microsomes
The procedures used for the preparation of hepatic microsomes and to investigate the mode of inhibition for metabolism of metformin by itraconazole were similar to those reported previously (Choi et al., 2008). The following components were added to test tubes: hepatic microsomes (equivalent to 0.5 mg protein); 5 µL of 0.9% NaCl solution containing metformin base (as a substrate) at final concentrations of either 2.5, 5, 10, 20, 50 or 100 µM; 5 µL of dimethyl sulphoxide (DMSO) containing final itraconazole (as an inhibitor) concentrations of 0, 2, 10, 20, 50 or 100 µM; and 50 µL of 0.1 M phosphate buffer (pH 7.4) containing 1 mM β-nicotinamide adenine dinucleotide phosphate (NADPH). The volume was adjusted to 0.5 mL by adding 0.1 M phosphate buffer (pH 7.4), and the components were incubated at 37°C using a thermomixer (Thermomixer 5436; Eppendorf, Hamburg, Germany) at 500 oscillations per minute (opm). Incubation times were 5, 10 and 15 min. All of the incubation times were within the linear range of the reaction rate. At the end of the incubation time, the reaction was terminated by addition of 1 mL of acetonitrile. The procedures used to investigate the mode of inhibition of itraconazole by metformin were similar to those for mentioned above for metformin. Five microlitres of DMSO containing final itraconazole (as a substrate) concentrations of 2.5, 5, 10, 20 or 50 µM and 5 µL of 0.9% NaCl solution containing final metformin base (as an inhibitor) concentrations of 0, 2, 10, 20, 100 or 200 µM were used. Incubation times were 5, 15, 30, 45 and 50 min. At the end of the incubation time, the reaction was terminated by addition of 1 mL of methyl t-butyl ether. All of the incubation times were also within the linear range of the reaction rate.
Measurement of maximum velocity (Vmax), Michaelis–Menten constant (Km), intrinsic clearance (CLint) and inhibition constant (Ki) for the disappearance of itraconazole and metformin in the presence and absence of each drug in rat hepatic and intestinal microsomes
The procedures used for the preparation of hepatic and intestinal microsomes and for measurement of Vmax and Km (the concentration at which the rate is one half of the Vmax) for the disappearance of itraconazole in the absence and presence of metformin in hepatic and intestinal microsomes were similar to those reported previously (Choi et al., 2008). The following components were added to test tubes: microsomes (equivalent to 0.5 and 1.0 mg proteins for hepatic and intestinal microsomes respectively); 5 µL of DMSO containing final itraconazole concentrations of 2.5, 5, 10, 20 or 50 µM; 5 µL of 0.9% NaCl solution with and without a final metformin base concentration of 20 µM; and 50 µL of 0.1 M phosphate buffer (pH 7.4) containing 1 mM NADPH. The volume was adjusted to 0.5 mL by adding 0.1 M phosphate buffer (pH 7.4), and the components were incubated at 37°C using a thermomixer (at 500 opm). Incubation times were 5, 15, 30, 50 and 60 min for both hepatic and intestinal microsomes. The reaction was terminated by addition of 1 mL of methyl t-butyl ether at the end of the incubation for both hepatic and intestinal microsomes.
The methods used to determine the Vmax and Km for the disappearance of metformin in the absence and presence of itraconazole in hepatic and intestinal microsomes were similar to those mentioned above for itraconazole. Five microlitres of 0.9% NaCl solution containing final metformin base concentrations of 2.5, 5, 10, 20, 50 or 100 µM and 5 µL of DMSO with and without final itraconazole concentration of 20 µM were used. Incubation times were 5, 10 and 15 min for hepatic microsomes and 15, 30, 45 and 60 min for intestinal microsomes. At the end of the incubation period for both hepatic and intestinal microsomes, the reaction was terminated by addition of 1 mL of acetonitrile. All of the above incubation times were also within the linear range of the reaction rate.
The kinetic constants (Km and Vmax) for the disappearance of itraconazole and metformin in the absence and presence of each other were calculated using a non-linear regression method (Duggleby, 1995). The CLint was calculated by dividing the Vmax by the Km.
The apparent Ki of itraconazole and metformin for the disappearance of metformin and itraconazole, respectively, in hepatic and intestinal microsomes was also measured. The Ki of an inhibitor (metformin or itraconazole) was calculated using the following equation for competitive inhibition (Segel, 1975):
where [I] is the concentration of an inhibitor and Km′ is the apparent Michaelis–Menten constant of the substrate with an inhibitor. For competitive inhibition, the Ki is equivalent to the concentration of an inhibitor that doubles the slope of the inverse of velocity for the disappearance plotted against the inverse of the substrate concentration.
Bechmann and Lewis (2005) suggest that if, for a putative inhibitory drug–drug interaction, the [I]/Ki ratio is >2, the drug–drug interaction is due to CYP inhibition, but if the ratio is <0.01, the mechanism is not attributable to CYP inhibition.
Measurement of disappearance rate of itraconazole and metformin in rat microsomes from Baculovirus-infected insect cells expressing CYP3A1 and 3A2 and human Baculovirus-infected insect cells expressing CYP3A4
To find which CYP isozymes are responsible for the inhibition of the metabolism of itraconazole and metformin by each other, rat microsomes from Baculovirus-infected insect cells expressing CYP3A1 and 3A2 and human Baculovirus-infected insect cells expressing CYP3A4 were incubated with itraconazole and/or metformin. The procedures used were similar to those described previously (Yang et al., 2008). The disappearance rates of itraconazole in the presence and absence of metformin were determined after incubating the rat Baculovirus-infected insect cells (n = 4; equivalent to 30 pmol; each) or human Baculovirus-infected insect cells (n = 4; equivalent to 30 pmol; each) in 5 µL of 0.9% NaCl solution containing 20 µM itraconazole in the absence and presence of 20 µM of metformin base, and 50 µL of 0.1 M phosphate buffer of pH 7.4 containing 1 mM NADPH. The volume was adjusted to 0.5 mL by adding 0.1 M phosphate buffer of pH 7.4, and the incubations were carried out at 37°C using a thermomixer (at 500 opm), for 20 min; the reaction was terminated by addition of 1 mL methyl t-butyl ether.
The method used to measure the disappearance rates of metformin in the presence and absence of itraconazole was similar to those mentioned above for itraconazole. Five microlitres of 0.9% NaCl solution containing 20 µM metformin base were incubated with the cells in the absence and presence of 20 µM itraconazole. After the 20 min incubation, the reaction was terminated by addition of 1 mL of acetonitrile.
Rat plasma protein binding of itraconazole and metformin with and without each other using equilibrium dialysis
Protein binding values for itraconazole and metformin with and without each other to fresh plasma from control rats (n = 5; each) were measured using equilibrium dialysis (Choi et al., 2006). One millilitre of plasma was dialysed against 1 mL of isotonic Søresnsen phosphate buffer (pH 7.4) containing 3% (w/v) dextran (‘the buffer’) in a 1 mL dialysis cell (Spectrum Medical Industries, Los Angeles, CA, USA) using a Spectra/Por 4 membrane (mol. wt. cut-off 12–14 kDa; Spectrum Medical Industries). After 24 h incubation, two 50 µL samples were collected from each compartment and stored at −70°C (Revco ULT 1490 D-N-S; Western Mednics, Ashville, NC, USA) until used for the HPLC analysis of itraconazole and metformin (Hale et al., 2002; Shin et al., 2004; Choi and Lee, 2006).
In vivo studies
Single i.v. and p.o. administration of itraconazole, metformin and both drugs together to rats
The rats were anaesthetized with ether (in the early in the morning) before cannulation of the jugular vein (for drug administration in the i.v. study) and the carotid artery (for blood sampling), using methods similar to those described previously (Choi and Lee, 2006; Choi et al., 2006; 2008;). The rats were not restrained in the present study.
Itraconazole (diluted in 0.9% NaCl solution) at a dose of 20 mg·kg−1 (n = 8), metformin base (metformin hydrochloride dissolved in 0.9% NaCl solution) at a dose of 100 mg·kg−1 (n = 9) and both drugs together (n = 8) were manually infused i.v. (total infusion volume of 2 mL·kg−1) for 1 min via the jugular vein. Blood samples (approximately 0.12 mL for each drug alone or 0.22 mL for both drugs together) were collected via the carotid artery at 0 (control), 1 (end of the infusion), 5, 15, 30, 60, 120, 180, 240, 360, 480, 600, 720, 1440, 1800, 2160 or 2880 min after the start of the i.v. infusion of the drug(s). Blood samples were immediately centrifuged and a 50 µL plasma sample (two 50 µL samples for both drugs) was collected in a 1.5 mL polyethylene tube, and stored at −70°C until used for the HPLC analysis of itraconazole, 7-hydroxyitraconazole and metformin (Hale et al., 2002; Shin et al., 2004; Choi and Lee, 2006). The procedures used for preparation and handling of a 48 h urine sample (Ae0–48h) and the gastrointestinal tract (including its contents and faeces) sample at 48 h (GI48h) were similar to methods reported previously (Choi and Lee, 2006; Choi et al., 2006; 2008;).
Itraconazole (the same solution used in the i.v. study) at a dose of 20 mg·kg−1 (n = 6), metformin base (the same solution used in the i.v. study) at a dose of 100 mg·kg−1 (n = 7) and both drugs together (n = 9) were administered p.o. (total oral volume of 6 mL·kg−1) using a gastric gavage tube. Blood samples (approximately 0.12 mL for each drug alone or 0.22 mL for both drugs) were collected via the carotid artery at 0, 15, 30, 60, 90, 120, 180, 240, 360, 480, 600, 720, 960, 1200, 1400, 2160 or 2880 min after the p.o. administration of the drug(s). Other procedures were similar to those for the i.v. study.
Measurement of hepatic (after both i.v. and p.o. administration) and intestinal (after p.o. administration) concentrations of itraconazole and metformin after i.v. and p.o. administration of both drugs together
The procedures used were similar to those reported previously (Choi et al., 2006). The same doses of itraconazole and metformin were administered i.v. and p.o. At 5, 15, 30, 60, 120, 240, 480, 720 or 1880 min (for both i.v. or p.o. administration), as much blood as possible was collected via the carotid artery, and each rat was killed by cervical dislocation. Approximately 1 g of the liver (for both i.v. and p.o. studies) and intestine (for p.o. study) was excised and blotted on paper tissue (n = 3 at each time point for each route of administration).
HPLC analysis of itraconazole and metformin
Concentrations of itraconazole and 7-hydroxyitraconazole in the samples were determined by HPLC (Shin et al., 2004). Concentrations of metformin in the samples were determined by a slight modification of the method used by Choi et al. (2006) and Hale et al. (2002); ipriflavone instead of hydrocodeine was used as an internal standard.
Pharmacokinetic analysis
Standard methods (Gibaldi and Perrier, 1982) were used to calculate the following pharmacokinetic parameters using a non-compartmental analysis (WinNonlin; Pharsight Corporation, Mountain View, CA, USA): the total area under the plasma concentrations–time curve from time zero to infinity (AUC) (Chiou, 1978), the time-averaged total body, renal and non-renal clearances (CL, CLR and CLNR respectively), the terminal half-life, the first moment of AUC (AUMC), the mean residence time (MRT), the apparent volume of distribution at a steady state (Vss) and the F. The peak plasma concentration (Cmax) and time to reach Cmax (Tmax) were obtained directly from the experimental data.
Statistical analysis
A P-value <0.05 was deemed to be statistically significant; Student's t-test was used to determine differences between the two means for the unpaired data. All results are expressed as means ± SD except for Tmax, which was expressed as a median (range).
Chemicals
Sporanox® i.v. solution [10 mg·mL−1 as itraconazole as a solution in hydroxylpropyl-β-cyclodextrin (HP-β-CD)], itraconazole, 7-hydroxyitraconazole and R51012 (internal standard for the HPLC analysis of itraconazole and 7-hydroxyitraconazole) were supplied by Janssen Korea (Seoul, South Korea). Metformin hydrochloride was donated by Daelim Pharmaceutical Company (Seoul, South Korea). The reduced form of NADPH (as a tetrasodium salt), tris(hydroxymethyl)aminomethane (Tris)-buffer, ethylenediamine tetraacetic acid (EDTA; as a disodium salt) were purchased from Sigma–Aldrich Corporation (St. Louis, MO, USA). Human CYP enzymes (CYP3A cDNA-expressed P450 enzymes from rat), Baculovirus-infected insect cells expressing CYP3A1 and 3A2 (Supersomes) and human Baculovirus-infected insect cells expressing CYP3A4 were obtained from Gentest Corp. (Woburn, MA, USA). Other chemicals were of reagent or HPLC grade.
Results
In vitro studies
Competitive inhibition of metabolism of itraconazole and metformin by each other in rat hepatic microsomes
To investigate the kinetics of the inhibitory effects of metabolism of itraconazole and metformin by each other, the rates of disappearance of itraconazole and metformin in the hepatic microsomes were examined in the absence and presence of each other. The Lineweaver–Burk (Lineweaver and Burk, 1934) plots for the disappearance of itraconazole and metformin in the presence and absence of each other in hepatic microsomes are shown in Figure 1. A linear relationship between the inverse of substrate (itraconazole or metformin) concentrations and the inverse of velocities (primarily metabolism of itraconazole or metformin) of substrate was observed. Also on increasing the inhibitor (metformin or itraconazole) concentration, the slope between the inverse of the substrate concentration and the inverse of velocities of substrate increased and the y-intercept moved one point, indicating that inhibition occurred in a competitive manner.
Figure 1.
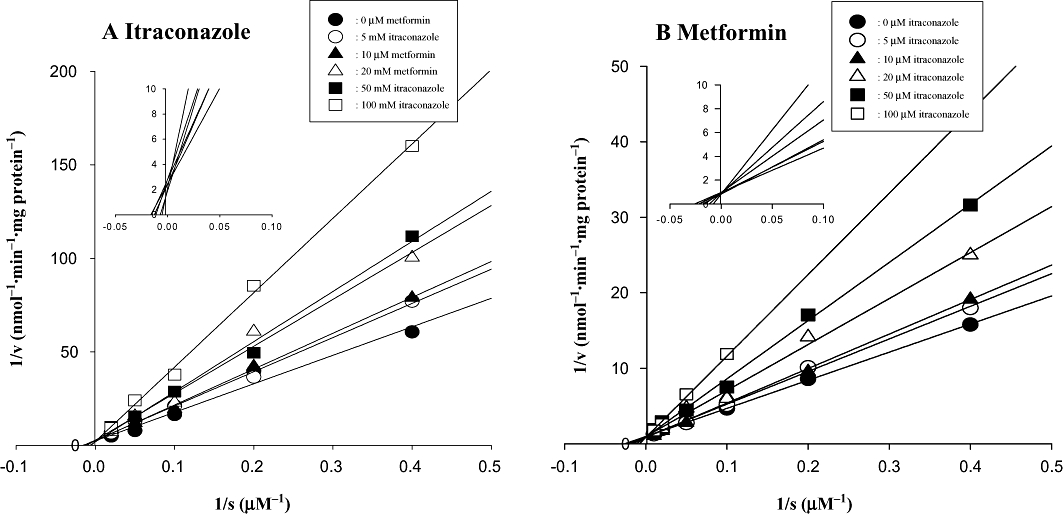
Lineweaver–Burk plots showing inhibition of the disappearance of itraconazole (A) and metformin (B) by each other in rat hepatic microsomes. The ‘s’ represents itraconazole (A) and metformin (B) concentration. The ‘v’ represents the velocity for the disappearance of itraconazole (A) and metformin (B). The symbols represent the concentrations of inhibitors, metformin (A) and itraconazole (B). Inset shows up to 0.10 of 1/s for the disappearance of itraconazole and metformin.
Vmax, Km and CLint for the disappearance of itraconazole and metformin in the absence and presence of each other, and Ki of itraconazole and metformin for inhibition of metabolism by each other in rat hepatic and intestinal microsomes
The Vmax, Km and CLint for the disappearance of itraconazole in the absence and presence of metformin in rat hepatic and intestinal microsomes are listed in Table 1. The Vmax values for itraconazole with and without metformin were comparable in both hepatic and intestinal microsomes, suggesting that the Vmax for the disappearance (primarily metabolism) of itraconazole was not affected by metformin. However, the Km values of itraconazole in the presence of metformin in the hepatic and intestinal microsomes were significantly higher (by 87.9% and 238% respectively) than those in the absence of metformin, suggesting that the affinity of the enzyme(s) for itraconazole was decreased by metformin. As a result, the CLints for itraconazole in the presence of metformin were significantly slower both in the hepatic and intestinal microsomes (by 33.1% and 58.1% respectively), suggesting that metabolism of itraconazole was inhibited by metformin. The apparent Ki values of metformin for inhibition of metabolism of itraconazole in rat hepatic and intestinal microsomes were from 6.12 to 8.98 and from 3.42 to 15.4 µM respectively.
Table 1.
Km, Vmax, CLint and Ki for the disappearance of itraconazole and metformin with and without each other in hepatic and intestinal microsomes
| Itraconazole | Metformin | ||||
|---|---|---|---|---|---|
| Parameter | Without metformin | With metformin | Parameter | Without itraconazole | With itraconazole |
| Hepatic | (n = 4) | (n = 5) | Hepatic | (n = 5) | (n = 5) |
| Km (µM) | 11.6 ± 3.12 | 21.8 ± 7.20* | Km (µM) | 38.0 ± 6.32 | 65.4 ± 17.6* |
| Vmax (nmol·min−1·mg−1 protein) | 0.132 ± 0.0368 | 0.165 ± 0.0461 | Vmax (nmol·min−1·mg−1 protein) | 0.986 ± 0.250 | 0.777 ± 0.419 |
| CLint (µL·min−1·mg−1 protein) | 11.5 ± 1.87 | 7.69 ± 1.17** | CLint (µL·min−1·mg−1 protein) | 25.6 ± 3.41 | 13.2 ± 8.49* |
| Ki (µM) for the inhibition of metabolism of metformin | 6.12 to 8.98 | Ki (µM) for the inhibition of metabolism of itraconazole | 5.76 to 13.4 | ||
| Intestinal | (n = 5) | (n = 4) | Intestinal | (n = 4) | (n = 4) |
| Km (µM) | 8.55 ± 2.87 | 28.9 ± 11.2** | Km (µM) | 26.9 ± 7.59 | 38.7 ± 1.85* |
| Vmax (nmol·min−1·mg−1 protein) | 0.0807 ± 0.0140 | 0.116 ± 0.0615 | Vmax (nmol·min−1·mg−1 protein) | 0.212 ± 0.0729 | 0.197 ± 0.0698 |
| CLint (µL·min−1·mg−1 protein) | 9.79 ± 1.39 | 4.10 ± 1.61*** | CLint (µL·min−1·mg−1 protein) | 7.72 ± 0.833 | 5.04 ± 1.57* |
| Ki (µM) for the inhibition of metabolism of metformin | 3.42 to 15.4 | Ki (µM) for the inhibition of metabolism of itraconazole | 4.89 to 16.4 | ||
Data are expressed as means ± SD.
Significantly different from without metformin or without itraconazole
P < 0.05
P < 0.01
P < 0.001.
CLint, intrinsic clearance; Ki, inhibition constant; Km, apparent Michaelis–Menten constant; Vmax, maximum velocity.
The values for Vmax, Km and CLint for the disappearance of metformin in the absence and presence of itraconazole in rat hepatic and intestinal microsomes are listed in Table 1. The Vmax values of metformin in both hepatic and intestinal microsomes were comparable in the absence and presence of itraconazole, suggesting that the Vmax for the disappearance (primarily metabolism) of metformin was not altered by itraconazole. However, the Km values of metformin with itraconazole in the hepatic and intestinal microsomes were significantly higher (by 72.1% and 43.9% respectively) than those obtained in the absence of metformin, suggesting that the affinity of the enzyme(s) for metformin was decreased by itraconazole. As a result, the CLints of metformin in the presence of itraconazole were significantly slower in both hepatic and intestinal microsomes (by 48.4% and 34.7% respectively). The apparent Ki values of itraconazole for the inhibition of metabolism of metformin in rat hepatic and intestinal microsomes were from 5.76 to 13.4 and 4.89 to 16.4 µM respectively.
The above data suggest that the inhibition of the metabolism of itraconazole and metformin by each other in both the liver and intestine occurs in a competitive manner.
In vitro disappearance of itraconazole and metformin in rat Baculovirus-infected insect cells expressing CYP3A1 and 3A2 and human Baculovirus-infected insect cells expressing CYP3A4
The amounts of itraconazole (Figure 2A) and metformin (Figure 2B) remaining after the addition of either itraconazole, metformin or both drugs together to rat microsomes from Baculovirus-infected insect cells expressing CYP3A1 and 3A2 and human Baculovirus-infected insect cells expressing CYP3A4 are shown in Figure 2, expressed as a percentage of the amount added to the cells. In the presence of metformin, the amounts of itraconazole (% of amount added) remaining via CYP3A1 and 3A2 were significantly greater (by 34.8% and 41.6% respectively) than those in the absence of metformin. Similarly, in the presence of itraconazole, the amounts of metformin remaining via CYP3A1 and 3A2 were also significantly greater (by 15.4% and 20.4% respectively) than those in the absence of itraconazole. In addition, in the presence of metformin, the amount of itraconazole remaining via CYP3A4 was significantly greater (by 21.6%) than that in the absence of metformin. Similarly, in the presence of itraconazole, the amount of metformin remaining via CYP3A4 was significantly greater (by 19.7%) than that in the absence of itraconazole. This suggests that metabolism of itraconazole and metformin was significantly inhibited by each other via CYP3A1 and 3A2 in rats and 3A4 in humans.
Figure 2.
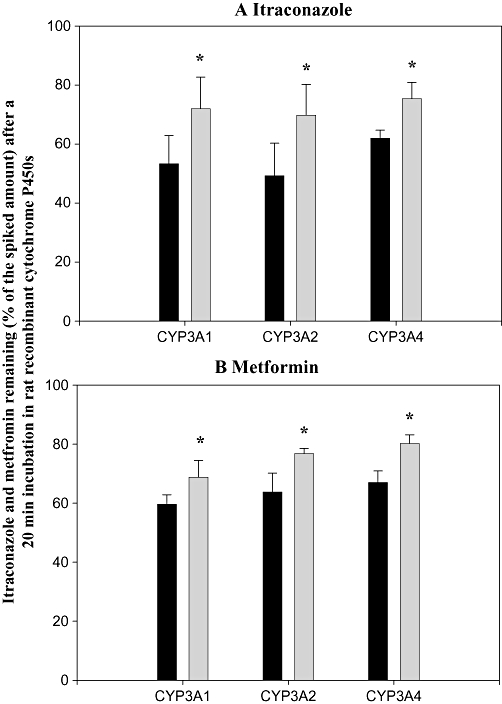
Mean quantities (expressed as a percentage of the amounts of drug added to the cells) of itraconazole (A) and metformin (B) remaining after a 20 min incubation in rat Baculovirus-infected insect cells expressing CYP3A1 and 3A2 and human Baculovirus-infected insect cells expressing CYP3A4 in the absence (solid columns) and presence (shaded columns) of 20 µM metformin (A), or itraconazole (B). Columns show means and bars represent SD. *Significantly different (P < 0.05) from the quantity remaining in the absence of metformin (A) or itraconazole (B).
Rat plasma protein binding of itraconazole and metformin using equilibrium dialysis
Protein binding values of itraconazole to fresh rat plasma were 95.1 ± 11.3% and 94.8 ± 9.57% in the presence and absence of metformin, respectively; they were not significantly different. The values of metformin were 13.5 ± 6.01% and 14.9 ± 5.05% in the presence and absence of itraconazole, respectively; they were also not significantly different.
In a preliminary study, plasma protein binding values of itraconazole and metformin were constant; the values were 94.9% and 10.3% for itraconazole (from 1 to 50 µg·mL−1) and metformin (from 0.1 to 200 µg·mL−1) concentrations respectively. Thus, a concentration of 5 µg·mL−1 for each drug was used in the plasma protein binding study.
In vivo studies
Pharmacokinetics of itraconazole and 7-hydroxyitraconazole after i.v. administration of itraconazole with and without metformin
After i.v. administration of itraconazole with and without metformin, the mean arterial plasma concentration–time profiles of itraconazole and 7-hydroxyitraconazole are shown in Figure 3A and B respectively. The relevant pharmacokinetic parameters are listed in Table 2. Changes in the pharmacokinetic parameters of itraconazole in the presence of metformin compared with in its absence were as follows: the AUC was significantly greater (by 20.9%); terminal half-life and MRT were significantly longer (by 38.1% and 27.7% respectively); CL and CLNR were significantly slower (by 24.6% and 24.7% respectively); and GI48h was significantly greater (by 38.1%). The CLR, Ae0–48h and GI48h of itraconazole were almost negligible. Thus, the changes in the above-mentioned parameters did not have a significant effect on the other pharmacokinetic parameters of itraconazole.
Figure 3.
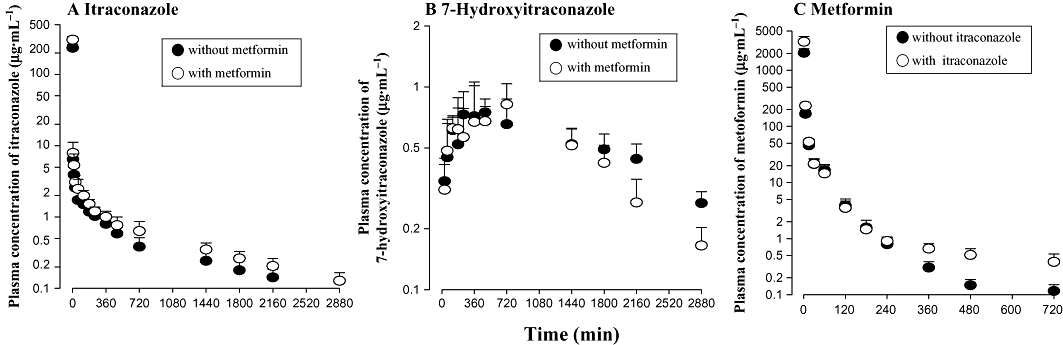
Mean arterial plasma concentration–time profiles of itraconazole (A) and 7-hydroxyitraconazole (B) after single i.v. administration of itraconazole 20 mg·kg−1 in the absence and presence of metformin 100 mg·kg−1, and of metformin (C) after single i.v. administration of metformin 100 mg·kg−1 in the absence and presence of itraconazole 20 mg·kg−1 to rats. Symbols show means and bars represent SD.
Table 2.
Pharmacokinetic parameters of itraconazole, 7-hydroxyitraconazole and metformin after single i.v. administration of itraconazole 20 mg·kg−1, metformin 100 mg·kg−1 or both drugs together to rats
| Itraconazole | Metformin | ||||
|---|---|---|---|---|---|
| Parameter | Without metformin (n = 8) | With metformin (n = 8) | Parameter | Without itraconazole (n = 9) | With itraconazole (n = 8) |
| Itraconazole | Metformin | ||||
| AUC (µg·min−1·mL−1) | 2390 ± 461 | 2890 ± 354* | AUC (µg·min−1·mL−1) | 6840 ± 553 | 9510 ± 1370** |
| Terminal half-life (min) | 753 ± 160 | 1040 ± 178* | Terminal half-life (min) | 144 ± 37.5 | 268 ± 92.1*** |
| MRT (min) | 716 ± 148 | 914 ± 166* | MRT (min) | 26.3 ± 5.48 | 38.2 ± 12.6* |
| Vss (mL·kg−1) | 4390 ± 1340 | 4060 ± 609 | Vss (mL·kg−1) | 383 ± 69.7 | 403 ± 123 |
| CL (mL·min−1·kg−1) | 6.55 ± 1.35 | 4.94 ± 0.579** | CL (mL·min−1·kg−1) | 14.7 ± 1.18 | 10.7 ± 1.58*** |
| CLR (mL·min−1·kg−1) | 0.0730 ± 0.0605 | 0.0618 ± 0.0623 | CLR (mL·min−1·kg−1) | 11.6 ± 1.64 | 9.10 ± 1.23** |
| CLNR (mL·min−1·kg−1) | 6.48 ± 1.36 | 4.88 ± 0.598** | CLNR (mL·min−1·kg−1) | 3.11 ± 1.47 | 1.61 ± 0.823* |
| Ae0–48h (% of itraconazole dose) | 1.54 ± 1.07 | 1.30 ± 1.46 | Ae0–48h (% of metformin dose) | 78.9 ± 9.65 | 85.3 ± 6.93 |
| GI48h (% of itraconazole dose) | 0.226 ± 0.0870 | 0.312 ± 0.374* | GI48h (% of metformin dose) | 1.06 ± 0.750 | 1.61 ± 0.823 |
| 7-Hydroxyitraconazole | |||||
| AUC (µg·min−1·mL−1) | 1930 ± 463 | 1490 ± 236* | |||
| Terminal half-life (min) | 1270 ± 427 | 757 ± 127 | |||
| Cmax (µg·mL−1) | 0.907 ± 0.227 | 0.936 ± 0.206 | |||
| Tmax (min) | 360 (120 to 720) | 480 (180 to 720) | |||
| Ae0–48h (% of itraconazole dose) | 0.220 ± 0.206 | 0.332 ± 0.377 | |||
| GI48h (% of itraconazole dose) | 0.170 ± 0.0874 | 0.216 ± 0.362 | |||
| AUC7-hydroxyitraconazole/AUCitraconazole | 81.6 ± 16.8 | 52.2 ± 9.84** | |||
Data are expressed as means ± SD.
Significantly different from without metformin or without itraconazole
P < 0.05
P < 0.01
P < 0.001.
Ae0–48h, percentage of the dose excreted in the 48 h urine; AUC, total area under the plasma concentration–time curve from time zero to infinity; CL, time-averaged total body clearance; CLNR, time-averaged nonrenal clearance; CLR, time-averaged renal clearance; Cmax, peak plasma concentration; GI48h, percentage of the dose recovered from the entire gastrointestinal tract (including its contents and feces) at 48 h; MRT, mean residence time; Tmax, time to reach Cmax, Vss, apparent volume of distribution at steady state.
After i.v. administration of itraconazole with or without metformin, formation of 7-hydroxyitraconazole was rapid; 7-hydroxyitraconazole was detected in plasma at the second blood sampling time point (15 min) in both the absence and presence of metformin (Figure 3B). After i.v. administration of both drugs together, the AUC of 7-hydroxyitraconazole and AUC7-hydroxyitraconazole/AUCitraconazole ratio were significantly smaller (by 22.8% and 36.0% respectively) than those of itraconazole alone.
Pharmacokinetics of metformin after its i.v. administration with and without itraconazole
The mean arterial plasma concentration–time profiles of metformin after its i.v. administration with and without itraconazole are shown in Figure 3C. The relevant pharmacokinetic parameters are also listed in Table 2. Changes in the pharmacokinetic parameters of metformin in the presence of itraconazole compared with in its absence were as follows: the AUC was significantly greater (by 39.0%); terminal half-life and MRT were significantly longer (by 86.1% and 45.2% respectively); and CL, CLR and CLNR were significantly slower (by 27.2%, 21.6% and 48.2% respectively).
Pharmacokinetics of itraconazole and 7-hydroxyitraconazole after p.o. administration of itraconazole with and without metformin
After p.o. administration of itraconazole with and without metformin, the mean arterial plasma concentration–time profiles of itraconazole and 7-hydroxyitraconazole are shown in Figure 4A and B respectively. The relevant pharmacokinetic parameters are listed in Table 3. After p.o. administration of itraconazole with or without metformin, absorption of itraconazole from the gastrointestinal tract and formation of 7-hydroxyitraconazole were rapid; itraconazole and 7-hydroxyitraconazole were detected in plasma at the second blood sampling time point (15 min) in both the absence and presence of metformin. Changes in the pharmacokinetic parameters of itraconazole and 7-hydroxyitraconazole with metformin compared with in its absence were as follows: the AUC and Tmax of itraconazole were significantly greater (69.3% increase) and shorter (by 25.0%), respectively; the AUC, Cmax and Tmax of 7-hydroxyitraconazole were significantly smaller (by 13.9%), lower (by 35.1%) and longer (by 100%), respectively; and the AUC7-hydroxyitraconazole/AUCitraconazole ratio was significantly smaller (by 48.2%).
Figure 4.
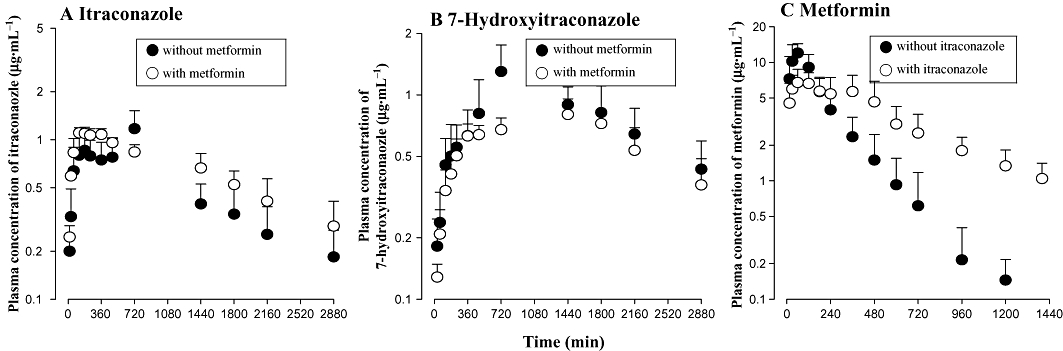
Mean arterial plasma concentration–time profiles of itraconazole (A) and 7-hydroxyitraconazole (B) after single p.o. administration of itraconazole 20 mg·kg−1 in the absence and presence of metformin 100 mg·kg−1, and of metformin (C) after single p.o. administration of metformin 100 mg·kg−1 in the absence and presence of itraconazole 20 mg·kg−1 to rats. Symbols show means and bars represent SD.
Table 3.
Pharmacokinetic parameters of itraconazole, 7-hydroxyitraconazole and metformin after single p.o. administration of itraconazole 20 mg·kg−1, metformin 100 mg·kg−1 or both drugs together to rats
| Itraconazole | Metformin | ||||
|---|---|---|---|---|---|
| Parameter | Without metformin (n = 6) | With metformin (n = 9) | Parameter | Without itraconazole (n = 7) | With itraconazole (n = 9) |
| Itraconazole | Metformin | ||||
| AUC (µg·min−1·mL−1) | 1370 ± 377 | 2320 ± 525* | AUC (µg·min−1·mL−1) | 2930 ± 660 | 5340 ± 1260** |
| Terminal half-life (min) | 969 ± 268 | 1140 ± 533 | Terminal half-life (min) | 253 ± 38.8 | 490 ± 177* |
| CLR (mL·min−1·kg−1) | 0.0307 ± 0.0308 | 0.00643 ± 0.00795 | CLR (mL·min−1·kg−1) | 30.9 ± 8.27 | 16.9 ± 3.44** |
| Cmax (µg·mL−1) | 1.20 ± 0.318 | 1.29 ± 0.403 | Cmax (µg·mL−1) | 13.9 ± 2.11 | 8.15 ± 1.74** |
| Tmax (min) | 480 (120 to 720) | 360 (120 to 720)*** | Tmax (min) | 60 (15 to 120) | 120 (15 to 360)** |
| Ae0–48h (% of itraconazole dose) | 0.182 ± 0.199 | 0.0670 ± 0.0742 | Ae0–48h (% of metformin dose) | 86.2 ± 11.2 | 87.2 ± 12.1 |
| GI48h (% of itraconazole dose) | 0.309 ± 0.153 | 0.342 ± 0.195 | GI48h (% of metformin dose) | 6.05 ± 3.70 | 4.76 ± 2.21 |
| F (%) | 57.3 | 68.4 | F (%) | 42.8 | 56.2 |
| 7-Hydroxyitraconazole | |||||
| AUC (µg·min−1·mL−1) | 2520 ± 316 | 2170 ± 274*** | |||
| Terminal half-life (min) | 1180 ± 426 | 1190 ± 381 | |||
| CLR (mL·min−1·kg−1) | 0.00564 ± 0.00453 | 0.00379 ± 0.00174 | |||
| Cmax (µg·mL−1) | 1.30 ± 0.453 | 0.844 ± 0.109*** | |||
| Tmax (min) | 720 (720 to 1800) | 1440 (30 to 360)*** | |||
| Ae0–48h (% of itraconazole dose) | 0.187 ± 0.161 | 0.0919 ± 0.0394 | |||
| GI48h (% of itraconazole dose) | 0.315 ± 0.108 | 0.346 ± 0.152 | |||
| AUC7-hydroxyitraconazole/AUCitraconazole | 190 ± 34.4 | 98.5 ± 27.7** | |||
Data are expressed as means ± SD.
Significantly different from without metformin or without itraconazole
P < 0.01
P < 0.001
P < 0.05.
Ae0–48h, percentage of the dose excreted in the 48 h urine; AUC, total area under the plasma concentration–time curve from time zero to infinity; CLR, time-averaged renal clearance; Cmax, peak plasma concentration; F, extent of absolute oral bioavailability; GI48h, percentage of the dose recovered from the entire gastrointestinal tract (including its contents and feces) at 48 h; Tmax, time to reach Cmax.
Pharmacokinetics of metformin after its p.o. administration with and without itraconazole
The mean arterial plasma concentration–time profiles of metformin after its p.o. administration with and without itraconazole are shown in Figure 4C. The relevant pharmacokinetic parameters are also listed in Table 3. Changes in the pharmacokinetic parameters of metformin in the presence of itraconazole compared with in its absence were as follows; the AUC was significantly greater (by 82.3%); terminal half-life was significantly longer (by 93.7%); CLR was significantly slower (by 45.3%); Cmax was significantly lower (by 41.4%); and Tmax were significantly longer (by 100%).
Liver and intestinal concentrations of itraconazole and metformin after i.v. and p.o. administration of both drugs together
After i.v. and p.o. administration of both drugs together, the concentrations and tissue-to-plasma ratios of each drug in the liver and intestine are listed in Table 4. After i.v. administration of both drugs together, the liver concentration/Ki ratios of metformin up to 240 min and the liver concentration/Ki ratios of itraconazole up to 1800 min were greater than (or in the range of) 2.0 (Table 4). After i.v. administration of both drugs together, the AUC0–240min/AUC ratio of itraconazole and AUC0–1800min/AUC ratio of metformin were high; the values were 34.9% and 100% respectively. After p.o. administration of both drugs together, the liver concentration/Ki ratios of metformin up to 240 min and intestinal concentration/Ki ratios of metformin up to 720 min, liver concentration/Ki ratios of itraconazole up to 1800 min, and intestinal concentration/Ki ratios of itraconazole up to 1800 min were greater than (or in the range of) 2.0 (Table 4). After p.o. administration of both drugs together, the AUC0–240min/AUC ratio of itraconazole, AUC0–720min/AUC ratio of itraconazole and AUC0–1800min/AUC ratio of metformin were high; 16.8%, 45.5% and 100% respectively. The above data suggest that the competitive inhibition of metabolism of each drug by each other in the liver and intestine was mainly due to inhibition of CYP (Bechmann and Lewis, 2005).
Table 4.
Concentrations (I; µM) and [I]/Ki of itraconazole and metformin in the liver (i.v. and p.o. studies) and intestine (p.o. study) after simultaneous single i.v. and p.o. administration of itraconazole (20 mg·kg−1) and metformin (100 mg·kg−1) to rats
| Metformin | |||||||
|---|---|---|---|---|---|---|---|
| i.v. | p.o. | ||||||
| Time (min) | Liver concentration | [I]/Ki | Time (min) | Liver concentration | [I]/Ki | Intestine concentration | [I]/Ki |
| Metformin | |||||||
| 5 | 58.7 ± 22.1 (0.159 ± 0.0496) | 6.54–9.59 | 30 | 27.1 ± 9.95 (1.21 ± 0.425) | 3.02–4.43 | 25.7 ± 9.83 (1.15 ± 0.435) | 1.67–7.51 |
| 15 | 123 ± 19.0 (1.05 ± 0.177) | 13.7–20.1 | 60 | 49.5 ± 25.7 (2.09 ± 1.22) | 5.51–8.09 | 34.0 ± 10.7 (1.35 ± 0.0336) | 2.21–9.94 |
| 30 | 65.6 ± 43.6 (1.09 ± 0.528) | 7.31–10.7 | 120 | 23.5 ± 2.04 (1.20 ± 0.314) | 2.62–3.84 | 34.0 ± 2.52 (1.78 ± 0.649) | 2.21–9.94 |
| 60 | 42.2 ± 1.23 (1.12 ± 0.135) | 4.70–6.89 | 240 | 14.9 ± 2.41 (0.996 ± 0.152) | 1.66–2.43 | 39.7 ± 3.34 (2.66 ± 0.364) | 2.58–11.6 |
| 120 | 33.7 ± 11.4 (5.64 ± 2.03) | 3.75–5.51 | 480 | 11.1 ± 3.22 (1.31 ± 0.550) | 1.24–1.81 | 26.7 ± 2.70 (3.16 ± 1.17) | 1.73–7.81 |
| 240 | 14.4 ± 6.58 (7.14 ± 6.57) | 1.60–2.35 | 720 | 5.99 ± 1.52 (1.08 ± 0.344) | 0.667–0.979 | 15.5 ± 4.72 (2.82 ± 1.08) | 1.01–4.53 |
| 480 | 3.21 ± 1.00 (2.15 ± 1.22) | 0.357–0.525 | |||||
| Itraconazole | |||||||
| 5 | 27.4 ± 2.66 (2.22 ± 0.730)* | 2.04–4.76 | 30 | 21.3 ± 7.59 (21.2 ± 7.96) | 1.59–3.70 | 27.2 ± 11.4 (27.2 ± 12.0) | 1.66–5.56 |
| 15 | 37.7 ± 4.68 (4.09 ± 1.02) | 2.81–6.55 | 60 | 38.0 ± 4.48 (9.11 ± 0.815) | 2.84–6.60 | 52.1 ± 21.8 (12.5 ± 5.17) | 3.18–10.7 |
| 30 | 37.5 ± 10.0 (6.40 ± 1.27) | 2.80–6.51 | 120 | 37.7 ± 3.60 (14.8 ± 1.42) | 2.81–6.55 | 36.2 ± 4.40 (14.3 ± 2.64) | 2.21–7.40 |
| 60 | 43.0 ± 13.2 (10.7 ± 0.802) | 3.21–7.47 | 240 | 39.6 ± 12.4 (23.4 ± 9.10) | 2.96–6.88 | 38.4 ± 9.73 (21.9 ± 3.73) | 2.34–7.85 |
| 120 | 39.9 ± 1.26 (22.4 ± 6.46) | 2.98–6.93 | 480 | 34.1 ± 3.87 (31.4 ± 3.78) | 2.54–5.92 | 33.0 ± 2.70 (30.4 ± 2.61) | 2.01–6.77 |
| 240 | 24.6 ± 9.79 (19.0 ± 10.9) | 1.84–4.27 | 720 | 22.3 ± 4.70 (25.5 ± 10.9) | 1.66–3.71 | 24.6 ± 10.2 (26.8 ± 13.7) | 1.50–5.03 |
| 480 | 22.9 ± 7.72 (40.8 ± 8.65) | 1.71–3.98 | 1800 | 15.0 ± 2.48 (41.9 ± 9.98) | 1.13–2.62 | 17.0 ± 8.93 (48.0 ± 27.2) | 1.04–3.48 |
| 720 | 17.6 ± 2.53 (55.1 ± 5.68) | 1.31–3.06 | |||||
| 1800 | 12.6 ± 2.42 (50.7 ± 24.5) | 0.940–2.188 | |||||
Data are expressed as means ± SD.
The values in parentheses represent the tissue-to-plasma (T/P) ratios.
Discussion
The doses of itraconazole, 20 mg·kg−1, and of metformin, 100 mg·kg−1, used in this study are within the ranges of dose-proportional AUCs of each drug based on results from previous studies done by Shin et al. (2004) and Choi et al. (2006); they determined dose-proportional AUCs for itraconazole and metformin, respectively, after both i.v. and p.o. administration to rats.
To find which hepatic CYP isozymes inhibit metabolism of itraconazole and metformin by each other, itraconazole and metformin were incubated with microsomes from rat Baculovirus-infected insect cells expressing CYP3A1 and 3A2 and with human Baculovirus-infected insect cells expressing CYP3A4 in vitro. The results suggest that metabolism of itraconazole and metformin are mainly inhibited by each other via CYP3A1/2 in rats and 3A4 in humans (Figure 2). A similar homology between rat and human CYP isozymes was reported by Lewis (1996).
It has been reported that changes in the CLNRs of itraconazole (Shin et al., 2004) and metformin (Choi et al., 2006) were due to changes in metabolism of each drug in rats. Thus, the changes in the CLNRs of itraconazole and metformin after administration of both drugs together, listed in Table 2, could represent changes in the metabolism of each drug. Following i.v. administration of both drugs together, the CLNRs of each drug were significantly slower than that of each drug alone (Table 2). Both itraconazole (Shin et al., 2004) and metformin (Choi et al., 2006) are drugs with low hepatic extraction ratios in rats. Thus, their hepatic clearances depend more on the hepatic CLints for the disappearance of each drug than on the hepatic blood flow rate (Wilkinson and Shand, 1975). The significantly slower CLNRs of itraconazole and metformin administered together than that of either drug alone (Table 2) is consistent with the significantly slower in vitro hepatic CLints for the disappearance of itraconazole and metformin induced by each other respectively (Table 1). The slower CLints of each drug (Table 1) could have been due to a competitive inhibition for the metabolism of either drug by each other via hepatic CYP3A1/2 (Figure 1). Rat plasma protein binding values of itraconazole and metformin were not altered by each other.
After i.v. administration of both drugs together, the significantly slower CLNRs of each drug alone (Table 2) are also consistent with the values obtained for apparent Ki of each drug and [I]/Ki ratios in the liver (Tables 1 and 4). The [I]/Ki ratios of metformin of greater than (or in the ranges of) 2 for inhibition of metabolism of itraconazole up to 240 min and of itraconazole for inhibition of metabolism of metformin up to 1800 min (Table 4) further indicate that the metformin–itraconazole interaction is primarily due to the competitive inhibition of hepatic CYP3A1/2 in the liver. The significantly smaller AUCs of 7-hydroxyitraconazole and AUC7-hydroxyitraconazole/AUC ratio (Table 2) could have been due to a result of inhibition of metabolism of itraconazole to form 7-hydroxyitraconazole by metformin.
After p.o. administration of both drugs together, the AUCs of metformin and itraconazole were also significantly greater than those of each drug alone (Table 3). However, this was unlikely to be due to the increased gastrointestinal absorption of metformin and itraconazole by each other. The mean ‘true’ fractions of the p.o. dose of metformin and itraconazole unabsorbed (‘Funabs’) in the absence and presence of each other were estimated based on the equation reported by Lee and Chiou (1983). The ‘Funabs’ values of metformin thus estimated were 5.64% and 3.66% in the presence and absence of itraconazole respectively. The corresponding values for itraconazole were 0.212% and 0.167% for with and without metformin. Thus, more than 94% of the p.o. dose of metformin and itraconazole were absorbed for both with and without each other.
The significantly greater AUC of itraconazole after p.o. administration of both drugs together than that obtained after itraconazole alone (Table 3) is consistent with the values obtained for CLint, apparent Ki, concentrations of each drug, and ratios of [I]/Ki in the liver and intestine. Metformin inhibits the hepatic metabolism of itraconazole after p.o. administration of both drugs together as mentioned earlier. However, the contribution of the inhibition of hepatic metabolism of itraconazole by metformin to the AUC of itraconazole obtained after its administration p.o. was considerably smaller than that of intestinal metabolism; the intestinal first-pass effect of itraconazole was approximately 70% of the p.o. dose, but the hepatic first-pass effect is almost negligible in rats (Shin et al., 2004). Thus, the significantly greater AUC of itraconazole after p.o. administration of both drugs together (Table 3) is probably mainly due to the competitive inhibition of intestinal metabolism of itraconazole by metformin via intestinal CYP3A1/2. Therefore, the greater magnitude of the increase in AUC of itraconazole after the administration of both drugs together p.o. compared with their i.v. administration, 69.3% compared with 20.9% increase (Tables 3 and 2 respectively), is likely to be mainly due to the inhibition of intestinal metabolism of itraconazole by metformin.
The significantly greater AUC of metformin after p.o. administration of both drugs together could also have been due to a competitive inhibition of hepatic and intestinal metabolism of metformin by itraconazole (Table 3). This is supported by the values obtained for CLint, apparent Ki, concentrations of each drug and ratios of [I]/Ki in the liver and intestine. Itraconazole inhibited the hepatic metabolism of metformin after p.o. administration of both drugs together as mentioned earlier. However, the contribution of inhibition of hepatic metabolism of metformin by itraconazole to the AUC of metformin given p.o. was considerably smaller than that of intestinal metabolism, as the gastrointestinal first-pass effect of metformin was 53.8% of the p.o. dose, but the hepatic first-pass effect was only 11.3% of oral dose in rats (Choi et al., 2006). Thus, the significantly greater AUC of metformin, after p.o. administration of both drugs together (Table 3), is likely to have been due mainly to the competitive inhibition of intestinal metabolism of metformin by itraconazole via intestinal CYP3A1/2. Therefore, the greater magnitude of the increase in AUC of metformin after p.o. administration of both drugs together, 82.3% increase (Table 3), than after i.v. administration (Table 2), 39.0% increase, is probably mainly been due to the inhibition of intestinal metabolism of metformin by itraconazole.
The significantly slower CLR of metformin by itraconazole after simultaneous single i.v. (Table 2) or p.o. (Table 3) administration of both drugs could also contribute to the significantly greater AUCs of metformin after both routes of administration (Tables 2 and 3). Metformin is mainly excreted in the urine via organic cation transporter 2 (Kimura et al., 2005), but is not a substrate for P-glycoprotein (P-gp) (Song et al., 2006). Itraconazole is a substrate and inhibitor for P-gp (Wang et al., 2002). Similar results have also been reported for the CLR of metformin; it was significantly slower after co-administration of udenafil (a substrate for P-gp) in rats (Choi et al., 2008). However, the exact reason for the slower CLR of metformin in the presence of itraconazole is not clear.
In summary, after i.v. administration of itraconazole and metformin together to rats, the significantly slower CLNRs of each drug than that of each drug alone (Table 2) could be due to a competitive inhibition of metabolism of each drug by each other via hepatic CYP3A1/2. Whereas, after p.o. administration of both drugs, the significantly greater AUCs of each drug than that of each drug alone (Table 3) could be mainly due to a competitive inhibition of intestinal metabolism of each drug by each other via intestinal CYP3A1/2 in addition to a competitive inhibition of hepatic metabolism of each drug by each other via hepatic CYP1A1/2. These results could be useful to predict and design clinical studies to investigate the interaction between itraconazole and metformin. Also if the present data obtained in rats is extrapolated to humans, the dosage regimen of itraconazole and metformin used in the clinical situation should be modified to take account of the decreased metabolism of the drugs, especially with chronic administration schedules. Although similar results have been obtained in studies involving rats and humans in vivo, further experiments in humans are required to confirm the above hypothesis.
Acknowledgments
This work was supported in part by a grant from the 2009 Brain Korea 21 Project for Applied Pharmaceutical Life Sciences.
Glossary
Abbreviations
- Ae0–24h
percentage of the dose excreted in the 24 h urine
- AUC
total area under the plasma concentration–time curve from time zero to infinity
- CL
time-averaged total body clearance
- CLint
intrinsic clearance
- CLNR
time-averaged non-renal clearance
- CLR
time-averaged renal clearance
- Cmax
peak plasma concentration
- F
extent of absolute oral bioavailability
- GI24h
percentage of the dose recovered from the entire gastrointestinal tract (including its contents and faeces) at 24 h
- Ki
inhibition constant
- Km
Michaelis–Menten constant
- MRT
mean residence time; s, substrate
- Tmax
time to reach Cmax
- v
velocity
- Vmax
maximum velocity
- Vss
apparent volume of distribution at steady state
Conflict of interest
The authors state no conflict of interest.
Supplemental material
References
- Bechmann KA, Lewis JD. Predicting inhibitory drug–drug interactions and evaluating drug interaction reports using inhibition constants. Ann Pharmacother. 2005;39:1064–1072. doi: 10.1345/aph.1E508. [DOI] [PubMed] [Google Scholar]
- Chiou WL. Critical evaluation of potential error in pharmacokinetic studies using the linear trapezoidal rule method for the calculation of the area under the plasma level–time curve. J Pharmacokinet Biopharm. 1978;6:539–546. doi: 10.1007/BF01062108. [DOI] [PubMed] [Google Scholar]
- Choi YH, Lee MG. Effects of enzyme inducers and inhibitors on the pharmacokinetics of metformin in rats: involvement of CYP2C11, 2D1, and 3A1/2 for the metabolism of metformin. Br J Pharmacol. 2006;149:424–230. doi: 10.1038/sj.bjp.0706875. [DOI] [PMC free article] [PubMed] [Google Scholar]
- Choi YH, Kim SG, Lee MG. Dose-independent pharmacokinetics of metformin in rats: hepatic and gastrointestinal first-pass effects. J Pharm Sci. 2006;95:2543–2552. doi: 10.1002/jps.20744. [DOI] [PubMed] [Google Scholar]
- Choi YH, Chung SJ, Lee MG. Pharmacokinetic interaction between DA-8159, a new erectogenic, and metformin in rats: competitive inhibition of metabolism via hepatic CYP3A1/2. Br J Pharmacol. 2008;153:1568–1578. doi: 10.1038/sj.bjp.0707680. [DOI] [PMC free article] [PubMed] [Google Scholar]
- Duggleby RG. Analysis of enzyme progress curves by nonlinear regression. Methods Enzymol. 1995;249:61–90. doi: 10.1016/0076-6879(95)49031-0. [DOI] [PubMed] [Google Scholar]
- Gibaldi M, Perrier D. Pharmacokinetics. 2nd edn. New York: Marcel Dekker; 1982. [Google Scholar]
- Gupta AK, Gover MD, Lynde CW. Pulse itraconazole vs. continuous terbinafine for the treatment of dermatophyte toenail onychomycosis in patients with diabetes mellitus. J Eur Acad Dermatol Venereol. 2006;20:1188–1193. doi: 10.1111/j.1468-3083.2006.01698.x. [DOI] [PubMed] [Google Scholar]
- Hale TW, Kristensen JH, Hackett LP, Kohan R, Ilett KF. Transfer of metformin into human milk. Diabetologia. 2002;45:1509–1514. doi: 10.1007/s00125-002-0939-x. [DOI] [PubMed] [Google Scholar]
- Kimura N, Masuda S, Tanihara Y, Ueo H, Okuda M, Katsura T, et al. Metformin is a superior substrate for renal organic cation transporter OCT2 rather than hepatic OCT1. Drug Metab Pharmacokinet. 2005;20:379–386. doi: 10.2133/dmpk.20.379. [DOI] [PubMed] [Google Scholar]
- Lee MG, Chiou WL. Evaluation of potential causes for the incomplete bioavailability of furosemide: gastric first-pass metabolism. J Pharmacokinet Biopharm. 1983;11:623–640. doi: 10.1007/BF01059061. [DOI] [PubMed] [Google Scholar]
- Lee U, Choi YH, Kim SH, Lee BK. Pharmacokinetics of itraconazole in diabetic rats. Antimicrob Agents Chemother. 2009;54:931–933. doi: 10.1128/AAC.01145-09. [DOI] [PMC free article] [PubMed] [Google Scholar]
- Lewis DFV. P450 Substrate specificity and metabolism. In: Lewis DFV, editor. Cytochromes P450 Structure, Function and Mechanism. Bristol: Taylor & Francis; 1996. p. 123. [Google Scholar]
- Lineweaver H, Burk D. The determination of enzyme dissociation constants. J Am Chem Soc. 1934;56:658–666. [Google Scholar]
- Penzak SR, Gubbins PO, Gurley BJ, Wang PL, Saccente M. Grapefruit decrease the systemic availability of itraconazole capsule in healthy volunteers. Ther Drug Monit. 1999;21:304–309. doi: 10.1097/00007691-199906000-00009. [DOI] [PubMed] [Google Scholar]
- Sagir A, Schmitt M, Dilger K, Häussinger D. Inhibition of cytochrome P450 3A: relevant drug interactions in gastroenterology. Digestion. 2003;68:41–48. doi: 10.1159/000073224. [DOI] [PubMed] [Google Scholar]
- Scheen AJ. Clinical pharmacokinetics of metformin. Clin Pharmacokinet. 1996;30:359–371. doi: 10.2165/00003088-199630050-00003. [DOI] [PubMed] [Google Scholar]
- Segel I. Enzyme Kinetics: Behavior and Analysis of Rapid Equilibrium and Steady- State Enzyme Systems. NewYork: Wiley; 1975. pp. 100–206. [Google Scholar]
- Shin JH, Choi KY, Kim YC, Lee MG. Dose-dependent pharmacokinetics of itraconazole after intravenous or oral administration to rats: intestinal first-pass effect. Antimicrob Agents Chemother. 2004;48:1756–1762. doi: 10.1128/AAC.48.5.1756-1762.2004. [DOI] [PMC free article] [PubMed] [Google Scholar]
- Song N-N, Li Q-S, Liu C-X. Intestinal permeability of metformin using single-pass intestinal perfusion in rats. World J Gastroenterol. 2006;12:4064–4070. doi: 10.3748/wjg.v12.i25.4064. [DOI] [PMC free article] [PubMed] [Google Scholar]
- Tan JS, Joseph WS. Common fungal infections of the feet in patients with diabetes mellitus. Drugs Aging. 2004;21:101–112. doi: 10.2165/00002512-200421020-00003. [DOI] [PubMed] [Google Scholar]
- Wang E-J, Lew K, Casciano CN, Clement RP, Johnson WW. Interaction of common azole antifungal with P-glycoprotein. Antimicrob Agents Chemother. 2002;46:160–165. doi: 10.1128/AAC.46.1.160-165.2002. [DOI] [PMC free article] [PubMed] [Google Scholar]
- Wilkinson GR, Shand DG. A physiological approach to hepatic drug clearance. Clin Pharmacol Ther. 1975;18:377–390. doi: 10.1002/cpt1975184377. [DOI] [PubMed] [Google Scholar]
- Yang KH, Lee JH, Lee MG. Effects of CYP inducers and inhibitors on the pharmacokinetics of intravenous theophylline in rats: involvement of CYP1A1/2 in the formation of 1,3-DMU. J Pharm Pharmacol. 2008;60:45–53. doi: 10.1211/jpp.60.1.0006. [DOI] [PubMed] [Google Scholar]
Associated Data
This section collects any data citations, data availability statements, or supplementary materials included in this article.