Abstract
Changes in the expression and activation status of Ras proteins are thought to contribute to the pathological phenotype of stromal fibroblast-like synoviocytes (FLS) in rheumatoid arthritis, a prototypical immune-mediated inflammatory disease. Broad inhibition of Ras and related proteins has shown protective effects in animal models of arthritis, but each of the Ras family homologues (ie, H-, K-, and N-Ras) makes distinct contributions to cellular activation. We examined the expression of each Ras protein in synovial tissue and FLS obtained from patients with rheumatoid arthritis and other forms of inflammatory arthritis. Each Ras protein was expressed in synovial tissue and cultured FLS. Each homolog was also activated following FLS stimulation with tumor necrosis factor-α or interleukin (IL)-1β. Constitutively active mutants of each Ras protein enhanced IL-1β-induced FLS matrix metalloproteinase-3 production, while only active H-Ras enhanced IL-8 production. Gene silencing demonstrated that each Ras protein contributed to IL-1β-dependent IL-6 production, while H-Ras and N-Ras supported IL-1β-dependent matrix metalloproteinase-3 and IL-8 production, respectively. The overlap in contributions of Ras homologues to FLS activation suggests that broad targeting of Ras GTPases in vivo suppresses global inflammation and joint destruction in arthritis. Consistent with this, simultaneous silencing of H-Ras, K-Ras, and N-Ras expression significantly reduces inflammation and joint destruction in murine collagen-induced arthritis, while specific targeting of N-Ras alone is less effective in providing clinical benefits.
Inflammation of affected joints in rheumatoid arthritis (RA) is characterized by infiltration of the synovial sublining by innate and adaptive immune cells, and intimal lining layer hyperplasia.1 Initial in situ and in vitro studies of invasive RA stromal fibroblast-like synoviocytes (FLS) revealed striking similarities with transformed cells expressing mutated proto-oncogene and tumor suppressor products.2 Hyperplastic FLS invading the joints of RA patients resemble proliferating tumor cells and in vitro, RA FLS proliferate more rapidly than FLS from inflammatory non-RA patients or healthy individuals.3 In analogy to transformed cells, RA FLS also spontaneously secrete autocrines and matrix metalloproteinases (MMPs), display anchorage-independent growth, and are resistant to contact inhibition of proliferation.4,5 While transforming mutations in gene products involved in cellular transformation, such as Ras and PTEN, have not been detected in RA FLS,6,7 it is appreciated that signaling pathways regulated by proto-oncogene and tumor suppressor gene products are constitutively activated due to stimulation by inflammatory cytokines, chemokines, growth factors, and oxidative stress in RA synovial tissue.8
Ras family GTPase homologues (H-, K-, and N-Ras) are expressed throughout mammalian tissue, and play essential roles in coupling extracellular stimuli to multiple downstream signaling pathways.9 Ras homologues share high sequence identity, especially in their effector domain, which directly couples GTPases to downstream signaling proteins. Under certain experimental conditions, Ras homologues can redundantly activate a shared set of signaling pathways, including mitogen-activated protein (MAP) kinase cascades, phosphoinositide 3-kinase (PI3K) and Ral GTPases. However, genetic and cell biology studies have provided strong evidence that each Ras homologue has distinct signaling properties. Specificity in Ras homolog signaling is conferred by differential subcellular localization of each homolog, differences in selectivity for downstream effector proteins, differential expression of Ras effectors in tissues, and utilization of specific guanine nucleotide exchange factors (GEFs) to activate Ras proteins.9,10
Previous studies have demonstrated that Ras family homologues are present in RA synovial tissue, and preferentially expressed in the intimal lining layer.11,12 Activation of Ras effector pathways, including MAP kinases, PI3K, and nuclear factor-κB, is enhanced in RA compared to disease controls.13,14,15 In RA synovial fluid T cells, constitutive activation of Ras proteins, in conjunction with inactivation of the related GTPase Rap1, contributes to persistent reactive oxygen species production by these cells.16 A role for deregulated H-Ras signaling in contributing to the aggressive phenotype of RA FLS has been suggested by the recent finding that Ras guanine nucleotide releasing factor 1 (RasGRF1), a GEF specific for H-Ras, is overexpressed in an activated form in these cells, contributing to spontaneous MMP-3 production.17 Conversely, ectopic expression of dominant-negative H-Ras suppresses interleukin (IL)1β–induced extra-cellular signal-regulated kinase (ERK) activation and IL-6 production in RA FLS.18 Dominant-negative c-Raf kinase, which broadly binds to and inhibits Ras homologues and related Ras family members, suppresses epidermal growth factor-induced ERK and c-jun N-terminal kinase (JNK) activation in RA FLS, and reduces constitutive expression of MMPs.19 Supporting this in vitro evidence that Ras protein signaling can contribute to pathogenic cellular behavior in RA, strategies which broadly inhibit the function of Ras and related protein in vivo are protective in animal models of arthritis.18,19,20 However, the involvement and requirement of specific Ras homologues in RA has not been examined. In this study, we find that H-Ras, K-Ras, and N-Ras are widely expressed in the synovium and FLS of patients with RA and other forms of inflammatory arthritis. Using ectopic expression of constitutively active Ras mutants and gene silencing strategies, we demonstrate that each Ras protein makes distinct but overlapping contributions to basal and IL-1β-induced FLS production of IL-6, IL-8, and MMP-3. These results suggest the potential suitability of therapeutic strategies broadly targeting Ras family function in RA, and we observe that combinatorial silencing of H-, K-, and N-Ras in vivo reduces disease severity and joint destruction in murine collagen-induced arthritis (CIA), while this protection is not observed when only N-Ras is targeted.
Materials and Methods
Patients and Synovial Tissue Samples
Synovial biopsy samples were obtained from an actively inflamed knee or ankle joint from two independent cohorts of patients by arthroscopy as previously described.21 Cohort I included 10 patients with RA, four with inflammatory osteoarthritis (OA), and seven with reactive arthritis, and characteristics of these patients have been previously described in detail.17 Cohort II included patients with RA (n = 20) and psoriatic arthritis (PsA) (n = 19). Patient characteristics of Cohort II are detailed in Table 1. All patients met established criteria for RA, inflammatory OA, reactive arthritis, and PsA, respectively.22,23,24,25 In particular, inflammatory OA patients fulfilled established criteria for OA at the time of arthroscopy and had a joint effusion in the absence of rheumatological disease other than OA. Written informed consent was provided by all patients before participation in the study, and the study was approved by the Medical Ethics Committee of the Academic Medical Center, University of Amsterdam, The Netherlands.
Table 1.
Characteristics of Study Patients
| Characteristic | RA (n = 20) | PsA (n = 19) |
|---|---|---|
| Age, years (range) | 52.0 (38–68) | 54.5 (35–70) |
| No. male/no. female | 11/9 | 8/11 |
| Disease durations, years (range) | 12.0 (3–44) | 12.5 (4–22) |
| Swollen joint count (range) | 12 (3–26) | 8 (1–32) |
| Tender joint count (range) | 8 (2–18) | 10 (2–48) |
| Number receiving MTX | 19 | 18 |
| Dosage MTX, mg/week* (range) | 15 (7.5–30) | 10 (2.5–20) |
| Number erosive/Number nonerosive | 14/5 | 7/12 |
| % RF positive | 85 | 0 |
| ESR, mg/hour (range) | 19 (4–101) | 29 (4–59) |
| CRP, mg/L (range) | 4 (1–98) | 11 (3–51) |
| DAS28 (range) | 6.0 (3.7–8.0) | 7.8 (3–12.6) |
RA = rheumatoid arthritis; PsA = psoriatic arthritis; MTX = methotrexate; No. = number; RF = rheumatoid factor; ESR = erythrocyte sedimentation rate; CRP = C-reactive protein; DAS28 = disease activity score 28. Unless indicated otherwise, values are expressed as the median (range).
Difference in values between RA and PsA patient cohorts is statistically significant (P < 0.05).
Immunohistochemical Analysis
Serial sections from six different biopsy samples per patient were cut with a cryostat (5 μm), fixed with acetone, and endogenous peroxidase activity was blocked with 0.3% hydrogen peroxide, and 0.1% sodium azide in PBS. Sections were stained overnight at 4°C with murine monoclonal antibodies recognizing Ras proteins (pan-Ras, Cell Signaling, Beverly, MA), H-Ras (F235), K-Ras (F234), and N-Ras (F155) (all from Santa Cruz Biotechnology, Santa Cruz, CA). For control sections, primary antibodies were omitted or irrelevant immunoglobulins were applied. Sections were then washed and incubated with goat anti-mouse horseradish peroxidase (HRP)-conjugated antibodies (from Dako, Glostrup, Denmark), followed by incubation with biotinylated tyramide and streptavidin-HRP, and development with amino-ethylcarbazole (Vector Laboratories, Buringame, CA).26 Sections were then counterstained with Mayer’s hematoxylin (Perkin Elmer Life Sciences, Boston, MA) and mounted in Kaiser’s glycerol gelatin (Merck, Darmstadt, Germany) for analysis.
Immunohistochemical Double Staining
To detect potential cell-specific expression of Ras homologues in RA synovial tissue, tissue sections were incubated with anti-Ras antibodies overnight at 4°C, followed by incubation with goat anti-mouse-HRP. Sections were then labeled for one hour at room temperature with fluorescein isothiocyanate-conjugated antibodies to detect T lymphocytes (anti-CD3, clone SK7, Beconton Dickinson, San Jose, CA), FLS (anti-CD55, mAB67, Serotec, Oxford, UK), and macrophages (anti-CD68, clone DK25, Dako), followed by rabbit anti-fluorescein isothiocyanate antibodies (Dako) and swine anti-rabbit Ig-alkaline phosphatase (AP) conjugate (Dako) for 30 minutes each. HRP staining was developed as above, and AP staining was visualized using an AP Substrate III kit (SK-5300, Vector Laboratories) according to the manufacturer’s instructions.
Digital Image Analysis
Stained slides were randomly coded by an observer blinded to antibodies used and clinical diagnosis, and analyzed by computer-assisted image analysis using the Qwin analysis system (Leica, Cambridge, UK) as previously described in detail.27 Values of integrated optical density/mm2 were obtained for both the intimal lining layer and the synovial sublining, and corrected for total number of nucleated cells/mm2.
Cell Culture
The human Jurkat T cell leukemia line, RA FLS, and PsA FLS were cultured as previously described.16,28 FLS were isolated from patient synovial biopsy samples by enzymatic digestion. FLS were cultured in Dulbecco’s modified Eagle’s medium (Gibco-BRL, Paisley, Scotland, UK) containing 10% fetal calf serum, 2 mmol/L l-glutamine, 100 U/ml penicillin, and 100 μg/ml streptomycin (all from Invitrogen, Breda, The Netherlands). Experiments were conducted using fourth to ninth passage FLS, and all experiments were conducted with FLS plated in 6-well tissue culture dishes.
Immunoblotting
Jurkat and RA FLS cell lines were lysed in Laemli’s 1× sample buffer, and the cellular extracts were resolved by electrophoresis on NuPage 4 to 12% Bis-Tris gradient gels (Invitrogen, Verviers, Belgium). Proteins were then transferred to polyvinylidene fluoride membranes (Invitrogen), followed by blocking of membranes with 1% milk (BioRad, Hercules, CA) in Tris-buffered saline, pH 8.0 containing 0.05% Tween-20 (BioRad). Membranes were then incubated overnight at 4°C with primary antibodies in Tris-buffered saline, pH 8.0 containing 0.05% Tween-20. Primary antibodies used in these studies included anti-Ras antibodies (as described above), and antibodies recognizing actin, phospho (p)-p38, p-ERK, p-JNK (all from Santa Cruz Biotechnology), tubulin (Sigma Aldrich, St. Louis, MO), p38, ERK, JNK, p-protein kinase B (PKB) and PKB (all from Cell Signaling Technology, Danvers, MA). Immunoblots were developed with secondary HRP-conjugated antibodies (BioRad) and enhanced chemiluminescence (Pierce, Rockford, IL). For quantitative analysis of protein expression, chemiluminescence was detected using a LAS3000 according to the manufacturer’s instructions, and quantified using Aida software version 3.44, normalized to expression of tubulin.
Detection of Activated Ras Proteins
To measure Ras activation in FLS, cells were serum-starved overnight, and then stimulated in the absence or presence of tumor necrosis factor (TNF)-α, IL-1β, or phorbol 12-myristate 13-acetate/ionomycin for 5 minutes. Cells were washed in cold PBS, lysed, and active GTP-bound Ras proteins were precipitated using c-Raf-Ras binding domain (RBD) immobilized on glutathione-agarose beads as previously described.16 Bound Ras proteins were eluted with Laemmli’s sample buffer and subjected to gel electrophoresis and immunoblotting as above.
Quantitative Measurement of Ras Homolog mRNA
RNA from samples was obtained using Trizol reagent according to the manufacturer’s instructions (Invitrogen). cDNA was then synthesized using oligodT primer and SuperScriptII enzyme (Invitrogen). Quantitative (q)PCR was performed using a Lightcycler 480 as instructed by the manufacturer (Roche, Woerden, The Netherlands). Sequences of primers used for qPCR were: H-Ras forward, 5’-TTTGAGGACATCCACCAGTACA-3’; H-Ras reverse, 5’-GCCGAGATTCCACAGTGC-3’; K-Ras forward, 5’-TGTTCACAAAGGTTTTGTCTCC-3’; K-Ras reverse, 5’-CCTTATAATAGTTTCCATTGCCTTG-3’; N-Ras forward, 5’-CAGAGGCAGTGGAGCTTGA-3’; N-Ras reverse, 5-’GCTTTTCCCAACACCACCT-3’; hATPase 6 Uprobe 23 forward, 5-’CATAATGACCCACCAATCACA-3’; hATPase 6 Uprobe 23 reverse, 5-’GAGAGGGCCCCTGTTAGG-3’ (Roche). qPCR reactions for each sample were performed in quadruplicate and values corrected using control hATPase 6 to calibrate.
Locked Nucleic Acid Synthesis
Locked nucleic acid (LNA) oligonucleotides were synthesized by Santaris Pharma A/S (Hørsholm, Denmark) using β-D-LNA monomers (Santaris Pharma A/S). Oligonucleotides were synthesized with complete phosphorothioate backbones using the phosphoramidite approach29 on an ÄKTA Oligopilot (GE Health care) and polystyrene primer support. LNA were purified by ion exchange, desalted, characterized by liquid chromatography/mass spectrometry (Agilent), and the molecular mass of LNA verified by matrix-assisted laser desorption ionization time-of-flight mass spectrometry on a Biflex III MALDI (Brucker Instruments, Leipzig, Germany). The oligonucleotide sequences of LNA used in this study were as follows (underlined, LNA; C, methylcytosine): H-Ras, 5′-TCCGTCATCGCTCCTC-3′; K-Ras, 5′-CACAAGTTTATATTCAGT-3′; N-RaS, 5′-GGATTGTCAGTGCGC-3′; scrambled, 5′-ACTAGCTATACTAGCTAT-3′; pan-Ras, 5’-CATGGCACTGTACTCCT-3′.
Cell Transfection and Gene Silencing
Jurkat cells were transfected by electroporation (250 V, 950 μF) with 40 μg empty pEF-BOS vector, or empty vector plus increasing quantities (3, 10, and 30 μg) of pEF-BOS encoding H-Ras, K-Ras, or N-Ras (kindly provided by Dr. R. Mareis, ICRF, London, UK). Jurkat cells were harvested and lysed 48 hours post-transfection. RA FLS transfection was performed using 5 μg empty pEF-BOS plasmid or plasmid encoding active Ras homologs, using 12.5 μl Lipofectamine 2000 transfection reagent (Invitrogen). Twenty-four hours post-transfection, medium was replaced with Dulbecco’s modified Eagle’s medium containing 1% fetal calf serum, and cells cultured for 24 hours in the absence or presence of additional stimuli before analysis of cells and culture supernatants. LNA transductions were performed in six-well culture plates using increasing concentrations of LNA (up to 50 nmol/L) mixed with Lipofectamine 2000 and serum-free Dulbecco’s modified Eagle’s medium, as per the manufacturer’s instructions. After overnight incubation, transduction medium was replaced with fresh Dulbecco’s modified Eagle’s medium containing 1% fetal calf serum.
Cytokine and MMP-3 Measurement
Transfected and transduced RA FLS were cultured 24 hours in the absence or presence of 10 ng/ml IL-1β and cell-free supernatants were collected. Enzyme-linked immunosorbent assay (ELISA) kits for IL-6, IL-8 (both from Sanquin Reagents, Amsterdam, The Netherlands), and MMP-3 (R&D Systems Europe, Ltd., Abingdon, UK) were used according to the manufacturers’ directions.
Animals, Induction, and Assessment of CIA
C57BL/6 mice (Harlan, Horst, The Netherlands) were housed under conventional conditions and fed ad libitum. All animal experiments were approved by the animal ethical committee of the Academic Medical Center, University of Amsterdam. Mice (8 to 11 weeks of age) were immunized with chicken collagen type II (cCII, Chondrex, Inc., Redmond, WA), dissolved at 2 mg/ml in 0.05 mol/L acetic acid by gently stirring overnight at 4°C, mixed with complete Freund’s adjuvant (2 mg/ml of Mycobacterium tuberculosis, Chondrex, Inc.). The immunization was performed by intradermal injection at the base of the tail on Day 0 using a 100 μl emulsion containing 100 μg cCII and 250 μg complete Freund’s adjuvant. Starting on Day 14, mice were randomly assigned to one of four groups (n = 8 per group), and treated intraperitoneally with 1 or 4 mg/kg/day with control or pan-Ras LNA. On Day 21, mice received a repeat immunization with cCII in complete Freund’s adjuvant. Mice were monitored three times per week in a blinded manner for clinical signs of arthritis, using a semiquantitative scoring system (0 to 4): 0, normal; 1, redness and/or swelling in one joint; 2, redness and/or swelling in more than one joint; 3, redness and/or swelling in the entire paw; and 4, deformity and/or ankylosis. Hind paw ankle thickness was measured using a dial caliper (POCO 2T 0- to 10-mm test gauge; Kroeplin Längenmesstechnik, Schlüchtern, Germany). In a second experiment, mice were treated as above, using 4 mg/kg control, pan-Ras, or N-Ras LNA (n = 10 mice per group).
Detection of Murine Synovial Ras Expression by in Situ Hybridization
In situ hybridization for Ras homologues in murine synovial tissue was performed using 5′-fluorescein-labeled 19mer antisense oligonucleotides containing LNA and 2′-O-methyl-RNA moieties. We designed LNA/2′-O-methyl probes (synthesized by Ribotask ApS, Odense, Denmark) for use in this study (underlined, LNA; lowercase, 2′-O-methyl-RNA), each targeting a unique sequence of H-Ras (5′-fluorescein-TcaCccGcuTgaTcuGcuC-3′), KRas (5′-fluorescein-TcaAuuAcuAcuTguTucC-3′), or N-Ras (5′-fluorescein-TcuTucAcaCgcTuaAuuT-3′). Hybridizations were performed on 6 μmol/L sections of paraffin-embedded material. Sections were deparaffinized and boiled in 10 mmol/L citrate (pH 6) for 10 minutes. Hybridizations were then done at 60°C for 1 hour in 50% (v/v) deionized formamide, 600 mmol/L NaCl, 10 mmol/L HEPES buffer (pH 7.5), 1 mmol/L EDTA, 5× Denhardt’s reagent and 200 mg/ml herring sperm DNA (Sigma), using 100 nmol/L oligonucleotide. After hybridization, tissue sections were washed consecutively for 5 minutes each in 2×, 0.5×, and 0.2× standard saline citrate at 60°C. Hybridized oligonucleotides were detected by incubation for 1 hour with a 1:500 dilution of AP-labeled anti-5′-fluorescein FAB fragments (Roche) and visualization using Vector Alkaline Phosphatase Substrate kit III (Vector) and nuclear fast red counterstaining. Intensity of staining was quantified using digital imaging analyses as above and expressed as integrated optical density/mm2.
Histological and Radiological Analyses
Hind paws were fixed in 10% buffered formalin for 48 hours, decalcified in 15% EDTA, and then embedded in paraffin. Sagittal serial sections of the paws (5 μm) were stained with hematoxylin and eosin, or safranin O, as previously described.30 Inflammation was graded on a scale from 0 (no inflammation) to 3 (severely inflamed joint) based on infiltration of the synovium by inflammatory cells. Cartilage erosion was scored using a semiquantitative scoring system from 0 (no erosions) to 3 (extended erosions). Two observers without knowledge of the treatment groups scored viewed X-rays and scored joint destruction based on a scale from 0 to 4: 0, no damage; 1, minor bone destruction observed in one enlightened spot; 2, moderate changes, two to four spots in one area; 3, severe erosions afflicting the joint; and 4, complete destruction of the joints.
Determination of Anti-Collagen Antibodies by ELISA
Maxisorb 96-well plates (Nunc, Roskilde, Denmark) were coated with 5 μg/ml bovine collagen type II (bCII) in 0.1 mol/L sodium carbonate buffer (pH 9.7) overnight at 4°C. Plates were then blocked for 1 hour with 2% milk in PBS at room temperature. Mouse sera were added in serial dilutions in 2% milk/PBS, and incubated overnight at 4°C, followed by washing and incubation with 1 μg/ml biotinylated rat anti-mouse IgG1 or IgG2a (Southern Biotechnology Associates, Birmingham, AL) in 2% milk/PBS for 1 hour at room temperature. After washing, plates were incubated with streptavidin-conjugated AP (Jackson ImmunoResearch, Newmarket, Suffolk, UK) for 1 hour at room temperature, washed, developed with p-nitrophenyl phosphate substrate (Sigma-Aldrich, St Louis, MO), and the reaction quenched with 2 mol/L H2SO4. The resulting optical density was measured at 415 nm.
Statistical Analyses
Wilcoxon’s nonparametric signed ranks test was used to compare protein expression between intimal lining layer and the synovial sublining layer within diagnostic groups. The Mann-Whitney U-test was used for the comparison of Ras homolog expression between diagnostic groups. Correlations between mRNA and protein expression were assessed using Spearman’s rank correlation coefficient. ELISA results were examined using Student’s t-test. In murine arthritis experiments, the change in clinical arthritis scores for each mouse following booster immunization was determined and the areas under the curve calculated. The significance of the differences between the means of delta paw swelling, radiological, and histological scores between groups was determined by using the unpaired Student’s t-test. P values ≤0.05 were considered statistically significant.
Results
Immunoreactivity of Ras Antibodies
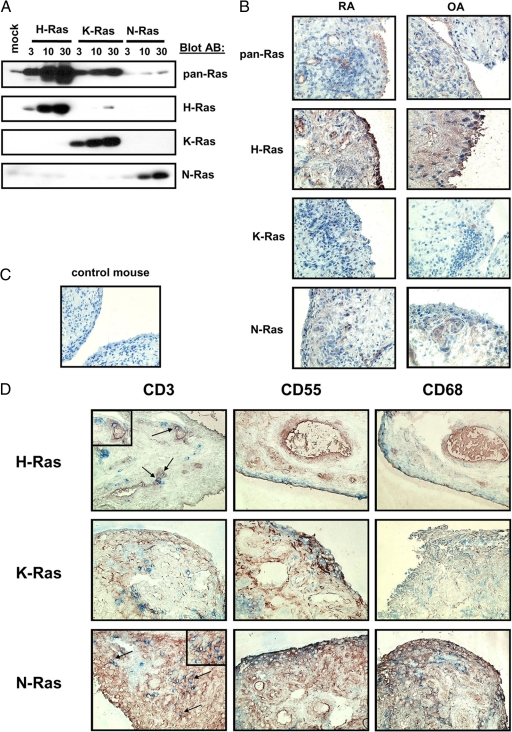
Previous studies of Ras protein expression in RA synovial tissue have been limited to semiquantitative analysis of positive staining cells using pan-Ras antibodies which do not discriminate between Ras homologues.11,12 To gain more insight into which Ras homologues were recognized by the pan-Ras antibody, we transfected Jurkat T cells with increasing amounts of cDNA encoding H-, K-, or N-Ras (Figure 1A). Immunoblotting of lysates demonstrated that the pan-Ras monoclonal antibody recognized primarily H- and K-Ras. Of importance, immunoblotting with monoclonal antibodies specific for H-, K-, and N-Ras validated the specificity of these antibodies. We next qualitatively addressed the question of Ras signaling protein expression levels in RA synovial tissue. Consistent with previous studies,12 pan-Ras antibodies weakly but specifically stained RA synovial tissue (Figure 1B). Each of the signaling proteins examined, H-Ras, K-Ras, and N-Ras, were expressed in both RA and inflammatory OA synovial tissue (Figure 1B). In contrast, no staining was observed with negative control antibodies (Figure 1C). Qualitative double labeling of RA synovial tissue with antibodies recognizing Ras homologues and markers for T lymphocytes (CD3), FLS (CD55), and macrophages (CD68) (Figure 1D) revealed that H-Ras and N-Ras were detected in all cell types studied. K-Ras expression was more restricted, detectable only in FLS and macrophages.
Figure 1.
Ras family homologues are expressed in the synovial tissues of patients with inflammatory arthritis. A: Jurkat cells were transfected with control cDNA (mock) or increasing concentrations (μg) of cDNA encoding active H-, K-, and N-RasV12 cDNA as indicated. The specificity of pan-Ras and homologue-specific Ras antibodies was examined by immunoblotting of cell lysates. B: Expression of Ras proteins in synovial tissue sections of patients with RA and inflammatory OA was examined with pan-, H-, K-, and N-Ras antibodies by immunohistochemistry (n = 5, a representative picture is shown for each staining). Original magnification, ×100. C: RA patient synovial tissue was stained by immunohistochemistry with control mouse IgG. Original magnification, ×100. D: Ras homologues are widely expressed in synovial tissue cells. Immunohistochemical double staining was performed on RA synovial tissue sections to detect T lymphocytes (CD3), FLS (CD55), and macrophages (CD68) (blue) expressing H-Ras, K-Ras, and N-Ras (red). Arrows indicate CD3+ T lymphocytes displaying staining for Ras proteins. Original magnification, ×100; ×400 (Inset).
Ras Homolog Expression Patterns in RA and Non-RA Synovial Tissue
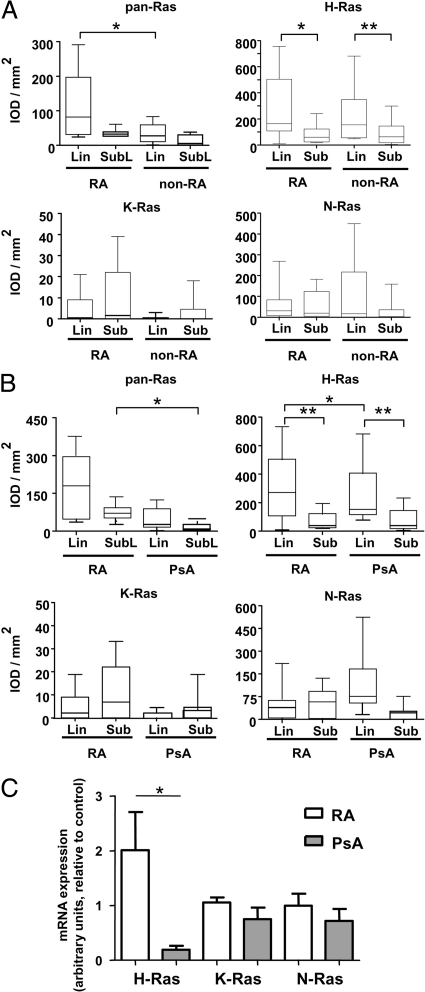
No differences were noted in pan-Ras antibody staining between RA synovial sublining and intimal lining layers. However, staining in the synovial sublining of RA patients was significantly higher than that observed in non-RA (inflammatory OA and reactive arthritis) patients (P < 0.05) (Figure 2A). H-Ras expression was significantly enhanced in the intimal lining layer of both RA (P < 0.01) and non-RA (P < 0.005) as compared to synovial sublining tissue. No differences in expression of H-, K-, or N-Ras were observed between diagnostic groups. We also examined reactivity of pan-Ras–specific and Ras homolog–specific antibodies in a second cohort of 20 RA and 19 PsA patients (Figure 2B). Again, pan-Ras antibody staining in RA synovial sublining tissue was significantly enhanced (P < 0.05). In this cohort, H-Ras expression was also significantly higher in the intimal lining layer of RA and PsA patients (P < 0.01) than in the synovial sublining layer, and H-Ras expression in this synovial region was elevated in RA compared to PsA (P < 0.05). No differences between diagnostic groups or synovial intimal lining and sublining layers were noted for N-Ras or K-Ras expression. We also measured synovial Ras homolog mRNA expression in an available subset of RA and PsA patients (n = 5 each) analyzed above by immunohistochemistry in Figure 2B. Consistent with immunohistochemistry experiments, mRNA expression of H-Ras (P < 0.05), but not K-Ras or N-Ras, was elevated in RA compared to PsA (Figure 2C).
Figure 2.
Ras homologues are expressed at similar levels in the synovial tissue of patients with RA and other forms of inflammatory arthritis. Quantitative analysis of immunoreactivity of pan-Ras, H-Ras, K-Ras, and N-Ras antibodies in the synovial lining (Lin) and sublining (Sub) of patients as determined by immunohistochemistry and digital imaging. A: Ras antibody reactivity in patients with RA (n = 10) and non-RA inflammatory arthritis (inflammatory OA, n = 4; reactive arthritis, n = 7). B: Ras antibody reactivity in patients with RA (n = 20) and PsA (n = 19). Data are expressed as the integrated optical density/mm2 (arbitrary units). Box plots represent the 25th to 75th percentiles, the lines within each box the median, and lines outside the boxes designate the 10th and 90th percentiles. C: q-PCR analysis of H-Ras, K-Ras, and N-Ras expression in RA (white bar, n = 5) and PsA (gray bar, n = 5) synovial tissue normalized to hATPase 6 expression. Data are expressed in arbitrary units as the mean and SEM. *P < 0.05, **P < 0.01.
Expression of Ras Homologues in FLS
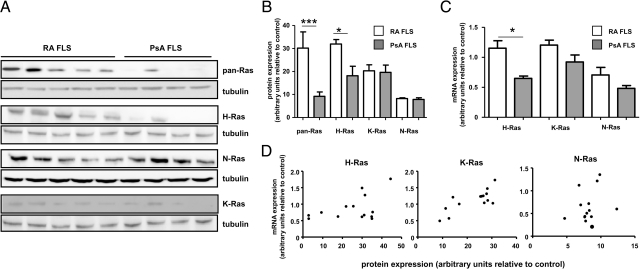
To gain more insight into the potential participation of each Ras homolog in FLS activation, we first verified in vivo evidence of FLS H-, K-, and N-Ras protein expression in vitro. Immunoblotting of RA and PsA cell lysates revealed that each of the proteins could also be detected, albeit at highly variable levels, in both RA and PsA FLS lines (Figure 3A). Similar variability in protein expression was observed in additional RA and PsA FLS lines (n = 4, each) (data not shown). Quantitative analysis of Ras homolog expression in RA (n = 9) and PsA (n = 4) FLS lines demonstrated significantly enhanced immunoreactivity of pan-Ras (P < 0.005) and H-Ras (P < 0.05) antibodies in RA FLS (Figure 3B). Real-time PCR performed on mRNA available from the same RA and PsA FLS lines also revealed enhanced H-Ras expression in RA FLS (P < 0.05) (Figure 3C). Protein and mRNA expression correlated strongly within FLS lines for H-Ras (r = 0.462, P < 0.05) and K-Ras (r = 0.666, P < 0.01), but not N-Ras (r = 0.270, P = 0.35) (Figure 3D), possibly reflecting the relatively low and more uniform distribution of N-Ras protein expression (Figure 3B).
Figure 3.
Each of the three Ras homologues is expressed in RA and PsA FLS. A: RA (n = 5) and PsA (n = 4) FLS lysates were analyzed by immunoblotting with antibodies recognizing pan-Ras, H-Ras, K-Ras, N-Ras, and tubulin proteins. Replicate samples were run on a separate gel for analysis of immunoreactivity with each Ras antibody, and tubulin expression the same blot examined as a loading control. B: Quantitative analysis of Ras homolog expression in RA FLS (white bars, n = 9) and PsA FLS (gray bars, n = 4) lines, normalized to tubulin expression. Data are expressed in arbitrary units as the mean and SEM C: q-PCR analysis of H-Ras, K-Ras, and N-Ras expression in RA (white bar, n = 9) and PsA (gray bar, n = 4) FLS lines normalized to hATPase 6 expression. Data are expressed in arbitrary units as the mean and SEM FLS lines are same as those assessed for protein in B. D: Relationship between Ras homolog mRNA expression and protein expression in RA FLS (n = 9) and PsA FLS (n = 4) lines. *P < 0.05, ***P < 0.005.
Ras Homologues Participate in the Inflammatory Activation of RA FLS and Support Cytokine and MMP Production
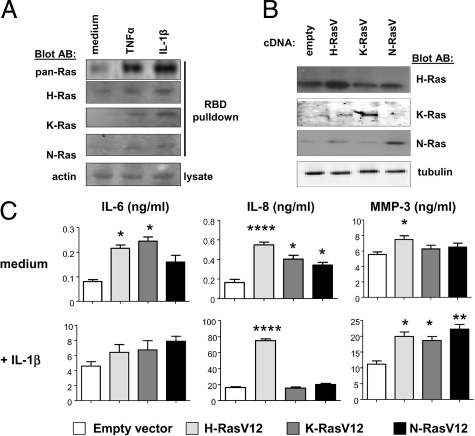
We next examined if the Ras homologues expressed in RA FLS participated in the inflammatory activation of these cells. RA FLS were left unstimulated, or stimulated with TNF-α or IL-1β. Active Ras proteins were precipitated from cell lysates and detected by immunoblotting with specific antibodies (Figure 4A). Cytokine-dependent activation of Ras proteins was readily detected with pan-Ras antibodies. Use of homolog-specific antibodies demonstrated that H-Ras, K-Ras, and N-Ras were each activated following cytokine stimulation. In unstimulated FLS, active H-Ras was most easily detected.
Figure 4.
Each of the Ras homologues responds to RA FLS stimulation and contributes to inflammatory parameters of FLS activation. A: GTP-bound Ras proteins were precipitated with Raf-Ras binding domain protein from lysates of RA FLS treated for 5 minutes with medium alone, TNF-α, or IL-1β. Activated proteins were detected by immunoblotting of precipitates with pan-Ras, H-Ras, K-Ras, and N-Ras antibodies. Immunoblotting with actin antibodies was performed on whole cell lysates. Results are representative of experiments performed on three independent RA FLS lines. B: RA FLS were transfected with empty control vector or vector encoding active H-Ras, K-Ras, and N-Ras V12 mutants. Immunoblotting of lysates of transfected cells was performed with antibodies recognizing H-Ras, K-Ras, N-Ras, and tubulin. C: Tissue culture supernatants of transfected RA FLS lines (n = 5), in the absence (medium) or presence of overnight IL-1β stimulation, were analyzed by ELISA for IL-6, IL-8, and MMP-3 content. *P < 0.05, **P < 0.01, ****P < 0.0001.
Given that each of the Ras homologues could be activated in FLS, we determined whether H-, K-, and N-Ras might make specific contributions to FLS activation. RA FLS were transfected with control vector, or vector encoding active mutants of H-Ras, K-Ras, and N-Ras. Enhanced expression of each of the transfected Ras homologues could be detected in RA FLS lysates by immunoblotting (Figure 4B). Analysis of tissue culture supernatants (Figure 4C, upper panels) revealed that active mutants of either H-Ras or K-Ras enhanced basal production of IL-6 by FLS (H-Ras, 260.09% of control, P < 0.05; K-Ras, 299.45%, P < 0.05). Each of the active Ras mutants also increased basal IL-8 production (H-Ras, 331.82%, P < 0.0005; K-Ras, 244%, P < 0.05; N-Ras, 206.65%, P < 0.05). In contrast, only H-Ras stimulated basal MMP-3 production (134.9%, P < 0.05). When transfected RA FLS were stimulated with IL-1β (Figure 4C, lower panels) IL-6 production was robustly increased, but no cooperative or additive effects were observed by ectopic expression of active Ras mutants. However, H-Ras (421.9%, P < 0.0005) further enhanced IL-1β-induced IL-8 production. Each of the active Ras mutants also enhanced IL-1β-induced MMP-3 secretion (H-Ras, 178.32%, P < 0.05; K-Ras, 166.35%, P < 0.05; N-Ras, 198.5%, P < 0.005).
Effects of Ras Homolog Gene Silencing on RA FLS Cytokine and MMP Production
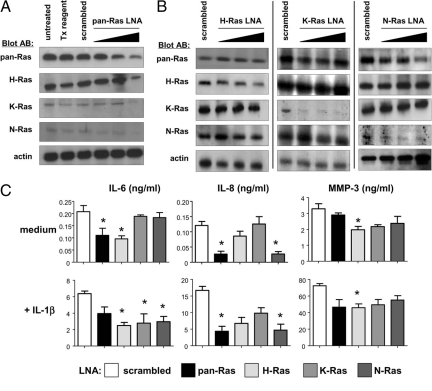
Our studies with active Ras mutants suggested that each of the Ras homologues was sufficient to stimulate FLS secretion of one or more cytokines or MMPs, but did not indicate whether or not there was requisite participation of the Ras proteins in IL-6, IL-8, and MMP-3 production. To address this, we transduced RA FLS with increasing concentrations of control scrambled LNA, and pan-Ras LNA. Treatment of cells with pan-Ras LNA resulted in a specific dose-dependent reduction in expression of each of the three Ras homologues (Figure 5A). Treatment of cells with homolog-specific Ras LNAs resulted in selective suppression of H-, K-, and N-Ras (Figure 5B). In three of five experiments, H-Ras knockdown was complete, while in two other experiments, expression was reduced by approximately 70%. Treatment of FLS with 50 nmol/L H-Ras LNA did result in slight reductions in K- and N-Ras expression, but as this higher concentration of LNA was required for efficient H-Ras knockdown, all further experiments were performed with 50 nmol/L control and Ras LNAs.
Figure 5.
Ras homologues make redundant contributions to FLS activation. A: Pan-Ras LNA suppresses expression of H-Ras, K-Ras, and N-Ras. RA FLS were left untreated, exposed to transfection (Tx) reagent alone, or transfected with control scrambled LNA (50 nmol/L) or increasing concentrations (5, 10, and 50 nmol/L) pan-Ras LNA. B: RA FLS were transfected with control scrambled LNA (50 nmol/L) or increasing concentrations (5, 10, and 50 nmol/L) H-Ras (left column), K-Ras (middle column), or N-Ras (right column) LNA. Whole cell lysates of transfected cells were analyzed by immunoblotting with antibodies recognizing pan-Ras, H-Ras, K-Ras, N-Ras, and actin proteins. Each column represents results from one of at least three independent transfection experiments. C: Ras homologues make differential, but overlapping contributions to basal and IL-1β-induced cytokine production. RA FLS lines (n = 5) transfected with scrambled control, pan-Ras, H-Ras, K-Ras, and N-Ras LNA (50 nmol/L each) were incubated overnight in medium alone or medium containing IL-1β. Tissue culture supernatants were analyzed for IL-6, IL-8, and MMP-3 content by ELISA. *P < 0.05.
Although active forms of each of the Ras proteins could enhance basal IL-6 and IL-8 production (Figure 4C) only pan-Ras and H-Ras LNA signficantly reduced IL-6 production (Figure 5C). In contrast, N-Ras expression was required to support basal IL-8 production. Significant reductions in basal MMP-3 production were observed only in the presence of H-Ras LNA, consistent with our previous observations that RA FLS MMP-3 production is regulated by the H-Ras-specific GEF RasGRF1.17 In the presence of IL-1β, suppression of H-Ras resulted in significant decreases in the production of IL-6 (61.07% inhibition) and MMP-3 (37.52%) (P < 0.05). These values may underestimate the requirement for H-Ras as complete silencing of H-Ras was not observed in all experiments. K-Ras knockdown only influenced IL-1β-dependent IL-6 production (52.19% decrease, P < 0.05). N-Ras LNA inhibited IL-1β-dependent production of both IL-6 (54.51%) (P < 0.05) and IL-8 (71.62%) (P < 0.05).
Ras Homologues Activate Overlapping Downstream Signaling Pathways in RA FLS
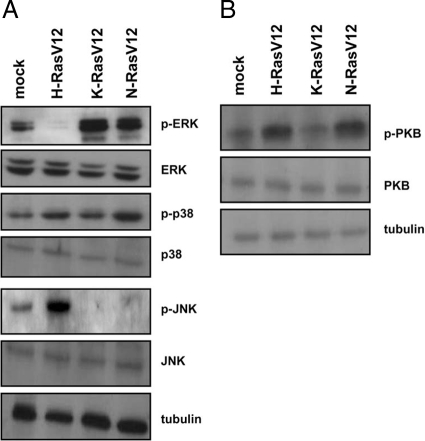
To gain a better understanding of the molecular mechanisms by which Ras homologues redundantly regulated FLS activation, we monitored activation of candidate downstream signaling pathways in lysates of RA FLS transfected with active Ras proteins by immunoblotting. Basal ERK MAP kinase activation was suppressed by H-RasV12, but enhanced by K-RasV12 and N-RasV12 (Figure 6A). p38 MAP kinase phosphorylation was modestly enhanced by both H-RasV12 and N-RasV12. In contrast, JNK MAP kinase phosphorylation was stimulated only by H-RasV12. We also examined PI3-kinase–dependent phosphorylation of PKB (Figure 6B), and observed PKB activation in the presence of both active H-Ras and N-Ras. Together, these data provide a molecular explanation regarding the redundant capacity of Ras homologues to enhance FLS activation as, with the exception of JNK, which is selectively targeted by H-Ras, each of the downstream pathways examined could be regulated by two different Ras homologues.
Figure 6.
Active Ras homologues activate overlapping downstream signaling pathways in RA FLS. RA FLS were transfected with empty control vector or vector encoding active H-Ras, K-Ras, and N-Ras V12 mutants. A: Immunoblotting of lysates of transfected cells was performed with antibodies recognizing p-ERK, ERK, p-p38, p38, p-JNK, JNK, and tubulin. B: Immunoblotting of lysates of transfected cells with p-PKB, PKB, and tubulin antibodies. Replicate sets of lysates were loaded on gels, and then immunoblots were cut and probed independently with antibodies. Experiments are representative of at least three independent transfection experiments.
Pan-Ras LNA Reduces Disease Severity in Murine CIA
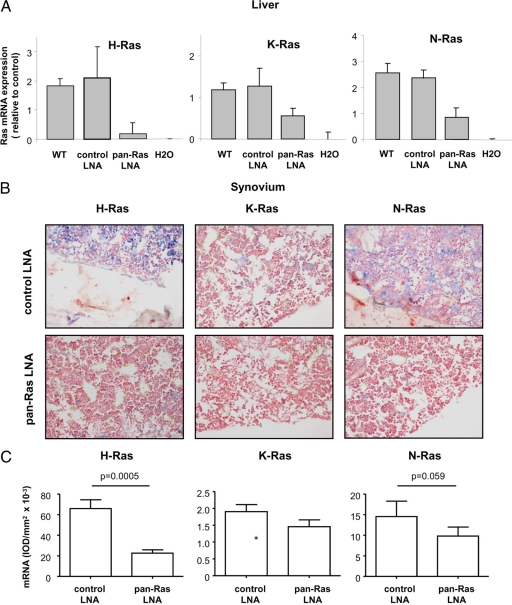
As our in vitro studies indicated distinct but highly overlapping contributions of Ras homologues to the inflammatory activation of RA FLS, we examined the influence of pan-Ras LNA treatment on CIA in mice. C57BL/6 mice were immunized with chicken collagen type II (cCII) in complete Freund’s adjuvant, and the immunization was repeated on Day 21. Starting on Day 14, mice were treated with control or pan-Ras LNA (1 or 4 mg/kg/day). At the time of animal sacrifice on Day 43, mRNA was isolated from the livers of mice to monitor the efficiency of Ras homolog knockdown (Figure 7A). Sacrifice occurred 48 hours following the last treatment of mice with LNA. H-Ras, K-Ras, and N-Ras mRNA levels in mice treated with control LNA did not differ significantly from untreated control mice. In contrast, H-Ras mRNA levels were suppressed by approximately 90% in pan-Ras LNA–treated mice, and significant but more modest decreases in K-Ras and N-Ras mRNA expression were observed. As anti-Ras antibodies could not recognize murine synovial Ras proteins following antigen-retrieval of tissue sections, we used in situ hybridization to monitor Ras mRNA expression in synovial tissue (Figure 7B). Digital image analysis of stained tissues revealed that, as in the liver, synovial H-Ras expression was most sensitive to pan-Ras LNA treatment (Figure 7C). Negligible decreases in K-Ras expression were observed. N-Ras expression was decreased by approximately 33%, but this did not reach statistical significance.
Figure 7.
Pan-Ras LNA broadly suppresses Ras expression in mice during CIA. A: mRNA expression of H-Ras, K-Ras, and N-Ras was measured by q-PCR in livers of healthy untreated wild-type (WT) mice, and arthritic mice treated with 1 mg/kg scrambled control and pan-Ras LNA. Data were normalized relative to hATPase 6 expression. B: Synovial expression of Ras homolog mRNA in mice treated with control scrambled and pan-Ras LNA was detected by in situ hybridization. Representative photomicrographs of stainings with H-Ras, K-Ras, and N-Ras probes. Original magnification, ×200. C: Quantitative analysis of synovial H-, K-, and N-Ras expression in arthritic mice treated with control (white bars, n = 8) and pan-Ras (gray bars, n = 8) LNA. Data are expressed as the integrated optical density/mm2 and bars represent the mean and SEM. P values are indicated.
Compared to control LNA, pan-Ras LNA had no influence on disease incidence following induction of CIA (Figure 8A and data not shown). Mean clinical scores of mice in each group were not significantly different on any single day during the experiment (Figure 8A and data not shown), but over the course of the experiment, as assessed by measuring the area under the curve, administration of pan-Ras LNA significantly reduced disease severity during the course of the experiment (P < 0.005) (Figure 8B). Increasing the dose of pan-Ras LNA to 4 mg/kg had no further significant effect on disease severity. Effects of 1 mg/kg pan-Ras LNA on paw swelling were more modest, and only transient in nature, occurring between Day 25 and Day 32 (P < 0.05) (Figure 8C).
Figure 8.
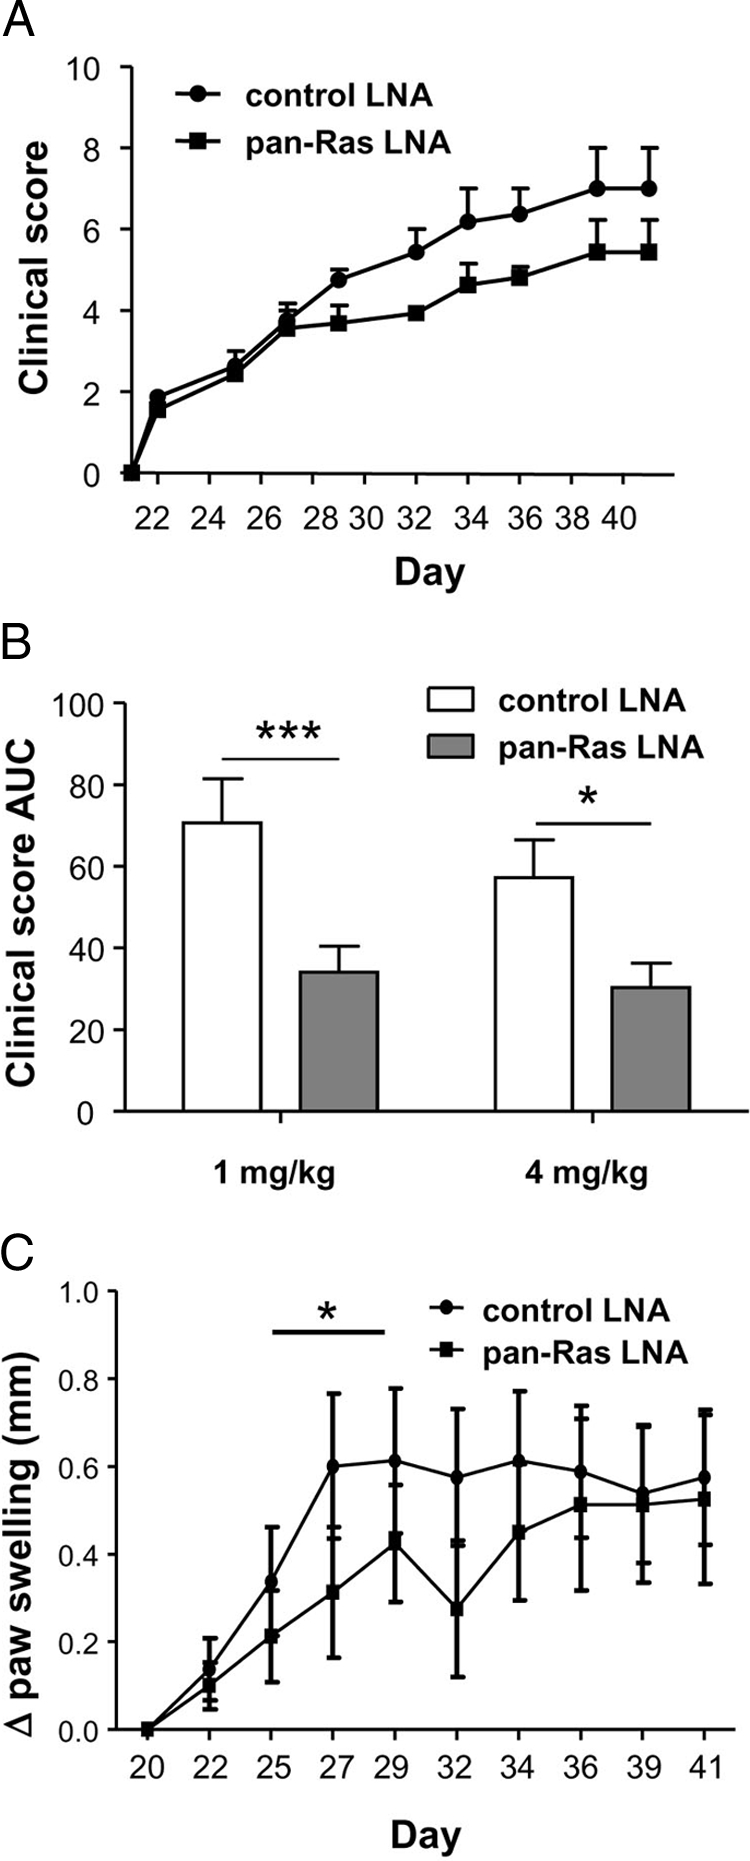
Pan-Ras LNA decreases disease severity and paw swelling in murine CIA. A: Clinical disease severity scores of mice treated with 1 mg/kg control and pan-Ras LNA (n = 8 per group) on the indicated days of the experiment. B: Disease severity expressed as the area under the curve (AUC) for the course of the experiment, from Day 21 to animal sacrifice. C: Paw joint swelling in mice was measured using a caliper and data expressed as the change in paw thickness (Δ paw swelling) relative to paw size at the induction of arthritis. All data are displayed as the mean and SEM. *P < 0.05, ***P < 0.005.
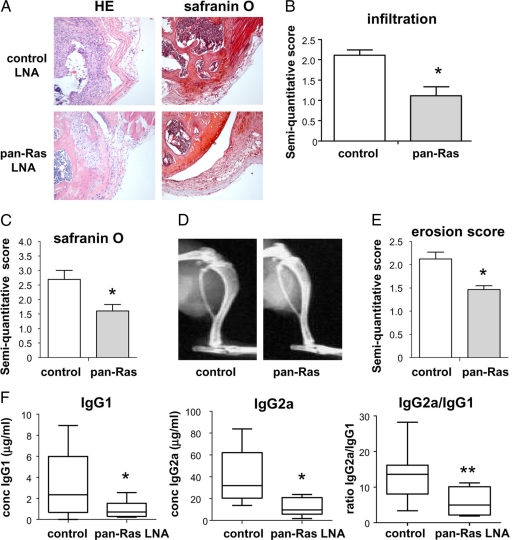
Further histological and radiological analyses were performed on mice treated with 1 mg/kg control or pan-Ras LNA. Pan-Ras LNA treatment resulted in decreased synovial infiltration (P < 0.05) (Figure 9, A and B) and cartilage destruction (P < 0.05) (Figure 9, A and C) as evidenced by H&E and safranin O staining, respectively. Similar partial protection against erosive bone disease was also provided by pan-Ras LNA (Figure 9, D and E). Finally, mice treated with pan-Ras LNA displayed significant reductions in serum levels of anti-bCII IgG1 (28.5% of control; P < 0.05) and IgG2a (30.7% of control; P < 0.005) antibodies (Figure 9F). The ratio of anti-bCII IgG2a to anti-bCII IgG1 was also severely reduced in mice treated with pan-Ras LNA (P < 0.01), indicating that suppression of Ras signaling interfered with antibody isotype class switching (Figure 9F).
Figure 9.
Pan-Ras LNA decrease synovial infiltration, cartilage destruction, and bone erosion in CIA. A: Knee joints of arthritic mice treated with scrambled control LNA and pan-Ras LNA were stained with H&E and safranin O. B: Synovial infiltration in mice was assessed by semiquantitative scoring of H&E-stained tissue sections. C: Cartilage destruction in mice was assessed by semiquantitative scoring of safranin O-stained tissue sections. D: X-rays were obtained from paws of mice treated with scrambled control LNA and pan-Ras LNA. E: Bone erosions were assessed by semiquantitative scoring of radiographs. F: Serum was obtained from arthritic mice and the concentration of anti-bovine collagen type II (anti-bCII) immunoglobulins (Ig) G1 and G2a, as well as the ratio of anti-bCII IgG2a to anti-bCII IgG1 concentrations, was determined by ELISA. Box plots represent the 25th to 75th percentiles, the lines within each box the median, and lines outside the boxes designate the 10th and 90th percentiles. *P < 0.05, **P < 0.01.
Specific Targeting of N-Ras Displays Clinical Efficacy in CIA
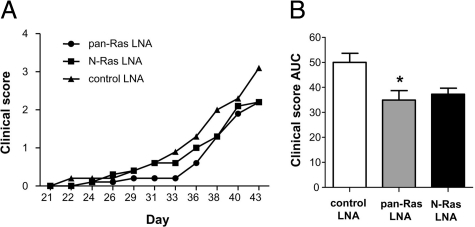
In situ hybridization analysis of arthritic mice treated with pan-Ras LNA suggested that changes in H-Ras expression were most closely associated with the protective effects of pan-Ras LNA (Figure 7C). However, a trend toward reduced synovial N-Ras was observed, and we noted a substantial decrease in serum levels of anti-bCII autoantibodies, suggesting that pan-Ras LNA may be selectively targeting adaptive immune responses. As deficiencies in adaptive immune responses have been observed in mice lacking N-Ras, but not H-Ras, we directly compared the clinical benefits of treating mice with pan-Ras and N-Ras-specific LNA during CIA.31,32 Treatment of mice with 4 mg/kg pan-Ras LNA reproducibly suppressed disease severity in mice compared to control LNA (P < 0.05) (Figure 10, A and B). However, while a trend in reduced disease severity in mice treated with N-Ras LNA, this did not reach statistical significance over the course of the study (P = 0.493). Together, our data suggest that broad targeting of Ras family homologues may offer clinical advantages over strategies aimed to inhibit specific Ras homologues.
Figure 10.
N-Ras LNA fails to protect against pathology in murine CIA. A: Clinical disease severity scores of mice treated with 4 mg/kg control, pan-Ras, and N-Ras LNA (n = 10 per group) on the indicated days of the experiment. B: Disease severity expressed as the area under the curve (AUC) for the course of the experiment, from day 21 to animal sacrifice. *P < 0.05.
Discussion
Recent advances have provided us with an unparalleled ability to design and develop highly selective pharmacological inhibitors which distinguish between closely related proteins. A prototypical example of this is the identification of compounds which specifically inhibit distinct isoforms of PI3K catalytic subunits, allowing the selective targeting of isoforms primarily involved in inflammatory immune cell trafficking and activation.33 However, the design of compounds and their clinical application in the treatment of RA and other diseases can outpace our understanding of the specific biological and pathological contributions of their targets. This is observed in recent clinical trials involving the treatment of RA patients with inhibitors of p38 MAPK, which have reported a disappointing lack of clinical efficacy.34,35 One possible contributing factor to this may be that while the compounds used in these trials targeted primarily p38α, ongoing fundamental studies have demonstrated prominent activation of not only p38α in RA synovial tissue, but p38δ as well.36
Ras proteins represent a newly emerging set of targets in the treatment of chronic inflammatory diseases, playing a central role in coupling the ligation of antigen, cytokine, growth factor, and TNF family receptors to cellular responses of gene regulation, proliferation and survival. Receptor-dependent activation of GEFs converts Ras proteins to their GTP-bound form, allowing interaction with and signaling to downstream effector pathways, such as MAPK cascades, PI3K, and other small GTPases.37 In RA, enhanced expression and or activation of Ras proteins has been proposed to cooperate with other proto-oncogene products, such as c-Myc, to promote FLS activation and proliferation.19 Although a small number of in vivo experiments have suggested a therapeutic potential in targeting Ras proteins, a lack of knowledge about the contributions of specific Ras homologues to RA currently precludes hypothesis-based development and application of compounds. Initial characterizations using a monoclonal antibody recognizing H- and K-Ras reported expression of Ras proteins in the intimal lining layer and vasculature of RA, but not OA, synovial tissue.11 An independent study using a distinct pan-Ras antibody observed weak expression of Ras throughout the synovium in RA and other forms of inflammatory arthritis, which was lower than that observed in OA.12 In our study, a pan-Ras antibody primarily recognizing H- and K-Ras, and to a lesser extent N-Ras, displays quantitatively enhanced immunoreactivity in the synovial sublining of RA patients compared to non-RA patients. Discrepancies between these three studies can likely be attributed to variation in the cross-reactivity of pan-Ras antibodies used. Using homolog-specific antibodies, we find that H-Ras is most readily detectable in synovial tissue, at significantly higher levels in the intimal lining layer than in the synovial sublining layer, in both RA and non-RA patients. H-Ras and N-Ras are widely expressed in all cell types studied (T cells, macrophages, and FLS), while weak K-Ras expression is restricted to macrophages and FLS. Of the Ras homologues, we could only detect differences in H-Ras expression between patient cohorts, limited to the intimal lining layers of RA and PsA synovial tissue. This finding was recapitulated in protein and mRNA expression analyses of FLS derived from RA and PsA synovial tissue. In the absence of activating stimuli, overexpression of small GTPases generally has a neutral effect on cellular activation. Thus, the repertoire of inflammatory stimuli in synovial tissue, or changes in the functional expression of Ras regulatory proteins, rather than differential expression of Ras homologues, are more likely to determine involvement of Ras proteins in inflammatory arthritis. However, enhanced expression of H-Ras in RA FLS could further sensitize these cells to autonomous activation, as RasGRF1, an H-Ras-specific GEF, is overexpressed in an activated form in the same cell population.17
Specificity in Ras protein signaling is achieved at several levels.37 First, although widely expressed, different homologues are enriched in specific tissues. For example, we detect primarily H-Ras and N-Ras in synovial T lymphocytes. Even within FLS lines established from different RA and PsA patients, we note wide variation in the expression of each Ras homologue. Whether this is maintained in vivo, and whether the in vitro variation is a consequence in the differentiation status of the FLS, prior inflammatory pressures in vivo, or epigenetic mechanisms is currently unknown. A second level of specificity is obtained by differential expression and utilization of GEFs which activate Ras proteins. Some GEFs, such as RasGRF1, demonstrate fine specificity for activation of H-Ras.38 We have previously found that RasGRF1 is overexpressed in RA synovial tissue, in an active form, and that this protein is sufficient and required for constitutive MMP-3 production by RA FLS.17 Consistent with this, we observed in this study that only H-Ras, but not other Ras homologues, can regulate basal MMP-3 secretion in RA FLS. Other Ras GEFs, such as Sos (son of sevenless), can activate each of the Ras homologues, and we observe that both TNF-α and IL-1β efficiently activate H-, K-, and N-Ras in RA FLS. A third variable which will affect the cellular output of Ras signaling is the array of potential downstream effectors expressed in a given cell type.9 In a given cell type, H-, K-, and N-Ras each display different efficiencies in activating downstream effector pathways (c-Raf, PI3K and Rac pathways) and cellular functions (focus formation, anchorage-independent growth, and cell migration).39,40,41 Finally, cells may express one or more related downstream effectors, such as c-Raf, B-Raf, and Raf-A, or the α, β, γ, and δ isoforms of the PI3K catalytic subunit, which in turn differentially interact with a given Ras homolog.42 In our analyses of Ras function in RA FLS, we can clearly detect overlapping capacities of Ras homologues to activate downstream MAP kinase and PI3-kinase signaling pathways. An exception to this is JNK activation, which was only stimulated by H-Ras.
The cellular consequences of these redundancies in Ras signaling are also evident in our analyses of the effects of Ras activation and silencing on RA FLS. While activation of any of the Ras homologues is sufficient to enhance IL-1β-induced MMP-3 production, only H-Ras cooperates with IL-1β to produce IL-8. In contrast, while each of the Ras homolgues participates in IL-1β signaling and contributes to optimal IL-6 production, only N-Ras is required for IL-8 synthesis, and H-Ras for MMP-3. Retroviral introduction of dominant-negative H-Ras to the joints of rats reduces clinical disease severity and radiological damage in the adjuvant-induced model of RA.18 However, our analyses of RA synovial tissue and RA FLS indicate that due to redundancies in Ras signaling in RA, clinically beneficial strategies may need to broadly target Ras family members. Previous studies have shown that transfection of RA FLS with DN c-Raf slows their invasiveness following implantation into SCID mice.19 Additionally, farnesylation inhibitors, which disrupt post-translational modifications of Ras family members needed for protein function, suppress IL-1β and TNF-α -induced activation of RA FLS in vitro, and are protective in CIA.20,43 However, it is unclear if inhibition of Ras family proteins was responsible for clinical benefits observed in these studies. For example, DN c-Raf can also bind to other Ras-related proteins, including R-Ras and the Rap1 family members, each of which make unique contributions to cellular biology.44 Farnesylation inhibitors, in turn, will target not only Ras homologues, but all G protein-coupled receptors, such as chemokine receptors, as well.45 Here, we provide direct evidence that specific silencing of Ras family homolog expression provides protective effects in experimental arthritis, a strategy which may be further explored using gene therapy and pharmacological approaches. Our studies support the idea that targeting of specific Ras homologues may not be necessary to achieve clinical effects, and specific functions of each Ras homolog cannot be clearly identified in RA FLS. Specific silencing of N-Ras alone in vivo failed to protect against pathology in CIA, but future studies directly comparing specific silencing of each Ras homolog, both in terms of clinical effects and cellular consequences for immune and stromal activation will provide further insight into the potential benefits of targeting these signaling proteins in RA.
Footnotes
Address reprint requests to Dr. Kris A. Reedquist, Ph.D., Division of Clinical Immunology and Rheumatology, Academic Medical Center, University of Amsterdam, Room K0-140, Meibergdreef 9, 1105 AZ Amsterdam, The Netherlands. E-mail: k.a.reedquist@amc.uva.nl.
Supported by a Dutch Arthritis Association project grant (NR 04-1-301) to K.A.R.
References
- Tak PP, Smeets TJ, Daha MR, Kluin PM, Meijers KA, Brand R, Meinders AE, Breedveld FC. Analysis of the synovial cell infiltrate in early rheumatoid synovial tissue in relation to local disease activity. Arthritis Rheum. 1997;40:217–225. doi: 10.1002/art.1780400206. [DOI] [PubMed] [Google Scholar]
- Tak PP, Zvaifler NJ, Green DR, Firestein GS. Rheumatoid arthritis and p53: how oxidative stress might alter the course of inflammatory diseases. Immunol Today. 2000;21:78–82. doi: 10.1016/s0167-5699(99)01552-2. [DOI] [PubMed] [Google Scholar]
- Fassbender HG. Histomorphological basis of articular cartilage destruction in rheumatoid arthritis. Coll Relat Res. 1983;3:141–155. doi: 10.1016/s0174-173x(83)80040-5. [DOI] [PubMed] [Google Scholar]
- Lafyatis R, Remmers EF, Roberts AB, Yocum DE, Sporn MB, Wilder RL. Anchorage-independent growth of synoviocytes from arthritic and normal joints. Stimulation by exogenous platelet-derived growth factor and inhibition by transforming growth factor-beta and retinoids. J Clin Invest. 1989;83:1267–1276. doi: 10.1172/JCI114011. [DOI] [PMC free article] [PubMed] [Google Scholar]
- Huber LC, Distler O, Tarner I, Gay RE, Gay S, Pap T. Synovial fibroblasts: key players in rheumatoid arthritis. Rheumatology (Oxford) 2006;45:669–675. doi: 10.1093/rheumatology/kel065. [DOI] [PubMed] [Google Scholar]
- Roivainen A, Zhu F, Sipola E, Yli-Jama T, Toivanen P. Failure to verify H-ras mutations in arthritic synovium: comment on the article by Roivainen et al. Arthritis Rheum. 2001;44:2705. doi: 10.1002/1529-0131(200111)44:11<2705::aid-art452>3.0.co;2-5. [DOI] [PubMed] [Google Scholar]
- Pap T, Franz JK, Hummel KM, Jeisy E, Gay R, Gay S. Activation of synovial fibroblasts in rheumatoid arthritis: lack of expression of the tumour suppressor PTEN at sites of invasive growth and destruction. Arthritis Res. 2000;2:59–64. doi: 10.1186/ar69. [DOI] [PMC free article] [PubMed] [Google Scholar]
- Tas SW, Remans PH, Reedquist KA, Tak PP. Signal transduction pathways and transcription factors as therapeutic targets in inflammatory disease: towards innovative antirheumatic therapy. Curr Pharm Des. 2005;11:581–611. doi: 10.2174/1381612053381918. [DOI] [PubMed] [Google Scholar]
- Hancock JF. Ras proteins: different signals from different locations. Nat Rev Mol Cell Biol. 2003;4:373–384. doi: 10.1038/nrm1105. [DOI] [PubMed] [Google Scholar]
- Raaijmakers JH, Bos JL. Specificity in Ras and Rap signaling. J Biol Chem. 2009;284:10995–10999. doi: 10.1074/jbc.R800061200. [DOI] [PMC free article] [PubMed] [Google Scholar]
- Trabandt A, Aicher WK, Gay RE, Sukhatme VP, Nilson-Hamilton M, Hamilton RT, McGhee JR, Fassbender HG, Gay S. Expression of the collagenolytic and Ras-induced cysteine proteinase cathepsin L and proliferation-associated oncogenes in synovial cells of MRL/I mice and patients with rheumatoid arthritis. Matrix. 1990;10:349–361. doi: 10.1016/s0934-8832(11)80142-3. [DOI] [PubMed] [Google Scholar]
- Roivainen A, Soderstrom KO, Pirila L, Aro H, Kortekangas P, Merilahti-Palo R, Yli-Jama T, Toivanen A, Toivanen P. Oncoprotein expression in human synovial tissue: an immunohistochemical study of different types of arthritis. Br J Rheumatol. 1996;35:933–942. doi: 10.1093/rheumatology/35.10.933. [DOI] [PubMed] [Google Scholar]
- Tak PP, Firestein GS. NF-kappaB: a key role in inflammatory diseases. J Clin Invest. 2001;107:7–11. doi: 10.1172/JCI11830. [DOI] [PMC free article] [PubMed] [Google Scholar]
- Schett G, Tohidast-Akrad M, Smolen JS, Schmid BJ, Steiner CW, Bitzan P, Zenz P, Redlich K, Xu Q, Steiner G. Activation, differential localization, and regulation of the stress-activated protein kinases, extracellular signal-regulated kinase, c-JUN N-terminal kinase, and p38 mitogen-activated protein kinase, in synovial tissue and cells in rheumatoid arthritis. Arthritis Rheum. 2000;43:2501–2512. doi: 10.1002/1529-0131(200011)43:11<2501::AID-ANR18>3.0.CO;2-K. [DOI] [PubMed] [Google Scholar]
- Zhang HG, Wang Y, Xie JF, Liang X, Liu D, Yang P, Hsu HC, Ray RB, Mountz JD. Regulation of tumor necrosis factor alpha-mediated apoptosis of rheumatoid arthritis synovial fibroblasts by the protein kinase Akt. Arthritis Rheum. 2001;44:1555–1567. doi: 10.1002/1529-0131(200107)44:7<1555::AID-ART279>3.0.CO;2-M. [DOI] [PubMed] [Google Scholar]
- Remans PH, Gringhuis SI, van Laar JM, Sanders ME, Papendrecht-van der Voort EA, Zwartkruis FJ, Levarht EW, Rosas M, Coffer PJ, Breedveld FC, Bos JL, Tak PP, Verweij CL, Reedquist KA. Rap1 signaling is required for suppression of Ras-generated reactive oxygen species and protection against oxidative stress in T lymphocytes. J Immunol. 2004;173:920–931. doi: 10.4049/jimmunol.173.2.920. [DOI] [PubMed] [Google Scholar]
- Abreu JR, de LD, Sanders ME, Grabiec AM, van de Sande MG, Tak PP, Reedquist KA. The Ras guanine nucleotide exchange factor RasGRF1 promotes matrix metalloproteinase-3 production in rheumatoid arthritis synovial tissue. Arthritis Res Ther. 2009;11:R121. doi: 10.1186/ar2785. [DOI] [PMC free article] [PubMed] [Google Scholar]
- Yamamoto A, Fukuda A, Seto H, Miyazaki T, Kadono Y, Sawada Y, Nakamura I, Katagiri H, Asano T, Tanaka Y, Oda H, Nakamura K, Tanaka S. Suppression of arthritic bone destruction by adenovirus-mediated dominant-negative Ras gene transfer to synoviocytes and osteoclasts. Arthritis Rheum. 2003;48:2682–2692. doi: 10.1002/art.11214. [DOI] [PubMed] [Google Scholar]
- Pap T, Nawrath M, Heinrich J, Bosse M, Baier A, Hummel KM, Petrow P, Kuchen S, Michel BA, Gay RE, Muller-Ladner U, Moelling K, Gay S. Cooperation of Ras- and c-Myc-dependent pathways in regulating the growth and invasiveness of synovial fibroblasts in rheumatoid arthritis. Arthritis Rheum. 2004;50:2794–2802. doi: 10.1002/art.20461. [DOI] [PubMed] [Google Scholar]
- Na HJ, Lee SJ, Kang YC, Cho YL, Nam WD, Kim PK, Ha KS, Chung HT, Lee H, Kwon YG, Koh JS, Kim YM. Inhibition of farnesyltransferase prevents collagen-induced arthritis by down-regulation of inflammatory gene expression through suppression of p21(ras)-dependent NF-kappaB activation. J Immunol. 2004;173:1276–1283. doi: 10.4049/jimmunol.173.2.1276. [DOI] [PubMed] [Google Scholar]
- Kraan MC, Reece RJ, Smeets TJ, Veale DJ, Emery P, Tak PP. Comparison of synovial tissues from the knee joints and the small joints of rheumatoid arthritis patients: implications for pathogenesis and evaluation of treatment. Arthritis Rheum. 2002;46:2034–2038. doi: 10.1002/art.10556. [DOI] [PubMed] [Google Scholar]
- Arnett FC, Edworthy SM, Bloch DA, McShane DJ, Fries JF, Cooper NS, Healey LA, Kaplan SR, Liang MH, Luthra HS, The American Rheumatism Association 1987 revised criteria for the classification of rheumatoid arthritis. Arthritis Rheum. 1988;31:315–324. doi: 10.1002/art.1780310302. [DOI] [PubMed] [Google Scholar]
- Altman R, Asch E, Bloch D, Bole G, Borenstein D, Brandt K, Christy W, Cooke TD, Greenwald R, Hochberg M. Development of criteria for the classification and reporting of osteoarthritis. Classification of osteoarthritis of the knee. Diagnostic and Therapeutic Criteria Committee of the American Rheumatism Association. Arthritis Rheum. 1986;29:1039–1049. doi: 10.1002/art.1780290816. [DOI] [PubMed] [Google Scholar]
- Inman RD. Classification criteria for reactive arthritis. J Rheumatol. 1999;26:1219–1221. [PubMed] [Google Scholar]
- Taylor W, Gladman D, Helliwell P, Marchesoni A, Mease P, Mielants H. Classification criteria for psoriatic arthritis: development of new criteria from a large international study. Arthritis Rheum. 2006;54:2665–2673. doi: 10.1002/art.21972. [DOI] [PubMed] [Google Scholar]
- Tak PP, van der Lubbe PA, Cauli A, Daha MR, Smeets TJ, Kluin PM, Meinders AE, Yanni G, Panayi GS, Breedveld FC. Reduction of synovial inflammation after anti-CD4 monoclonal antibody treatment in early rheumatoid arthritis. Arthritis Rheum. 1995;38:1457–1465. doi: 10.1002/art.1780381012. [DOI] [PubMed] [Google Scholar]
- Haringman JJ, Vinkenoog M, Gerlag DM, Smeets TJ, Zwinderman AH, Tak PP. Reliability of computerized image analysis for the evaluation of serial synovial biopsies in randomized controlled trials in rheumatoid arthritis. Arthritis Res Ther. 2005;7:R862–R867. doi: 10.1186/ar1757. [DOI] [PMC free article] [PubMed] [Google Scholar]
- Kasperkovitz PV, Verbeet NL, Smeets TJ, van Rietschoten JG, Kraan MC, van der Pouw Kraan TC, Tak PP, Verweij CL. Activation of the STAT1 pathway in rheumatoid arthritis. Ann Rheum Dis. 2004;63:233–239. doi: 10.1136/ard.2003.013276. [DOI] [PMC free article] [PubMed] [Google Scholar]
- Ravikumar VT, Wyrzykiewicz TK, Cole DL. Synthesis of oligonucleotides via phosphoramidite approach utilizing 2-diphenylmethylsilylethyl (Dpse) as a phosphorus protecting group. Tetrahedron. 1994;50:9255–9266. [Google Scholar]
- van Holten J, Reedquist K, Sattonet-Roche P, Smeets TJ, Plater-Zyberk C, Vervoordeldonk MJ, Tak PP. Treatment with recombinant interferon-beta reduces inflammation and slows cartilage destruction in the collagen-induced arthritis model of rheumatoid arthritis. Arthritis Res Ther. 2004;6:R239–R249. doi: 10.1186/ar1165. [DOI] [PMC free article] [PubMed] [Google Scholar]
- Perez de Castro I, Diaz R, Malumbres M, Hernandez MI, Jagirdar J, Jimenez M, Ahn D, Pellicer A. Mice deficient for N-ras: impaired antiviral immune response and T-cell function. Cancer Res. 2003;63:1615–1622. [PubMed] [Google Scholar]
- Castellano E, De Las RJ, Guerrero C, Santos E. Transcriptional networks of knockout cell lines identify functional specificities of H-Ras and N-Ras: significant involvement of N-Ras in biotic and defense responses. Oncogene. 2007;26:917–933. doi: 10.1038/sj.onc.1209845. [DOI] [PubMed] [Google Scholar]
- Camps M, Ruckle T, Ji H, Ardissone V, Rintelen F, Shaw J, Ferrandi C, Chabert C, Gillieron C, Francon B, Martin T, Gretener D, Perrin D, Leroy D, Vitte PA, Hirsch E, Wymann MP, Cirillo R, Schwarz MK, Rommel C. Blockade of PI3Kgamma suppresses joint inflammation and damage in mouse models of rheumatoid arthritis. Nat Med. 2005;11:936–943. doi: 10.1038/nm1284. [DOI] [PubMed] [Google Scholar]
- Cohen SB, Cheng TT, Chindalore V, Damjanov N, Burgos-Vargas R, Delora P, Zimany K, Travers H, Caulfield JP. Evaluation of the efficacy and safety of pamapimod, a p38 MAP kinase inhibitor, in a double-blind, methotrexate-controlled study of patients with active rheumatoid arthritis. Arthritis Rheum. 2009;60:335–344. doi: 10.1002/art.24266. [DOI] [PubMed] [Google Scholar]
- Damjanov N, Kauffman RS, Spencer-Green GT. Efficacy, pharmacodynamics, and safety of VX-702, a novel p38 MAPK inhibitor, in rheumatoid arthritis: results of two randomized, double-blind, placebo-controlled clinical studies. Arthritis Rheum. 2009;60:1232–1241. doi: 10.1002/art.24485. [DOI] [PubMed] [Google Scholar]
- Korb A, Tohidast-Akrad M, Cetin E, Axmann R, Smolen J, Schett G. Differential tissue expression and activation of p38 MAPK alpha, beta, gamma, and delta isoforms in rheumatoid arthritis. Arthritis Rheum. 2006;54:2745–2756. doi: 10.1002/art.22080. [DOI] [PubMed] [Google Scholar]
- Karnoub AE, Weinberg RA. Ras oncogenes: split personalities. Nat Rev Mol Cell Biol. 2008;9:517–531. doi: 10.1038/nrm2438. [DOI] [PMC free article] [PubMed] [Google Scholar]
- Jones MK, Jackson JH. Ras-GRF activates Ha-Ras, but not N-Ras or K-Ras 4B, protein in vivo. J Biol Chem. 1998;273:1782–1787. doi: 10.1074/jbc.273.3.1782. [DOI] [PubMed] [Google Scholar]
- Voice JK, Klemke RL, Le A, Jackson JH. Four human ras homologs differ in their abilities to activate Raf-1, induce transformation, and stimulate cell motility. J Biol Chem. 1999;274:17164–17170. doi: 10.1074/jbc.274.24.17164. [DOI] [PubMed] [Google Scholar]
- Walsh AB, Bar-Sagi D. Differential activation of the Rac pathway by Ha-Ras and K-Ras. J Biol Chem. 2001;276:15609–15615. doi: 10.1074/jbc.M010573200. [DOI] [PubMed] [Google Scholar]
- Yan J, Roy S, Apolloni A, Lane A, Hancock JF. Ras isoforms vary in their ability to activate Raf-1 and phosphoinositide 3-kinase. J Biol Chem. 1998;273:24052–24056. doi: 10.1074/jbc.273.37.24052. [DOI] [PubMed] [Google Scholar]
- Weber CK, Slupsky JR, Herrmann C, Schuler M, Rapp UR, Block C. Mitogenic signaling of Ras is regulated by differential interaction with Raf isozymes. Oncogene. 2000;19:169–176. doi: 10.1038/sj.onc.1203261. [DOI] [PubMed] [Google Scholar]
- Abeles AM, Marjanovic N, Park J, Attur M, Chan ES, Al-Mussawir HE, Dave M, Fisher MC, Stuchin SA, Abramson SB, Pillinger MH. Protein isoprenylation regulates secretion of matrix metalloproteinase 1 from rheumatoid synovial fibroblasts: effects of statins and farnesyl and geranylgeranyl transferase inhibitors. Arthritis Rheum. 2007;56:2840–2853. doi: 10.1002/art.22824. [DOI] [PubMed] [Google Scholar]
- Herrmann C, Horn G, Spaargaren M, Wittinghofer A. Differential interaction of the ras family GTP-binding proteins H-Ras. Rap1A, and R-Ras with the putative effector molecules Raf kinase and Ral-guanine nucleotide exchange factor. J Biol Chem. 1996;271:6794–6800. doi: 10.1074/jbc.271.12.6794. [DOI] [PubMed] [Google Scholar]
- Konstantinopoulos PA, Karamouzis MV, Papavassiliou AG. Post-translational modifications and regulation of the RAS superfamily of GTPases as anticancer targets. Nat Rev Drug Discov. 2007;6:541–555. doi: 10.1038/nrd2221. [DOI] [PubMed] [Google Scholar]


