Abstract
When plants become shaded by neighbouring plants, they perceive a decrease in the red/far-red (R/FR) ratio of the light environment, which provides an early and unambiguous warning of the presence of competing vegetation. The mechanistic bases of the natural genetic variation in response to shade signals remain largely unknown. This study demonstrates that a wide range of genetic variation for hypocotyl elongation in response to an FR pulse at the end of day (EOD), a light signal that simulates natural shade, exists between Arabidopsis accessions. A quantitative trait locus (QTL) mapping analysis was done in the Bayreuth×Shahdara recombinant inbred line population. EODINDEX1 is the most significant QTL identified in response to EOD. The Shahdara alleles at EODINDEX1 caused a reduced response to shade as a consequence of an impaired hypocotyl inhibition under white light, and an accelerated leaf movement rhythm, which correlated positively with the pattern of circadian expression of clock genes such as PRR7 and PRR9. Genetic and quantitative complementation analyses demonstrated that ELF3 is the most likely candidate gene underlying natural variation at EODINDEX1. In conclusion, ELF3 is proposed as a component of the shade avoidance signalling pathway responsible for the phenotypic differences between Arabidopsis populations in relation to adaptation in a changing light environment.
Keywords: Arabidopsis thaliana, early flowering 3 (ELF3), end of the day far-red light (EOD), natural genetic variation, quantitative trait locus (QTL), shade avoidance syndrome (SAS)
Introduction
Plants growing in stands with increasing vegetation are exposed to a reduction in the red to far-red (R/FR) ratio of the incoming light, caused by the enrichment of FR light reflected by neighbouring plants. With increasing plant density, plants also experience a significant reduction of photosynthetically active radiation (PAR), resulting from the depletion of red and blue light absorbed by leaves. Changes in the R/FR ratio are finely sensed primarily by phyB and secondarily by phyD and phyE, and the changes in blue light photons of PAR are sensed by cryptochromes and phototropins (Devlin et al., 1998, 1999; Pierik et al., 2004). All these photoreceptors act coordinately to trigger important adaptive responses known collectively as the shade avoidance syndrome (SAS). The SAS includes increased growth rate of stems and petioles and an acceleration of flowering that enables plants to anticipate light competition by neighbouring plants (Franklin, 2008).
A significant progress in the understanding of SAS molecular mechanisms has been achieved in the last decade through the analysis of mutants with impaired shade avoidance responses. In plants subject to a low R/FR ratio, the active form of phyB (Pfr) is converted to the inactive form (Pr) and exits the nucleus. The reduction of phyB Pfr increases the nuclear abundance of PIF4 and PIF5, two proteins that interact with the Pfr form of the phytochromes, enhancing the expression of genes involved in elongation growth (Nozue et al., 2007; Lorrain et al., 2008). Furthermore, recent studies suggest that gibberellin (GA) and phytochrome signalling pathways converge to regulate elongation growth (de Lucas et al., 2008; Feng et al., 2008). In plants exposed to a low R/FR ratio or to a depletion of blue light, the promotion of hypocotyl and petiole growth is partially accounted for by the degradation of DELLAs, a family of growth-repressing proteins acting in the GA signalling pathway (Djakovic-Petrovic et al., 2007).
Although induced mutagenesis continues to be an important approach for gene discovery (Ostergaard and Yanofsky, 2004), the study of the molecular bases of natural variation has an enormous potential to overcome several limitations of mutagenesis, such as no obvious phenotypic variation, unstable phenotypes, narrow genetic background, and a limited range of phenotypic variation (Tonsor et al., 2004). The analysis of important life history traits such as seed dormancy and flowering time led to the cloning of some genes responsible for the natural variation of these traits (Johanson et al., 2000; Michaels and Amasino, 2000; Sheldon et al., 2000; Bentsink et al., 2006). Albeit phyB is the primary phytochrome mediating SAS (Nagatani et al., 1991; Somers et al., 1991), and numerous allelic polymorphisms exist in its amino acid sequence (Filiault et al., 2008), the molecular bases underlying phenotypic variation in shade avoidance responses in natural populations remain largely ignored.
A huge natural genetic variation has been reported in SAS. Studying the hypocotyl growth and flowering time responses to shade in >100 accessions of Arabidopis thaliana, Botto and Smith (2002) found that both physiological responses induced by the same FR signal are not correlated, suggesting that shade avoidance signalling pathways have evolved separately. More recently, Adams et al. (2009) demonstrated that the insensitivity of flowering time in the Bla-6 accession to a low R/FR ratio is due to the high expression level of the floral repressor FLOWERING LOCUS C (FLC), conferred by a combination of functional FLC and FRIGIDA (FRI) alleles, with a weak FY allele regulating the expression of the floral integrator FLOWERING LOCUS T (FT). By quantitative trait locus (QTL) mapping analysis, it has been shown that the timing of flowering is regulated by intricate interactions between environmental signals and genetic factors (Alonso-Blanco et al., 2009). When plants of three recombinant inbred populations were exposed to a combination of seasonal and vegetation shade environments, it was demonstrated that a major proportion of loci were mapped in specific environments, and only a reduced proportion of them were pleiotropic to different conditions (Botto and Coluccio, 2007).
In this study QTLs controlling hypocotyl growth under white light (WL) and WL+EOD (end of day far-red light) were mapped. The EODINDEX1 QTL was identified on chromosome 2, which explained >30% of the relative growth variation to EOD segregating in recombinant inbred lines (RILs) from the Bayreuth (Bay) and Shahdara (Sha) accessions of A. thaliana. Sha alleles at EODINDEX1 were shown to impair growth inhibition under WL, and accelerate the leaf movement circadian rhythms. A fine mapping and complementation analysis strongly suggest that ELF3 is the most likely candidate gene for EODINDEX1. It is hypothesized that ELF3, a component of the circadian clock involved in the shade avoidance signalling, is a gene subject to selective pressure that provides an adaptive advantage in shade environments.
Materials and methods
Plant material and experimental conditions
The core population of 164 RILs derived from crosses between Bay and Sha (Loudet et al., 2002), originated in opposite altitudinal places, was used. This population is available at the Arabidopsis Biological Resource Center (ABRC; Ohio State University, Columbus, OH, USA). The RIL population was phenotyped in two different light treatments to map QTLs affecting hypocotyl elongation. Due to failure in germination, the final number of lines tested was 141. Twenty seeds of each genotype were sown in clear plastic boxes (20 cm long×10 cm wide×1.5 cm tall) containing 100 ml of 0.8% agar and incubated in darkness at 5 °C for 4 d. Chilled seeds were exposed to a 1 h red (R) pulse, and transferred to darkness for 24 h to induce homogeneous seed germination at 23 °C. Then the boxes with seedlings were placed in a WL (70 μmol m−2 s−1) chamber under short-day conditions (8/16 h light/dark; SD) at 23 °C. Two light treatments were established: WL and WL+EOD. The EOD consisted of a 30 min pulse of FR light (40 μmol m−2 s−1), provided by incandescent lamps in combination with an RG9 filter (Schott, Germany). The experiments lasted 4 d. For each box (a replicate), the 10 longest seedlings were measured with a ruler. At least three replicates were measured for each genotype and treatment, unless otherwise indicated in the text.
Accessions used for natural genetic variation for shade avoidance response on hypocotyl growth experiments were Est-0, St-0, Ct-1, Ba-1, Ll-2, Mr-0, Lm-2, Pog-0, Oy-0, Gr-1, Mh-0, Di-1, Ms-0, Kas-1, Ra-0, Kin-0, Van-0, Pi-0, Ge-1, Mt-0, Bur-0, Bay-0, Sha, Col-0, Ler, Cvi, Co-4, Bla-1, Bla-6, Sf-2, and mutant lines phyB-1 and phyB-9, all obtained from the ABRC.
QTL mapping analysis
Marker segregation data for the Bay×Sha RIL population were obtained from Loudet et al. (2002). Thirty-eight markers that cover the five chromosomes with an average genetic distance of 10.8 cM between markers were used. MAPMAKER/EXP 3.0 was used to construct the linkage map (Lander et al., 1987). Linkage groups were verified with a minimum LOD=3 and a maximum distance=50 cM (Kosambi function). Both the linkage map data and the phenotypic data were then imported to QTL Cartographer version 2.0 obtained from http://statgen.ncsu.edu/qtlcart/WQTLCart.htm (Wang et al., 2004). A final number of 141 RILs was used in the QTL analysis. The likelihood, location, additive effect, and percentage of variance explained by each QTL were calculated using model 6 based on the composite interval mapping (CIM) method (Zeng, 1994). QTL cofactors were initially selected by using forward–backward stepwise multiple regression. Mapping was conducted with a walking speed of 0.5 cM and a window size of 3 cM. For precise determination of significant QTLs, the thresholds of LOD for each linkage group were calculated by a permutation test method (Doerge and Churchill, 1996) with 1000 permutations at the permutation significance level (P <0.05). The support interval of each QTL was constructed using the 2–LOD rule with the confidence intervals being defined by all those values falling within a 2–LOD score of the maximum value (Lynch and Walsh, 1998). To perform EODINDEX1 QTL fine mapping, a new QTL analysis was conducted using the phenotypic data, an additional set of 29 single-feature polymorphisms markers mapping on chromosome 2 (West et al., 2006), and also a marker at the ELF3 locus position that distinguishes the polyglutamine region between both accessions (Tajima et al., 2007). The re-analysis was done as described earlier using the markers corresponding to chromosome 2.
Confirmation of EODINDEX1 and sequence analysis of ELF3
Many RILs are still individually segregating for one limited genomic region. Taking advantage of this, near isogenic lines were generated in the form of heterogeneous inbred families (HIFs) as previously described (Tuinstra, 1997). RIL84 and RIL163 are still heterozygous for markers MSAT2.41 and MSAT 2.7; by screening the F7 seeds with these markers, the region was fixed for each parental allele, generating in this way two lines that differed only at the region of interest (HIF84 and HIF163). Seeds originating from two independent plants for each genotype were used for the experiments. The selected HIFs were screened for the ELF3 marker to confirm that they were not segregating at this particular locus. Conditions for the PCR amplifications were obtained from Loudet et al. (2002).
For quantitative complementation analysis of ELF3 as a candidate gene, Bay and Sha parental lines were crossed with elf3-1 and Col (wild-type control). The F1 and the original genotypes were evaluated for hypocotyl growth under WL and WL+EOD following the experimental protocols previously described.
ELF3 gene sequence was analysed in both parental lines (Bay and Sha). DNA sequence analysis was performed using a dye terminator sequencing system (Big Dye Terminator, Applied Biosystems) on the Genetic Analyzer 3600 (Applied Biosystems). The polymorphisms found were confirmed by those available now at www.arabidopsis.org, and the number of glutamine repeats in Sha was confirmed by Tajima et al. (2007). The polymorphisms found are shown in Supplementary Fig. S1 available at JXB online.
Circadian rhythm experiments
For leaf movement analysis, plants were entrained under SD conditions, until the first pair of leaves emerged, and were then transferred to continuous 40 μmol m−2 s−1 white fluorescent light (LL). The position of the first pair of leaves was recorded every hour for 6 d (Hicks et al., 1996). Period estimates were calculated with Brass 3.0 software (Biological Rhythms Analysis Software System; available from http://www.amillar.org) (Millar et al., 1995; Plautz et al., 1997).
For qRT-PCR expression analysis, Arabidopsis seedlings were entrained under SD for 2 weeks and then they were released into LL and harvested every 4 h. Total RNA was extracted with a Total RNA Extraction Kit-Plant (RBC Real Genomics) following the manufacturer's protocols and it was subjected to a DNase treatment with RQ1 RNase-free DNase (Promega). cDNA derived from this RNA was synthesized using Invitrogen SuperScript III and an oligo(dT) primer. The synthesized cDNAs were amplified with FastStart Universal SYBR Green Master (Roche) using the 7500 Real Time PCR System (Applied Biosystems) cycler. The Protein Phosphatase 2A Subunit A3 (PP2A) gene was used as the normalization control (Czechowski et al., 2005). A list of primer sequences is provided in Supplementary Table S1 at JXB online.
Results
Natural genetic variation for the effect of shade avoidance response on hypocotyl growth
The variation of hypocotyl length in response to shade avoidance signals was studied in seedlings grown in WL or WL+EOD in SD conditions (8 h light+16 h dark). At the end of the day, half of the seedlings received a pulse of FR (WL+EOD), a light treatment that mimics the shade avoidance responses displayed by plants exposed to vegetation shade in nature (Franklin, 2008). A wide genetic variation for hypocotyl growth was observed in WL and WL+EOD between 30 accessions of Arabidopsis (between 2.21 mm and 5.08 mm in WL, and between 4.55 mm and 8.65 mm in WL+EOD). The most common laboratory accessions displayed a very strong inhibition of hypocotyl growth under WL and a strong promotion under WL+EOD. phyB mutant seedlings showed a null response to shade principally due to an impaired inhibition of hypocotyl elongation under WL (Fig. 1A, phyB-1 and phyB-9). Bay and Sha, two accessions broadly used in natural genetic studies because a RIL population was developed, showed different hypocotyl elongation patterns under conditions that simulated open (WL) or shade (WL+EOD) environments (Fig. 1B). Indeed, Sha seedlings displayed 1.7-fold longer hypocotyls than Bay in WL and a similar hypocotyl length to Bay in response to WL+EOD. Therefore, Sha shows a constitutive shade avoidance phenotype similar to that observed in phyB mutants. In the following experiments hypocotyl growth in response to EOD signals among these accessions was explored by QTL analysis.
Fig. 1.
Natural variation of hypocotyl growth in WL and WL+EOD. (A) Correlation between hypocotyl growth in WL and WL+EOD for 30 accessions of Arabidopsis thaliana. Some reference accessions, phyB-1 (Ler background) and phyB-9 (Col background), are shown for comparison. The regression line and R2 are shown. (B) Photographs show hypocotyl growth for Bay and Sha in WL and WL+EOD. (This figure is available in colour at JXB online.)
QTL mapping for the effect of shade avoidance response on hypocotyl growth
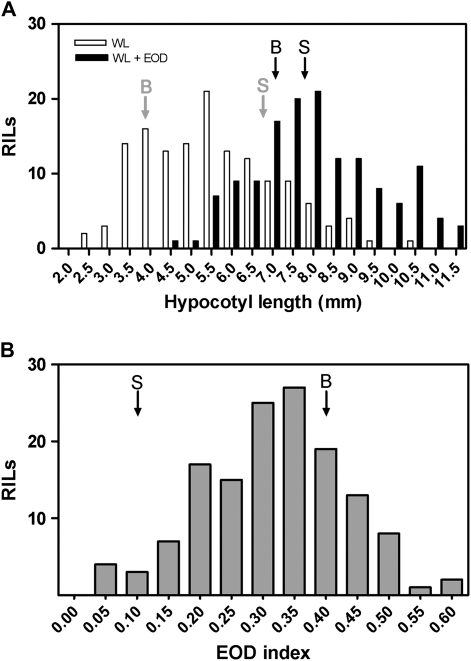
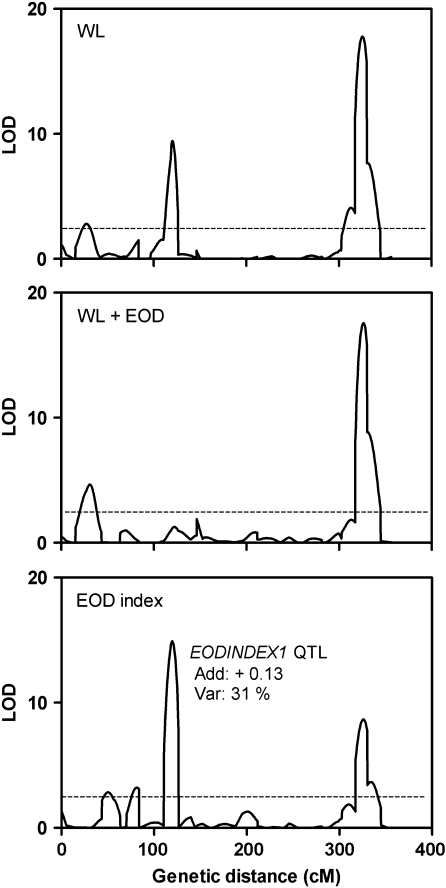
The frequency distributions of 141 RILs originated from the cross between Bay and Sha (Loudet et al., 2002) in response to WL and WL+EOD are shown in Fig. 2A. A huge variation within the RIL population was detected in WL (between 2.33 mm and 10.70 mm). Furthermore, phenotypic variation between lines was also observed in WL+EOD (from 4.43 mm to 11.53 mm). An EOD index was calculated as hypocotyl length in (WL+EOD–WL)/WL+EOD to obtain a relative magnitude of the shade avoidance response for each line. The Sha accession showed a reduced response to EOD in contrast to the Bay accession. The EOD index ranged from 0.047 for RILs less responsive to shade to 0.60 for the most responsive genotypes (Fig. 2B, Supplementary Table S2 at JXB online). Three, two, and four QTLs were mapped in WL, WL+EOD, and the EOD index, respectively. The three QTLs identified in WL had been previously reported (Loudet et al., 2008) when growing seedlings of the same RIL population in continuous WL supplemented with incandescent lamps at 22 °C and 26 °C. The most significant QTL for the EOD index, which we named EODINDEX1, was mapped on chromosome 2 and co-localized with a QTL that appeared in WL (Fig. 3, Supplementary Table S3 at JXB online). The EODINDEX1 QTL explains 31% of the total phenotypic variation, and Bay alleles have a positive contribution to the promotion of hypocotyl length in response to simulated shade, evaluated through the EOD index trait. As expected, the Bay allelic effects of EODINDEX1 in WL showed a negative additive contribution (Supplementary Table S3 at JXB online).
Fig. 2.
Phenotypic distributions of hypocotyl growth for recombinant inbred lines of the Bay×Sha population. (A) WL and WL+EOD. (B) EOD index. Arrows (grey, WL; black, WL+EOD) indicate the average response for Bay and Sha.
Fig. 3.
QTL mapping for hypocotyl growth in WL, WL+EOD, and the EOD index. The sum of genetic distance for the five chromosomes of A. thaliana is shown on the x-axis. Additive effects (Bay alleles increase the EOD index) and percentage of explained variability by the EODINDEX1 QTL mapped on the chromosome 2 are shown.
Confirmation of the EODINDEX1 QTL
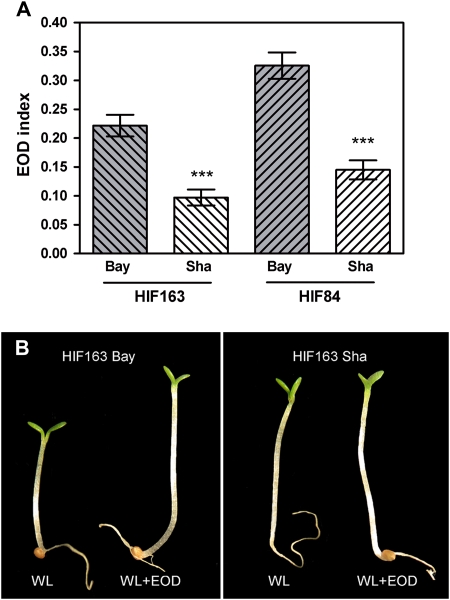
Additional genetic evidence confirmed the allelic differences detected at the EODINDEX1 QTL. Two independent families of polymorphic lines at the EODINDEX1 QTL were developed. HIF163 and HIF84 carrying Bay alleles at the EODINDEX1 QTL showed a substantially higher EOD index for hypocotyl growth than those carrying Sha alleles (Fig. 4).
Fig. 4.
Confirmation of the EODINDEX1 QTL. (A) Confirmation of the EODINDEX1 QTL in two independent heterogeneous inbred families (HIF163 and HIF84). Three asterisks denote significant differences at P<0.001. (B) Photographs show hypocotyl growth for HIF163-Bay and HIF163-Sha in WL and WL+EOD. (This figure is available in colour at JXB online.)
ELF3 is a candidate gene for the EODINDEX1 QTL
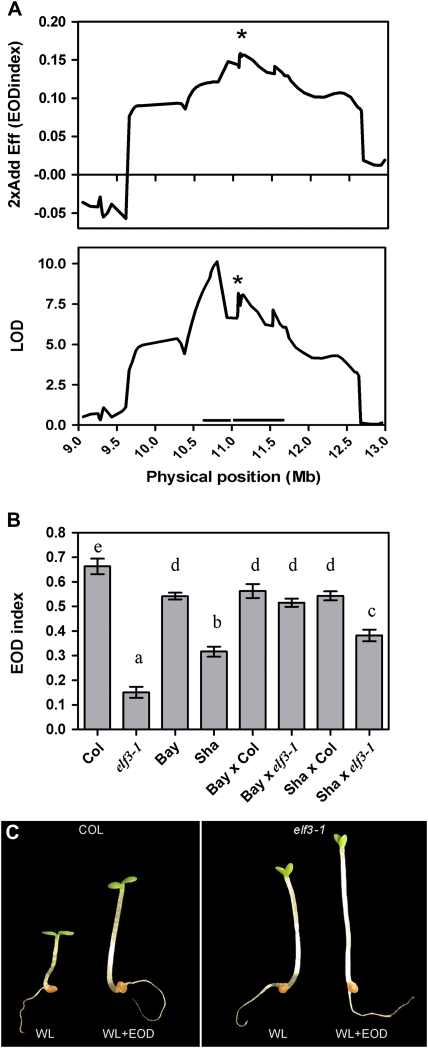
The EODINDEX1 QTL contains several genes within the confidence interval defined by MSAT2.36 and MSAT2.7, including the ELF3 gene but excluding PHYB. To reduce the confidence interval of the EODINDEX1 QTL, a fine mapping QTL analysis using 30 additional single-feature polymorphisms including an ELF3 marker was performed. The analysis reduced the confidence interval of the EODINDEX1 QTL to a region of 1399 kb that contained potentially two LOD peaks with their confidence intervals (579 kb and 820 kb, respectively). The highest additive effect was associated with the ELF3 marker, suggesting that it was the most firm candidate gene for the EODINDEX1 QTL (Fig. 5A). In addition, the constitutive shade avoidance phenotypes of Sha and HIF163-Sha resemble the elf-3 phenotype under WL (Figs 1B, 4B, 5C). Then, a quantitative complementation analysis was performed to confirm that the ELF3 gene was responsible for the EODINDEX1 QTL. The phenotype of F1 seedlings coming from a cross between Bay and Sha with elf3-1 and Col (wild-type) exposed to WL and WL+EOD showed that the Sha-ELF3 allele did not fully complement the phenotype of elf3-1. This result suggests that ELF3 is indeed the most likely candidate gene responsible for the EODINDEX1 QTL (Fig. 5B).
Fig. 5.
ELF3 is the candidate gene for the EODINDEX1 QTL. (A) Fine mapping of the EODINDEX1 QTL on chromosome 2 (with physical positions in Mb) between markers MSAT2.36 and MSAT2.7 including 29 additional single-feature polymorphism markers and a marker on the ELF3 gene indicated by an asterisk. Additive effects (Bay alleles increase the EOD index) and LOD are shown for the EOD index. Thin horizontal lines indicate the 2–LOD support interval drawn from the QTL mapping analysis around the EODINDEX1 peak. (B) Quantitative complementation analysis showing that the Sha allele at the ELF3 gene does not fully complement the elf3-1 phenotype. Each data point represents the mean ±SEM of 20 seedlings. Different letters indicate significant differences at P <0.05. (C) Photographs show hypocotyl growth for Col and elf3-1 in WL and WL+EOD. (This figure is available in colour at JXB online.)
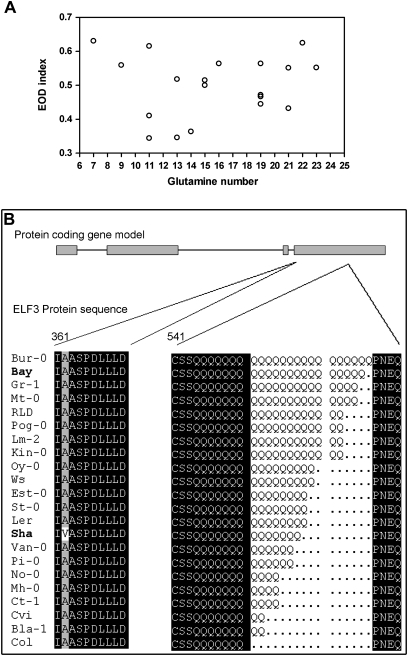
In order to find the molecular basis of the phenotypic differences between accessions in response to simulated shade, a study of the genomic sequence of Bay-ELF3 and Sha-ELF3 was performed. Previous evidence demonstrated that ELF3 encodes a protein with a variable number of glutamine repeats, which vary between different accessions (Tajima et al., 2007). However, correlation between the EOD index phenotype and the glutamine number was not found in 22 accessions of Arabidopsis, indicating that this polymorphism is probably not responsible for the differences observed in EOD index between Bay and Sha accessions (Fig. 6A). In addition, eight nucleotide changes were found, only one of them resulting in a non-synonymous amino acid substitution (Supplementary Fig. S1 at JXB online). This substitution corresponds to an alanine at position 362, conserved for all accessions with the exception of Sha, which carries a valine at this position (Fig. 6B). This suggests that this particular amino acid change could be responsible for the molecular basis of the phenotypic variation observed on hypocotyl growth in response to shade.
Fig. 6.
ELF3 variation in 22 accessions of Arabidopsis. (A) Relationship between the EOD index and the number of glutamines in 22 Arabidopsis accessions. (B) Comparison of ELF3 protein sequences among accessions. A schematic representation of the protein shows a substitution of the conserved alanine (A) by valine (V) in Sha at amino acid position 362 and a variable number of glutamines at amino acid position 544.
The EODINDEX1 QTL regulates the circadian rhythm of leaf movement
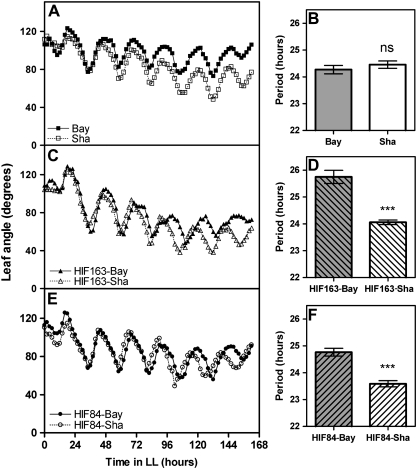
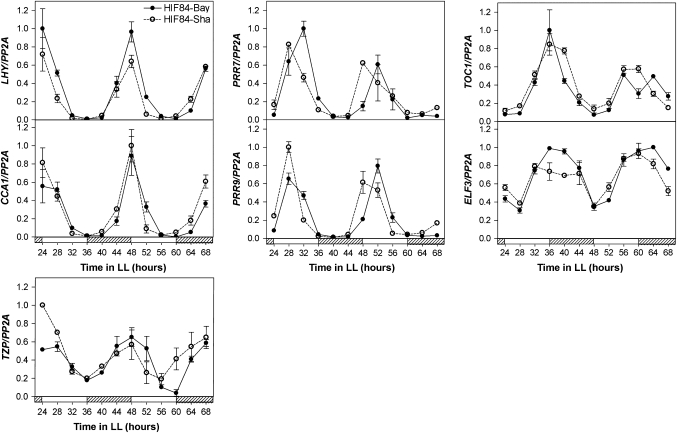
ELF3 is a component of the circadian clock and has also been implicated in the light control of hypocotyl growth (Hicks et al., 1996; Reed et al., 2000; Liu et al., 2001). The circadian rhythm of leaf movement in the parental accessions Bay and Sha, as well as in polymorphic lines at the EODINDEX1 QTL, was evaluated. Seedlings were entrained under SD conditions for 10 d and then transferred to continuous WL for several days (LL, free running conditions). Albeit Bay and Sha accessions showed similar periods for the circadian rhythm of leaf movement, two independent lines of HIFs (84/163) carrying Sha alleles at the EODINDEX1 QTL exhibited an acceleration in the leaf movement rhythm (i.e. a shorter period) compared with those carrying Bay alleles at this position (Fig. 7). Expression analysis by qRT-PCR demonstrated that the differential behaviour of polymorphic lines at the EODINDEX1 QTL was correlated with the expression pattern of six core clock genes and one clock output gene that mediates the clock regulation of hypocotyl elongation. HIF84-Sha showed a small but significant acceleration in the expression rhythm of PRR7 and PRR9 transcripts, already observed during the second day in continuous WL. A similar acceleration was detected for CCA1, LHY, TOC1, ELF3, and TZP transcripts during the third day under free-running conditions when HIF84-Sha is compared with HIF84-Bay (Fig. 8). These results demonstrate that the EODINDEX1 QTL is involved in the regulation of circadian rhythms, as expected if ELF3 is indeed the gene responsible for the EODINDEX1 QTL.
Fig. 7.
Sha alleles at the EODINDEX1 QTL accelerate the circadian rhythms of leaf movement. Leaf angle and period length are shown for Bay and Sha (A, B), HIF163-Bay and HIF163-Sha (C, D), and HIF84-Bay and HIF84-Sha (E, F). Seedlings were maintained in short-day conditions (8/16 h light/dark cycles) for 10 d, and then moved to constant white light for 6 d (LL, free running conditions). Each data point represents the mean of six seedlings. Each data point represents the mean of ±SEM of six seedlings. Three asterisks denote significant differences at P<0.001. ns, not significant.
Fig. 8.
qRT-PCR expression analysis for core clock genes and one clock output gene (TZP) for Bay-HIF84 and Sha-HIF84 seedlings. Seedlings were grown under short-day conditions for 10 d, and then transferred to continuous white light conditions for 3 d (LL, free running conditions). Gene expression was evaluated during the second and third day under continuous white light. Open and striped boxes indicate light and subjective night periods, respectively. Each data point represents the mean of ±SEM of three independent samples.
Discussion
Shade avoidance responses have been shown to confer a significant adaptive advantage in plants growing under natural conditions (Schmitt et al., 2003). At the same time, our understanding of the molecular mechanisms underlying shade avoidance responses has increased dramatically over the last decade (Franklin, 2008). In spite of these advances, the genetic bases underlying phenotypic diversity in responses to shade signals in natural populations is just beginning to be understood. Indeed, whilst some of the molecular mechanisms underlying differential flowering time responses to a low R/FR ratio have been recently uncovered (Adams et al., 2009), the genetic bases responsible for the phenotypic diversity observed in growth responses triggered by shade are completely ignored.
Here attention was focused on the natural genetic variation underlying differential growth responses to simulated shade in the Bay×Sha RIL population. In the present laboratory conditions, the Sha accession displayed an impaired shade avoidance response due to an enhanced promotion of hypocotyl length under WL, and a lack of further growth promotion in response to EOD. EODINDEX1 was identified as the most important QTL in the EOD index response. The generation of polymorphic lines at EODINDEX1 and a quantitative complementation analysis suggest that ELF3, a component of the circadian clock, is the gene candidate for EODINDEX1. An amino acid substitution of a conservative alanine for a ‘rare’ valine amino acid at position 362 of the Sha-ELF3 protein is likely to be the cause of the constitutive shade avoidance phenotype in the Sha accession. In addition, physiological and RNA expression analysis comparing the rhythm of leaf movement between genotypes demonstrate that Sha alleles at EODINDEX1 shortened the period of circadian rhythms, these effects being dependent of the genetic background. Null elf3 plants are arrhythmic (Hicks et al., 1996), but plants overexpressing ELF3 display a long circadian period phenotype (Covington et al., 2001), suggesting that the ELF3 allele present in Sha is hypomorphic.
ELF3 is a highly conserved plant-specific nuclear protein, which regulates flowering time, photomorphogenic development, and circadian rhythms in Arabidopsis (Hicks et al., 1996; Zagotta et al., 1996). The precise biochemical and molecular mechanisms through which ELF3 acts to regulate the above physiological processes are largely unknown. Several years ago a role for ELF3 in mediating or modulating the activity of phyB, the main SAS photoreceptor, was proposed based on the interaction of these two proteins in the yeast two-hybrid system (Liu et al., 2001). At the same time, the physiological characterization of single and double mutants of these genes revealed both phyB-dependent and -independent effects of ELF3 on hypocotyl growth (Reed et al., 2000; Liu et al., 2001). In relation to its circadian function, ELF3 was originally thought to allow circadian rhythm progression modulating the response to light cues that set the circadian clock to the correct time of day (McWatters et al., 2000; Covington et al., 2001). More recently, however, ELF3 has been proposed to act as a component of the core oscillator to allow clock progression from day to night in a light-independent fashion (Thines and Harmon, 2010). Thus, both light-dependent and light-independent effects of ELF3 on different physiological processes have been reported, suggesting that ELF3 may have multiple molecular functions.
The present data support the idea that ELF3 is a component of the light signalling pathway regulating SAS, in agreement with previous evidence (Reed et al., 2000), and this function appears to be independent of ELF3’s role as a component of the circadian clock. EODINDEX1 mediated the acceleration of circadian rhythms, at least in part, by regulating the expression of some core clock genes. This observation is in agreement with the result of the quantitative complementation approach suggesting that the ELF3 locus is responsible for the impaired SAS phenotypes of Sha. Interestingly, the effect of the Sha EODINDEX1 allele on clock function was evident in the two different HIF backgrounds evaluated, but was not present when the parental line backgrounds were compared. In contrast, Sha EODINDEX1 effects on hypocotyl growth responses to shade were impaired both in the parental line background and in the HIF backgrounds. Therefore, although the long hypocotyl phenotype of elf3 has been proposed to result from its defects in clock function, the lack of correlation between circadian and SAS alterations caused by EODINDEX1 in different genetic backgrounds supports the idea of a direct role for ELF3 in phyB signalling, in addition to its well-established role as a circadian clock component (Thines and Harmon, 2010). The recent observation that ELF3 may act as an adaptor protein facilitating the ability of the E3-ubiquitin ligase COP1 of destabilizing GIGANTEA (Yu et al., 2008) suggests that ELF3 may affect clock function and light signalling independently regulating the stability of different proteins.
In addition to identifying ELF3 as the first candidate gene to mediate phenotypic variation in SAS, the present work also expanded previous knowledge on the phenotypic variation in different shade avoidance responses among A. thaliana accessions (Botto and Smith, 2002). Specifically in this work, a wide range of variation for the control of hypocotyl growth under WL and WL+EOD in 30 accessions of Arabidopsis was shown. The most common laboratory accessions displayed reduced hypocotyl elongation in WL and a clear response to EOD that mimics a natural shade avoidance response. However, a few accessions such as CT-1 from Catania (Italy) and No-0 from Nossen (Germany) already showed large hypocotyl phenotypes similar to those observed in phyB mutants under WL. Although this study explores the molecular bases of the natural variation in SAS, the genetic architecture of this central feature of plant development is far from being understood. The recent availability of many segregating populations (Simon et al., 2008; Balasubramani et al., 2009), coupled with the study of other shade avoidance responses, will surely provide very valuable new alleles and genes involved in the SAS. For example, QTL mapping using RILs originated from the cross of Ct-1 or No-0 with other contrasting parental genotypes will be a fruitful avenue to find new loci involved in the SAS. Furthermore, the comparison between different RIL populations sharing a parent, such as the Ct-1 accession, should contribute to improve the understanding of the function of loci involved in the SAS in different genetic environments.
Finally, although the natural adaptive advantage of shade responses using mutagenic approaches has been demonstrated (Schmitt et al., 1995; Ballaré and Scopel, 1997), the potential adaptive advantage of natural genetic variants in plastic responses to shade remain to be explored (Mitchell-Olds and Schmitt, 2006; Shindo et al., 2007). To determine whether natural variation in SAS indeed resulted from local adaptations among Arabidopsis accessions, a substantial effort in ecological analysis is required. The adaptive contribution of EODINDEX1 to different density environments will have to be assessed through the generation and evaluation of near isogenic lines in field conditions under different levels of shading, to estimate the relative fitness of Bay and Sha alleles. The shade avoidance hypothesis would predict that the fitness of Sha-EODINDEX1 plants relative to Bay-EODINDEX1 plants would decline at low density. In summary, the difficult ecological question of whether the Sha-allele at EODINDEX1 is a deleterious variant that has become fortuitously fixed in the population, or if this allele indeed provides a fitness advantage in its local environment will soon be answerable.
Supplementary data
Supplementary data are available at JXB online.
Table S1: List of primer sequences used for qRT-PCR expression analysis.
Table S2: Summary statistics for hypocotyl length under WL, WL+EOD and EOD index.
Table S3: QTL mapping for hypocotyl length under WL, WL+EOD and EOD index in Bay × Sha RIL population.
Figure S1: Polymorphisms found in ELF3 sequence of Bay and Sha accessions.
Supplementary Material
Acknowledgments
We thank Romina Sellaro for her invaluable technical support. This research was supported by Préstamo BID PICT 32137 and UBACyT grant G041 to JFB, and Préstamo BID PICT 1026 to MJY. The work was supported by doctoral fellowships from CONICET (MPC and SES) and ANPCyT (LK).
Glossary
Abbreviations
- EOD
FR pulse at end of day
- FR
far red light
- GA
gibberellin
- HIF
heterogeneous inbred family
- LL
continuous white light
- R
red light
- PAR
photosynthetically active radiation
- RIL
recombinant inbred line
- SAS
shade avoidance syndrome
- SD
short days
- WL
white light
References
- Adams S, Allen T, Whitelam GC. Interaction between the light quality and flowering time pathways in Arabidopsis. The Plant Journal. 2009;60:257–267. doi: 10.1111/j.1365-313X.2009.03962.x. [DOI] [PubMed] [Google Scholar]
- Alonso-Blanco C, Aarts M, Bentsink L, Keurentjes J, Reymond M, Vreugdenhil D, Koornneef M. What has natural variation taught us about plant development, physiology, and adaptation? The Plant Cell. 2009;21:1877–1896. doi: 10.1105/tpc.109.068114. [DOI] [PMC free article] [PubMed] [Google Scholar]
- Balasubramani Schwartz C, Singh A, et al. QTL mapping in new Arabidopsis thaliana advanced intercross-recombinant inbred lines. PLos One. 2009;4:1–8. doi: 10.1371/journal.pone.0004318. [DOI] [PMC free article] [PubMed] [Google Scholar]
- Ballaré CL, Scopel AL. Phytochrome signalling in plant canopies: testing its population-level implications with photoreceptor mutants of Arabidopsis. Functional Ecology. 1997;11:441–450. [Google Scholar]
- Bentsink L, Jowett J, Hanhart CJ, Koornneef M. Cloning of DOG1, a quantitative trait locus controlling seed dormancy in Arabidopsis. Proceedings of the National Academy of Sciences, USA. 2006;103:17042–17047. doi: 10.1073/pnas.0607877103. [DOI] [PMC free article] [PubMed] [Google Scholar]
- Botto JF, Coluccio MP. Seasonal and plant-density dependency for quantitative trait loci affecting flowering time in multiple populations of Arabidopsis thaliana. Plant, Cell and Environment. 2007;30:1465–1479. doi: 10.1111/j.1365-3040.2007.01722.x. [DOI] [PubMed] [Google Scholar]
- Botto JF, Smith H. Differential genetic variation in adaptive strategies to a common environmental signal in Arabidopsis accessions: phytochrome-mediated shade avoidance. Plant, Cell and Environment. 2002;25:53–63. [Google Scholar]
- Covington MF, Panda S, Liu XL, Strayer CA, Wagner DR, Kay SA. ELF3 modulates resetting of the circadian clock in Arabidopsis. The Plant Cell. 2001;13:1305–1316. doi: 10.1105/tpc.13.6.1305. [DOI] [PMC free article] [PubMed] [Google Scholar]
- Czechowski T, Stitt M, Altmann T, Udvardi M, Scheible W. Genome-wide identification and testing of superior reference genes for transcript normalization in Arabidopsis. Plant Physiology. 2005;139:5–17. doi: 10.1104/pp.105.063743. [DOI] [PMC free article] [PubMed] [Google Scholar]
- de Lucas M, Daviére JM, Rodríguez-Falcón M, Pontin M, Iglesias-Pedraz JM, Lorrain S, Frankhauser C, Blázquez MA, Titarenko E, Prat S. A molecular framework for light and gibberellin control of cell elongation. Nature Letters. 2008;451:480–486. doi: 10.1038/nature06520. [DOI] [PubMed] [Google Scholar]
- Devlin P, Patel S, Whitelam G. Phytochrome E influences internode elongation and flowering time in Arabidopsis. The Plant Cell. 1998;10:1479–1487. doi: 10.1105/tpc.10.9.1479. [DOI] [PMC free article] [PubMed] [Google Scholar]
- Devlin P, Robson P, Patel S, Goosey L, Sharrock R, Whitelam G. Phytochrome D acts in the shade-avoidance syndrome in Arabidopsis by controlling elongation growth and flowering time. Plant Physiology. 1999;119:909–915. doi: 10.1104/pp.119.3.909. [DOI] [PMC free article] [PubMed] [Google Scholar]
- Djakovic-Petrovic T, de Wit M, Voesenek LACJ, Pierik R. DELLA protein function in growth responses to canopy signals. The Plant Journal. 2007;51:117–126. doi: 10.1111/j.1365-313X.2007.03122.x. [DOI] [PubMed] [Google Scholar]
- Doerge RW, Churchill GA. Permutation tests for multiple loci affecting a quantitative character. Genetics. 1996;142:285–294. doi: 10.1093/genetics/142.1.285. [DOI] [PMC free article] [PubMed] [Google Scholar]
- Feng S, Martinez C, Gusmaroli G, et al. Coordinated regulation of Arabidopsis thaliana development by light and gibberellins. Nature. 2008;451:475–480. doi: 10.1038/nature06448. [DOI] [PMC free article] [PubMed] [Google Scholar]
- Filiault DL, Wessinger CA, Dinneny JR, Lutes J, Borevitz JO, Weigel D, Chory J, Maloof JN. Amino acid polymorphisms in Arabidopsis phytochrome B cause differential responses to light. Proceedings of the National Academy of Sciences, USA. 2008;105:3157–3162. doi: 10.1073/pnas.0712174105. [DOI] [PMC free article] [PubMed] [Google Scholar]
- Franklin KA. Shade avoidance. New Phytologist. 2008;179:930–944. doi: 10.1111/j.1469-8137.2008.02507.x. [DOI] [PubMed] [Google Scholar]
- Hicks K, Millar A, Carré I, Somers D, Straume M, Meeks-Wagner D, Kay S. Conditional circadian dysfunction of the Arabidopsis early-flowering 3 mutant. Science. 1996;274:790–792. doi: 10.1126/science.274.5288.790. [DOI] [PubMed] [Google Scholar]
- Johanson U, West J, Lister C, Michaels SD, Amasino RM, Dean C. Molecular analysis of FRIGIDA, a major determinant of natural variation in Arabidopsis flowering time. Science. 2000;290:344–347. doi: 10.1126/science.290.5490.344. [DOI] [PubMed] [Google Scholar]
- Lander ES, Green P, Abrahamson J, Barlow A, Daly MJ, Lincoln SE, Newburg L. MAPMAKER: an interactive computer package for constructing primary genetic linkage maps of experimental and natural populations. Genomics. 1987;1:174–181. doi: 10.1016/0888-7543(87)90010-3. [DOI] [PubMed] [Google Scholar]
- Liu XL, Covington MF, Frankhauser C, Chory J, Wagner DR. ELF3 encodes a circadian clock-regulated nuclear protein that functions in Arabidopsis PHYB signal transduction pathway. The Plant Cell. 2001;13:1293–1304. doi: 10.1105/tpc.13.6.1293. [DOI] [PMC free article] [PubMed] [Google Scholar]
- Lorrain S, Allen T, Duek P, Whitelam GC, Frankhauser C. Phytochrome-mediated inhibition of shade avoidance involves degradation of growth-promoting bHLH transcription factors. The Plant Journal. 2008;53:312–323. doi: 10.1111/j.1365-313X.2007.03341.x. [DOI] [PubMed] [Google Scholar]
- Loudet O, Chaillou S, Camilleri C, Bouchez D, Daniel-Vedele F. Bay-O×Shahdara recombinant inbred line population: a powerful tool for the genetic dissection of complex traits in Arabidopsis. Theoretical and Applied Genetics. 2002;104:1173–1184. doi: 10.1007/s00122-001-0825-9. [DOI] [PubMed] [Google Scholar]
- Loudet O, Michael TP, Burger BT, Le Metté C, Mockler TC, Weigel D, Chory J. A zinc knuckle protein that negatively controls morning-specific growth in Arabidopsis thaliana. Proceedings of the National Academy of Sciences, USA. 2008;105:17193–17198. doi: 10.1073/pnas.0807264105. [DOI] [PMC free article] [PubMed] [Google Scholar]
- Lynch M, Walsh J. Genetics and analysis of quantitative traits. Sunderland, MA: Sinauer Associates; 1998. [Google Scholar]
- McWatters HG, Bastow RM, Hall A, Millar AJ. The ELF3zeitnehmer regulates light signalling to the circadian clock. Nature. 2000;408:716–720. doi: 10.1038/35047079. [DOI] [PubMed] [Google Scholar]
- Michaels SD, Amasino RM. Memories of winter: vernalization and the competence to flower. Plant, Cell and Environment. 2000;23:1145–1153. [Google Scholar]
- Millar AJ, Carre IA, Strayer CA, Chua NH, Kay SA. Circadian clock mutants in Arabidopsis identified by luciferase imaging. Science. 1995;267:1161–1163. doi: 10.1126/science.7855595. [DOI] [PubMed] [Google Scholar]
- Mitchell-Olds T, Schmitt J. Genetic mechanisms and evolutionary significance of natural variation in Arabidopsis. Nature. 2006;44:947–952. doi: 10.1038/nature04878. [DOI] [PubMed] [Google Scholar]
- Nagatani A, Chory J, Furuya M. Phytochrome B is not detectable in the hy3 mutant of Arabidopsis, which is deficient in responding to end-of-day far-red light treatments. Plant and Cell Physiology. 1991;32:1119–1122. [Google Scholar]
- Nozue K, Covington MF, Duek PD, Lorrain S, Fankhauser C, Harmer SL, Maloof JN. Rhythmic growth explained by coincidence between internal and external cues. Nature. 2007;448:358–361. doi: 10.1038/nature05946. [DOI] [PubMed] [Google Scholar]
- Ostergaard L, Yanofsky MF. Establishing gene function by mutagenesis in Arabidopsis thaliana. The Plant Journal. 2004;39:682–696. doi: 10.1111/j.1365-313X.2004.02149.x. [DOI] [PubMed] [Google Scholar]
- Pierik R, Whitelam GC, Voesenek LA, de Kroon H, Visser EJ. Canopy studies on ethylene- insensitive tobacco identify ethylene as a novel element in blue light and plant–plant signalling. The Plant Journal. 2004;38:310–319. doi: 10.1111/j.1365-313X.2004.02044.x. [DOI] [PubMed] [Google Scholar]
- Plautz J, Straume M, Stanewsky R, Jamison C, Brandes C, Dowse H, Hall J, Kay S. Quantitative analysis of Drosophila period gene transcription in living animals. Journal of Biological Rhythms. 1997;12:204–217. doi: 10.1177/074873049701200302. [DOI] [PubMed] [Google Scholar]
- Reed JW, Nagpal P, Bastow RM, Solomon KS, Dowson-Day MJ, Elumalai RP, Millar AJ. Independent action of ELF3 and PhyB to control hypocotyl elongation and flowering time. Plant Physiology. 2000;122:1149–1160. doi: 10.1104/pp.122.4.1149. [DOI] [PMC free article] [PubMed] [Google Scholar]
- Schmitt J, McCormac AC, Smith H. A test of the adaptive plasticity hypothesis using transgenic and mutant plants disabled in phytochrome-mediated elongation responses to neighbors. American Naturalist. 1995;146:937–953. [Google Scholar]
- Schmitt J, Stinchcombe JR, Heschel MS, Huber H. The adaptative evolution of plasticity: phytochrome-mediated shade avoidance responses. The Society for Integrative and Comparative Biology. 2003;43:459–469. doi: 10.1093/icb/43.3.459. [DOI] [PubMed] [Google Scholar]
- Sheldon CC, Finnegan EJ, Rouse DT, Tadege M, Bagnall DJ, Helliwell CA, Peacock WJ, Dennis ES. The control of flowering by vernalization. Current Opinion in Plant Biology. 2000;3:418–422. doi: 10.1016/s1369-5266(00)00106-0. [DOI] [PubMed] [Google Scholar]
- Shindo C, Bernasconi G, Hardtke CS. Natural variation in Arabidopsis: tools, traits and prospects for evolutionary ecology. Annals of Botany. 2007;99:1043–1054. doi: 10.1093/aob/mcl281. [DOI] [PMC free article] [PubMed] [Google Scholar]
- Simon M, Loudet O, Durand S, Bérard A, Brunel D, Sennesal F, Durand-Tardif M, Pelletier G, Camilleri C. Quantitative trait loci mapping in five new large recombinant inbred line populations of Arabidopsis thaliana genotyped with consensus single-nucleotide polymorphism markers. Genetics. 2008;178:2253–2264. doi: 10.1534/genetics.107.083899. [DOI] [PMC free article] [PubMed] [Google Scholar]
- Somers DE, Sharrock RA, Tepperman JM, Quail PH. The hy3 long hypocotyl mutant of Arabidopsis is deficient in phytochrome B. The Plant Cell. 1991;3:1263–1274. doi: 10.1105/tpc.3.12.1263. [DOI] [PMC free article] [PubMed] [Google Scholar]
- Tajima T, Oda A, Nakagawa M, Kamada H, Mizoguchi T. Natural variation of polyglutamine repeats of a circadian clock gene ELF3 in Arabidopsis. Plant Biotechnology. 2007;24:237–240. [Google Scholar]
- Thines B, Harmon FG. Ambient temperature response establishes ELF3 as a required component of the core Arabidopsis circadian clock. Proceedings of the National Academy of Sciences, USA. 2010;107:3257–3262. doi: 10.1073/pnas.0911006107. [DOI] [PMC free article] [PubMed] [Google Scholar]
- Tonsor SJ, Alonso-Blanco C, Koornneef M. Gene function beyond the single trait: natural variation, gene effects, and evolutionary ecology in Arabidopsis thaliana. Plant, Cell and Environment. 2004;28:2–20. [Google Scholar]
- Tuinstra MR, Ejeta G, Goldsbrough PB. Heterogeneous inbred family (HIF) analysis: a method for developing near-isogenic lines that differ at quantitative trait loci. Theoretical and Applied Genetics. 1997;95:1005–1011. [Google Scholar]
- Wang X, Korstanje R, Higgins D, Paigen B. Haplotype analysis in multiple crosses to identify a QTL gene. Genome Research. 2004;14:1767–1772. doi: 10.1101/gr.2668204. [DOI] [PMC free article] [PubMed] [Google Scholar]
- West MAL, van Leeuwen H, Kozik A, Kliebenstein DJ, Doerge RW, St. Clair DA, Michelmore RW. High-density haplotyping with microarray-based expression and single feature polymorphism markers in Arabidopsis. Genome Research. 2006;16:787–795. doi: 10.1101/gr.5011206. [DOI] [PMC free article] [PubMed] [Google Scholar]
- Yu J-W, Rubio V, Lee N-Y, et al. COP1 and ELF3 control circadian function and photoperiodic flowering by regulating GI stability. Molecular Cell. 2008;32:617–630. doi: 10.1016/j.molcel.2008.09.026. [DOI] [PMC free article] [PubMed] [Google Scholar]
- Zagotta MT, Hicks KA, Jacobs CI, Young JC, Hangarter RP, Meeks-Wagner DR. The Arabidopsis ELF3 gene regulates vegetative photomorphogenesis and the photoperiodic induction of flowering. The Plant Journal. 1996;10:691–702. doi: 10.1046/j.1365-313x.1996.10040691.x. [DOI] [PubMed] [Google Scholar]
- Zeng ZB. Precision mapping of quantitative trait loci. Genetics. 1994;136:1457–1468. doi: 10.1093/genetics/136.4.1457. [DOI] [PMC free article] [PubMed] [Google Scholar]
Associated Data
This section collects any data citations, data availability statements, or supplementary materials included in this article.


