

Abstract
Objective
To determine whether raltegravir-containing antiretroviral therapy (ART) intensification reduces HIV levels in the gut.
Design
Open-label study in HIV+ adults on ART with plasma HIV RNA<40 copies/ml.
Methods
Seven HIV+ adults received 12 weeks of ART intensification with raltegravir alone or in combination with efavirenz or darunavir. Gut cells were obtained by upper and lower endoscopy with biopsies from duodenum, ileum, colon, and rectum at baseline and 12 weeks. Study outcomes included plasma HIV RNA, HIV DNA and RNA from PBMC and 4 gut sites, T cell subsets, and activation markers.
Results
Intensification produced no consistent decrease in HIV RNA in the plasma, PBMC, duodenum, colon, or rectum. However, 5 of 7 participants had a decrease in unspliced HIV RNA per 106 CD4+ T cells in the ileum. There was a trend towards decreased T cell activation in all sites, which was greatest for CD8+ T cells in the ileum and PBMC, and a trend towards increased CD4+ T cells in the ileum.
Conclusion
Most HIV RNA and DNA in the blood and gut is not the result of ongoing replication that can be impacted by short-term intensification with raltegravir. However, the ileum may support ongoing productive infection in some patients on ART, even if the contribution to plasma RNA is not discernible.
Keywords: HIV, ART, intensification, raltegravir, gut, intestine, T cell
Introduction
Although combined antiretroviral therapy (ART) can reduce plasma viral load (VL) below 40 copies/ml, HIV persists as latent provirus, low-level plasma RNA, and cell-associated HIV RNA in peripheral blood mononuclear cells (PBMC) and lymphoid tissues. It is unclear whether this residual HIV RNA results solely from reactivation of latent infection [1-9] or whether there is a contribution from cryptic, low-level but continuous rounds of new infection [10-19] or chronically-productive cells. Because persistent replication or chronic infection would require very different therapeutic strategies from those aimed at latent infection, the question is critically important for strategies aimed at eradication.
One approach to assess for ongoing replication is by intensification of suppressive ART with one or more additional agents whose activity affects a distinct part of the viral life cycle. Several recent studies of ART intensification in patients on contemporary ART with VL<40-50 copies/ml failed to show a reduction in plasma HIV RNA [1, 5, 8, 9, 19]. However, the plasma may not reflect changes elsewhere in the body, especially the lymphoid tissues, which are the major site of HIV infection in untreated patients. Given the role of the gut-mucosal lymphoid compartment as a reservoir for HIV, we hypothesized that intensification may result in reductions in HIV RNA and/or immune activation that may be detected in the gut. Because different regions of the gut may vary in their ability to support productive infection, we performed a pilot prospective study to examine the effect of ART intensification with raltegravir (RLG) alone or in combination with a second agent on viral burden and T cell activation in multiple regions of the gut.
Methods
Patient Recruitment
HIV+ adults meeting entry criteria were recruited from two hospital-based HIV clinics. Inclusion criteria included: 1) age 18-65 years; 2) infection with HIV-1; 3) ART for ≥12 months; 4) no change in ART for ≥3 months; 5) CD4+ T cell count>200 cells/μl; and 6) VL<40 copies/ml for >6 months prior to study entry. Exclusion criteria included factors that would increase the risk from sedation, endoscopy, biopsy, or intensification. The study was approved by the Institutional Review Board of the University of California, San Francisco.
Study design
This was an open-label, pilot interventional study of 16 weeks duration. All participants had baseline clinical and laboratory evaluations followed by esophagogastroduodenoscopy (EGD) with 7-10 biopsies from the duodenum and colonoscopy with 7-10 biopsies each from the terminal ileum, right colon, and rectum. After baseline endoscopy, the ART regimen was intensified by adding RLG with or without a study PI or NNRTI for 12 weeks. Subjects who were not already on an NNRTI and who were suitable candidates had the option of adding a study NNRTI, while subjects who were not on a PI had the option of adding a study PI. Additional laboratory and clinical evaluations were done at weeks 1, 4, and 12. Repeat EGD and colonoscopy with biopsies were performed at week 12. Intensification was then stopped, and a final blood draw was done at week 16.
Endoscopy and Biopsy
EGD, colonoscopy, and biopsies were performed as described previously [20].
Processing of Gut Biopsies
Gut biopsies were immediately placed in RPMI with L-Glu, penicillin/streptomycin, and 15% fetal calf serum for subsequent cell isolation. Six to nine biopsies from each site were separated into single cells using a modification of a published method incorporating both collagenase digestion and needle shearing [20-22]. Briefly, biopsies were subjected to 3 rounds of collagenase digestion, mechanical disruption (by passing through a blunt 16gauge needle), clarification (by passing through a 70μm cell strainer), and washing. The three aliquots of strained and washed gut cells were then combined, counted, and resuspended in PBS+0.1% BSA 2mM EDTA. 5×10⁵ cells were set aside for flow cytometry, while the remainder was divided and frozen at -80C for subsequent DNA or RNA extraction. Of note, previous studies have documented that HIV DNA and RNA can be reproducibly quantified from a single endoscopic biopsy [23, 24].
Processing of Blood
68ml of blood was collected for plasma and PBMC in Vacutainer ACD tubes with Solution A (BD). Plasma was obtained by centrifuging twice at 1000g for 10minutes without braking. The buffy coat from the first spin was used to isolate PBMC by centrifugation on Ficoll according to the procedure recommended for Dynal Invitrogen Bead Separations. PBMC were resuspended in PBS+0.1% BSA+2mM EDTA. Aliquots of PBMC were collected for flow cytometry, HIV DNA, and HIV RNA. 6×10⁷ PBMC were used to isolate CD4+ cells by negative selection using the Dynabeads Untouched Human CD4+ T Cell Kit (Invitrogen). 5×10⁵ CD4+ T cells were saved for flow cytometry, while the remainder was frozen as cell pellets for HIV DNA and RNA.
Immunophenotyping
Antibodies and fluorochromes included the following: CD45-APC, CD3-Pacific Blue (BD Bioscience), CD4-ECD (Beckman Coulter), CD8-Q-Dot605 (Invitrogen, Custom conjugate), CD38-PE (BD Bioscience), and HLA-DR-FITC (BD Bioscience). Staining, washing, fixing, flow cytometry, and data analysis were performed as described previously [20, 25]. Cells were gated on a scatter plot to remove debris, then sequentially gated for CD45 (to define total leukocytes), CD3 (to define T-cells), and CD4 or CD8. CD38 and HLA-DR gates were set using Fluorescent-Minus-One controls for each marker on a PBMC sample then applied to PBMC and gut samples from the same subject. For each subject, gating was consistent between weeks 0 and 12.
High Volume Plasma HIV RNA
Plasma HIV RNA was measured using a modification of the Abbott m2000 assay [26, 27] with limit of detection (LOD) of <0.5 copies/ml [28]. Plasma (30ml) was diluted 1:1 with PBS, divided in two portions, layered onto 10ml of 6% iodixanol (OptiPrep Density Gradient Medium (Sigma) diluted 1:10 in PBS) in 50ml polypropylene tubes (Beckton), and centrifuged at 47,810g for 3hrs at 4C without braking. Viral pellets were resuspended in a total of 1000μl of PBS and the HIV RNA was measured according to the Abbott M2000 protocol. Copy values were extrapolated from the Ct values of the standards and then adjusted for the concentration factor.
Cell-associated HIV DNA by Real Time PCR
DNA was extracted using the DNA Blood Mini Kit (Qiagen) and measured using a NanoDrop 1000 Spectrophotometer. Three replicates of 500ng of DNA from each sample were then used in a real time Taqman PCR assay for HIV DNA that uses primers and a Locked Nucleic Acid probe from the Gag region. This assay detected a 10 copy standard 19/20 times (95%) with a mean value of 9.5+/-1.7 copies. External standards (105 to 1) were prepared from DNA extracted from serial dilutions of known numbers of 8E5 cells (NIH AIDS Reagent Program), each of which contains one integrated HIV genome per cell.
HIV DNA copy numbers were extrapolated from the Ct values of the samples and expressed as copies/106 cells (assuming 1 μg total DNA corresponds to 160,000 cells). To account for variation in the number of CD4+T-cells in different samples, results were also normalized by the percent of all cells that were CD45+CD3+CD4+ (by flow cytometry) and expressed as copies/106 CD4+T-cells. To verify the DNA concentrations and assess for PCR inhibitors, samples from four patients were assayed using a separate real time PCR for β-actin.
Cell-associated HIV RNA by Reverse Transcriptase Real Time PCR (qRT-PCR)
RNA was extracted using the Rneasy Kit (Qiagen) with on-column digestion using RNase-free DNase (Qiagen). To maximize the sensitivity of the qRT-PCR assays, which approaches one copy per reaction [30, 31], primers and probes were matched to each subject based on the sequence of the prevailing viral quasispecies in peripheral CD4+ T cell DNA. Unspliced HIV RNA (UsRNA) was measured using primers from the pol region (2536-2562 and 2634-2662). Multiply-spliced HIV RNA encoding for Tat and Rev (MsRNA tat-rev) was measured using primers from tat exon 1 (5956-5979) and tat/rev exon 2 (8433-8459). Total multiply-spliced HIV RNA (MsRNA Tot) was measured using primers from rev exon 1 (6012-6045) and tat/rev exon 2 (8433-8459). Probes were chosen from a panel of highly conserved wild-type probes that matched their target sequences by 100% [32], except for MsRNA from patient 196, for which no matching wild-type probe could be identified, and for which an individualized probe was designed. qRT-PCR was done under the conditions described previously [33].
HIV-1 RNA copy numbers (the mean of duplicate PCR measurements) were calculated as described previously [20, 30] and then normalized to the cellular input into the PCR, as determined both by total RNA concentration (measured by NanoDrop 1000, assuming that 1ng RNA correspond to 1000 cells [34]) and by levels of glyceraldehyde phosphate dehydrogenase (GAPDH) RNA (as determined by a separate qRT-PCR). Results (copies/106 cells) from the two different methods of normalization correlated well. To account for variation in the number of CD4+ T cells in different samples, HIV RNA copy numbers were also normalized by the percent of all cells that were CD45+CD3+CD4+ (by flow cytometry).
Statistics
Results from week 0 and week 12 were compared across all participants using the Wilcoxon signed rank test.
Results
Study Population
Of 14 patients who were screened, 13 met study criteria and 8 consented to enter the study. The eight participants had a median age of 51 years, median duration of HIV infection of 14.5 years, and median entry CD4 of 473 cells/μl (Table 1). They had maintained VL<40 copies/ml for 2.8 to 12 years and had a median baseline VL of 2.3 copies/ml. Five subjects were intensified with RLG alone; the remainder added a PI or NNRTI in addition to RLG. One participant (A190) withdrew shortly after study entry for personal reasons. There were no serious adverse events attributed to intensification or endoscopic biopsies.
Table 1. Clinical Characteristics.
| individual | age | sex | yrs HIV | total time on ART (yrs) | total duration VL<40 (yrs) | time since last VL>40 (yrs) | mean entry VL (copy/ml) | CD4 nadir (#/ul) | entry CD4 (#/ul / %) | entry regimen | intensification |
|---|---|---|---|---|---|---|---|---|---|---|---|
| A185 | 60 | M | 14 | 3.8 | 2.8 | 2.8 | 6.0 | 49 | 348/21% | ABC/3TC/ATV | RAL |
| A186 | 44 | M | 12 | 8.0 | 3.2 | 3.2 | 5.4 | 400 | 894/35% | FTC/TDF/EFV | RAL/DRV/r |
| A188 | 55 | M | 22 | 12.0 | 12.0 | 12.0 | 0.9 | 98 | 289/20% | FTC/TDF/ATV/r | RAL/EFV |
| A189 | 55 | M | 15 | 5.2 | 4.9 | 2.2 | 3.3 | 51 | 365/20% | FTC/TDF/ATV/r | RAL/EFV |
| A190* | 33 | M | 11 | 10.3 | 8.4 | 6.9 | 0.5 | 469 | 1552/53% | FTC/TDF/EFV | RAL |
| A195 | 63 | M | 21 | 10.8 | 9.8 | 8.3 | 0.5 | 188 | 437/32% | TDF/ABC/NVP/LPV/r | RAL |
| A196 | 33 | M | 14 | 11.0 | 10.5 | 4.3 | 2.1 | 350 | 751/36% | FTC/TDF/EFV | RAL |
| A198 | 47 | M | 22 | 12.7 | 4.9 | 2.8 | 2.4 | 250 | 518/42% | FTC/TDF/NVP/ATV/r/MVC | RAL |
| Median | 51 | N/A | 14.5 | 10.5 | 6.7 | 3.7 | 2.3 | 219 | 478/34% |
A190 withdrew consent shortly after study entry
VL=viral load
ABC=abacavir; 3TC=lamivudine; ATV=atazanavir; FTC=emtricitabine; TDF=tenofovir; EFV=efavirenz; r=ritonavir; NVP=nevirapine; LPV=lopinavir; MVC=maraviroc; RAL=raltegravir; DRV=darunavir
N/A=not applicable
Plasma HIV RNA
Plasma HIV RNA was undetectable in all study participants using the standard Abbott assay, but was detectable in all participants using the high volume HIV RNA assay with LOD of <0.5 copy/ml [20]. Mean plasma viral loads ranged from 0.5 to 6 copies/ml, with a median of 2.3 copies/ml (Table 1). Intensification resulted in no consistent decrease in plasma HIV RNA (Figure 1A).
Figure 1.
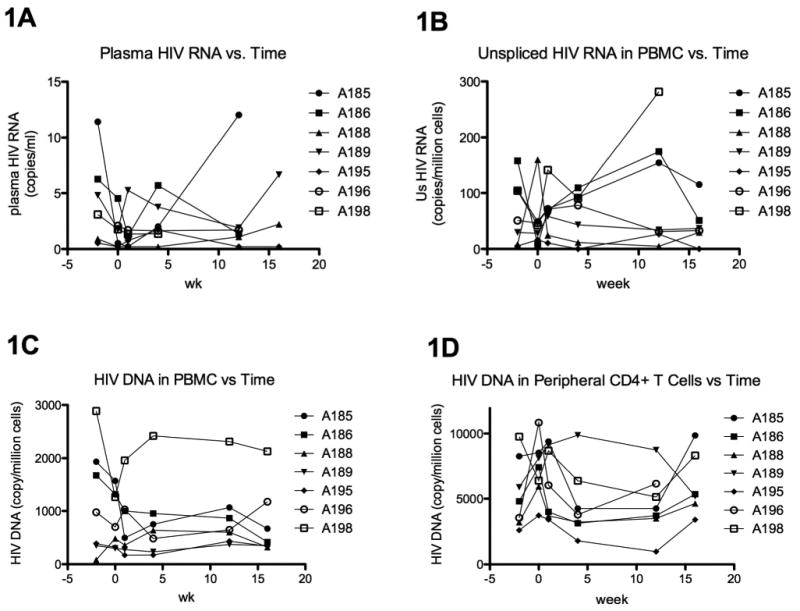
Blood HIV levels as a function of time through week 16. 1A shows the plasma HIV RNA, as measured by the high volume plasma HIV RNA assay. 1B shows the cell-associated unspliced HIV RNA in peripheral blood mononuclear cells (PBMC), as measured by real time reverse transcriptase PCR. 1C-D show the cell-associated HIV DNA in PBMC (1C) and sorted peripheral CD4+ T cells (1D), as measured by real time PCR. The x-axis shows the study week. Intensification was started after week 0 and stopped at week 12.
Cell-associated HIV RNA and DNA in peripheral blood
At baseline, unspliced (Us) HIV RNA was detectable in the blood of all participants, with a median of 44 copies/106 cells in PBMC and 280 copies/106 cells in peripheral CD4+ T cells [20]. There was no consistent change in Us HIV RNA in PBMC (Figure 1B) or peripheral CD4+ T cells (data not shown) during or following intensification. Cell-associated HIV DNA was detectable in the blood of all participants at baseline, with a median of 591 copies/106 cells in PBMC and 6902 copies/106 cells in peripheral CD4+ T cells. Two participants, A185 and A186, appeared to have a decrease in HIV DNA in both PBMC (Figure 1C) and peripheral CD4+ T cells (Figure 1D) during the period of intensification. In both participants, the decrease in HIV DNA in PBMC was sustained after cessation of intensification (week 16), whereas the decrease in HIV DNA in CD4+ T cells was almost completely reversed by week 16.
Cell-associated HIV RNA and DNA in gut
At baseline, unspliced (Us) but not multiply-spliced (Ms) HIV RNA could be detected in the majority of participants at each gut site [20]. Since the yield of CD4+T cells varied between sites and time points, levels of Us HIV RNA /106 cells were normalized to CD4+ T cell content using the results from flow cytometry. From week 0 to week 12, five of 7 participants had a decrease in Us RNA/106 CD4+ T cells in the terminal ileum (Figure 2B). For the seven participants, the mean Us HIV RNA/106 CD4+ T cells in the ileum decreased from 3438 to 682 copies/106 CD4+ T cells (Figure 2A; mean change: -2520 copies/106 CD4+ T cells; median change: -576). There was no consistent change in Us RNA in peripheral CD4+ T cells (mean change: -100 copies/106 CD4+ T cells), duodenum (mean change: 86), colon (mean change: 393), or rectum (mean change: 145).
Figure 2.
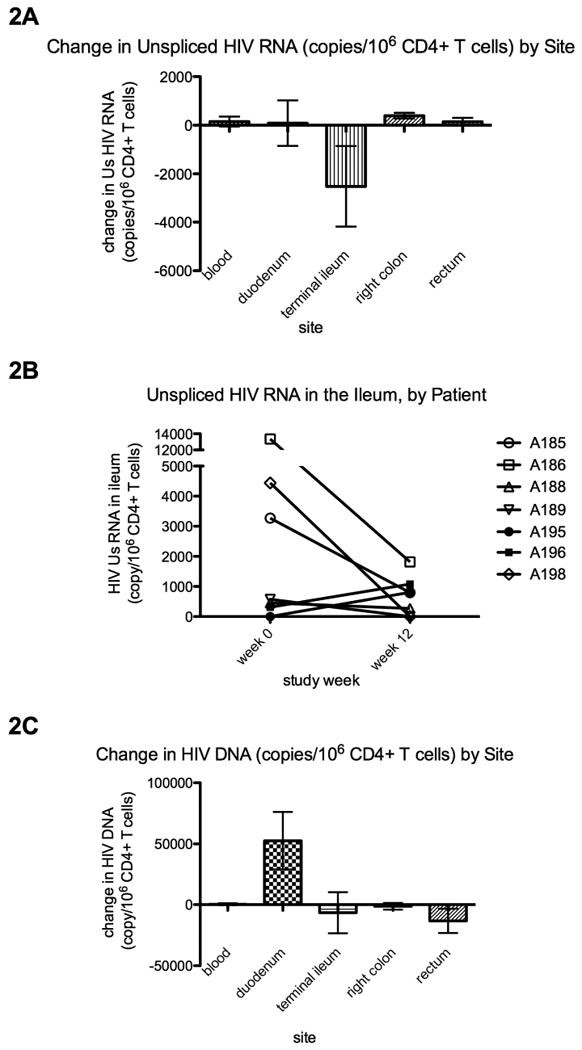
Change in cell-associated unspliced HIV RNA (2A-B) and HIV DNA (2C) per 106 CD4+ T cells. HIV copy numbers were measured by real time PCR, normalized for the total cell input into the PCR (by μg RNA or DNA), and then normalized to the percent of all cells that were CD4+ T cells (by flow cytometry). 2B shows the HIV RNA values in the ileum for each subject at weeks 0 and 12. In 2A and 2C, column heights indicate the average of the changes (week 12-week 0) in HIV copy number per 106 CD4+ T cells, as measured from peripheral blood mononuclear cells or total gut cells (obtained by collagenase digestion of endoscopic biopsies) from each of the four gut sites. Error bars indicate the standard error of measurement (SEM).
At baseline, HIV DNA was detectable in each gut site in the majority of patients [20]. Intensification resulted in no consistent decrease in HIV DNA/106 CD4+ T cells in the PBMC (mean change: 344 copies/106 CD4+ T cells), ileum (mean change: -6580), colon (mean change: -1300), or rectum (mean change: -13260), though all participants had an increase in HIV DNA/106 CD4+ T cells in the duodenum (Figure 2C).
CD4 count and percentage
As measured by the clinical lab, 5 of 7 participants had an increase in the peripheral CD4% (from mean of 29.43% to 30.57%; median change +1%) from week 0 to 12, though there was no consistent change in absolute CD4 counts. Relative numbers of CD4+ T cells (as a percentage of all cells and percentage of CD3+ T cells) were also measured in isolated PBMC and suspensions of gut cells using flow cytometry. Six of 7 participants had an increase in CD4+ T cells (as percent of all) in the terminal ileum (from mean of 1.93% to 2.85%; median change +0.49%) and in the right colon (from mean of 2.55% to 3.85%; median change +1.13%) but not other sites (Figure 3A). Five of 7 participants had an increase in CD4% in the ileum (from mean of 27.46% to 33.52%; median change +9.88%), while changes in other sites were less consistent (Figure 3B).
Figure 3.

Change in CD4+ T cells as a percent of all cells (3A) and as a percent of T cells (3B) by site. The y-axis shows the average difference between the percent of CD4+ T cells at week 12 and the percent at week 0, as measured by flow cytometry from peripheral blood mononuclear cells (PBMC) or total gut cells (obtained by collagenase digestion of endoscopic biopsies) from each of the four gut sites. Error bars indicate the SEM.
Activation of CD4+ and CD8+ T cells
Intensification resulted in a trend towards decreased activation (CD38+, HLA-DR+, and dual+) of CD4+ and CD8+ T cells in all sites, which was greatest for CD38+ and for CD8+ T cells in the PBMC, ileum, and colon. Six of 7 participants had a decrease in CD38+ T cells as percent of CD8+ T cells (Figure 4B) in PBMC (from mean of 40.61% to 36.43%; median change -4.84%) and colon (from mean of 89.90% to 87.90%; median change -1.11%). Five and six (respectively) out of 7 also had a decrease in CD38+HLA-DR+ cells as percent of CD8+ T cells (Figure 4F) in the PBMC (from 15.24% to 13.21%; median change -1.9%) and colon (from 46.94% to 42.63%; median change -4.27%). For both CD4+ and CD8+ T cells, the mean decreases in percent of HLA-DR+ and CD38+HLA-DR+ T cells were greatest in the terminal ileum.
Figure 4.

Change in T cell activation by site. Using flow cytometry, T cell activation was measured by the percent of CD4+ T cells (left column) or CD8+ T cells (right column) that express both CD38 and HLA-DR (4A-B) as well as the percent of the total that express CD38 (4C-D) and the percent of the total that express HLA-DR (4E-F). The y-axis shows the average difference between the percent of activated T cells at week 12 and the percent at week 0, as measured from peripheral blood mononuclear cells (PBMC) or total gut cells (obtained by collagenase digestion of endoscopic biopsies) from the indicated gut sites. Error bars indicate the SEM.
Discussion
The effect of RLG-containing ART intensification on viral burden, T cell reconstitution, and T cell activation was investigated in 7 chronically-infected HIV+ men who had VL<40 copies/ml for a median of 6.7 years. Despite the limitations of study size and sampling, this study provided several pertinent findings. First, we confirmed the observation by others [1, 5, 8, 9, 19] that ART intensification does not reduce HIV RNA in the plasma, even though we intensified with one or 2 new agents and applied an assay with LOD of <0.5 copy/ml. This finding, coupled with sequencing studies that show no evidence of drug resistance and little evolution of the plasma RNA over time [2-4], suggests that low-level plasma virus is not due to ongoing viral replication in circulating lymphocytes.
Second, we extended these findings by showing that intensification results in no consistent change in cell-associated HIV RNA in either blood (PBMC or CD4+ T cells) or in the duodenum, colon, or rectum. This finding suggests that most of the HIV RNA in the blood and many regions of gut is not the result of ongoing replication that can be impacted by short-term intensification with raltegravir-containing regimens. However, in the ileum, which has the highest baseline HIV Us RNA and RNA/DNA ratio, the Us RNA/106 CD4+ T cells decreased in 5 of 7 participants in conjunction with intensification. Supporting the interpretation that intensification affected viral production, we also observed a trend towards an increase in CD4 content in the ileum and a decrease in CD8+ T cell activation in the ileum and blood. While several recent studies argue against productive infection in the blood of ART-suppressed patients, other findings in ART-suppressed patients would be consistent with ongoing replication. These findings include the presence of 2-LTR circles and functional unintegrated HIV DNA [10, 11, 19], the fact that there is more HIV DNA in activated CD4+ T cells than resting CD4+ T cells [12], and the fact that immune activation remains high despite years of ART [13]. Moreover, ART intensification reduces the half life of the latent reservoir [14, 17], reduces plasma RNA [15], increases CD4+ cell counts [15, 16], and reduces immune activation [15-19].
Studies by ourselves and others have shown that HIV DNA per CD4+ T cell is disproportionately concentrated (up to 10-fold higher) in the gut relative to peripheral blood [35], which has been attributed to the presence of cryptic low-level ongoing replication in the gut [35]. If the much higher concentration of HIV DNA in gut CD4+ T cells reflects substantial numbers of newly-infected cells, one would expect a significant proportion of the HIV DNA to be in the labile unintegrated form. If intensification resulted in more complete suppression, one would expect that these labile forms would be cleared [36]. However, we found that intensification resulted in no consistent decrease in HIV DNA in the gut. The lack of change in gut HIV DNA with intensification suggests that most of this DNA represents latently-infected cells, chronically-infected cells, or defective provirus rather than the result of new infectious events that can be prevented by raltegravir.
In 2 participants (A185 and A186), there was a decrease in HIV DNA in both the PBMC and the peripheral CD4+ T cells, which was reversed at week 16 in the CD4+ T cells but not in the PBMC. This finding suggests that HIV DNA may have a different nature, origin, or stability in different cell types within the blood. Of note, this proportion is similar to the proportion of patients undergoing raltegravir intensification who experienced transient rises in the concentration of 2-LTR circles, a finding which was attributed to recent infections aborted by raltegravir [19].
Findings from this study raise new questions. If there is ongoing replication in the ileum, then why is a reduction in RNA not observed in the plasma? The simplest explanation is that the ileum contributes only a small fraction of the total HIV RNA that is measurable in the plasma, perhaps because there is relative compartmentalization (or delayed equilibration) between the two compartments or infection is aborted after local replication in the ileum. Other mechanisms, such as reactivation of latently-infected cells, release of virions captured on the follicular dendritic network, or chronic transcriptionally-active cells, could be responsible for the majority of residual HIV RNA in the blood. It is also unclear why ART intensification had differential effects in the four gut sites. Gut sites could differ in penetration of ART agents, immunologic environments, or the composition of CD4+ T cell populations. The ileum, which is an immune inductive site and is enriched for lymphoid aggregates, seems disproportionately involved in other inflammatory processes such as Crohn's disease and enteric infection with tuberculosis, Salmonella, and Yersinia. Close proximity of CD4+ T cells in the lymphoid aggregates may create an environment that is more conducive to cell-to-cell spread of HIV [37-46]. However, one must question whether low-level ongoing replication in the ileum has true consequences for HIV persistence and eradication strategies.
Limitations of our study must be acknowledged. First, we had a relatively small number of participants and were unable to sample extensively at all 4 gut sites. However, 6 to 9 biopsies from each site were used to isolate gut cells, and the relative and absolute levels of HIV and immune markers were remarkably consistent from week 0 to 12. Second, there was some heterogeneity in baseline clinical characteristics, entry regimens, and intensification regimens, which may account for some of the differences in responses to intensification. Third, the period of intensification may have been too short relative to the clearance rate of virions or newly-infected cells. Fourth, inflammation and microbial leakage from the biopsies could have confounded the results and could perhaps account for the observed increase in HIV DNA in the duodenum. Finally, all studies aimed to detect low-level replication suffer from the difficulty that such infectious events could occur in minute, temporally and spatially-discrete foci [47].
Despite these limitations, the results add to our understanding of the multiple mechanisms that contribute to the persistence of HIV in patients on ART. The lack of significant intensification-mediated changes in viral RNA in blood and most gut sites implies a process other than the classic model of ongoing replication, such as reactivation from latency or chronic persistence of virions and/or chronically-infected, transcriptionally-active cells. At the same time, the changes in immune activation and CD4 counts would be consistent with ongoing replication in some patients, either in the ileum or at another site. Future studies are needed to confirm the presence and site(s) of ongoing replication and to identify clinical and virological factors that may predict the contribution of ongoing replication to viral persistence. While some patients may potentially derive benefit from intensification of ART, other strategies will be necessary for viral eradication.
Acknowledgments
We thank the following: 1) the study participants; 2) PLUS staff members Michele Downing and Marc Gould; 3) VA study nurses Sandra Charles and Linda Adams; 4) members of the Wong lab (including Alex L. M. Choi, Peilin Li, and Katsuya Fujimoto), the SFVAMC GI Endoscopy Unit, the UCSF Core Immunology Lab (including Lorrie Epling, Valerie Girling, and Terence Ho), and the San Francisco Department of Public Health; and 5) the NIH AIDS Research Reagent Program. This work was supported in part by the U.S. Department of Veterans Affairs (VA Merit Award [JW/SY]), the National Institute of Health (NIH grants P30-AI027763 [SY], NS051145 [JW/SY] and T32 AI60530 [DH/SY]), and the Swiss National Science Foundation (3100A0-112670 [MF] and 324730-130865 [HFG]).
Sources of support: the U.S. Department of Veterans Affairs (VA), the National Institute of Health (NIH), and the Swiss National Science Foundation.
Footnotes
Disclaimers: CBH is an advisor to Merck and is on their speakers' bureau. No other author has a commercial or other association that may pose a conflict of interest. All research was conducted within the guidelines of ethical principles, local legislation, and the local institutional review board (IRB).
SAY, AS, KM, HL, CBH, ES, HFG, MF, JKW, and DVH contributed to the study design. AS and KM performed the endoscopies. SAY and SG performed the laboratory work. SAY, SG, MP, ES, HFG, MF, JKW, and DVH contributed to analysis and interpretation of data. SAY, SG, JKW, and DVH wrote the manuscript. All authors contributed to critical review of the manuscript.
References
- 1.Dinoso JB, Kim SY, Wiegand AM, Palmer SE, Gange SJ, Cranmer L, et al. Treatment intensification does not reduce residual HIV-1 viremia in patients on highly active antiretroviral therapy. Proc Natl Acad Sci U S A. 2009 doi: 10.1073/pnas.0903107106. [DOI] [PMC free article] [PubMed] [Google Scholar]
- 2.Kieffer TL, Finucane MM, Nettles RE, Quinn TC, Broman KW, Ray SC, et al. Genotypic analysis of HIV-1 drug resistance at the limit of detection: virus production without evolution in treated adults with undetectable HIV loads. J Infect Dis. 2004;189:1452–1465. doi: 10.1086/382488. [DOI] [PubMed] [Google Scholar]
- 3.Persaud D, Siberry GK, Ahonkhai A, Kajdas J, Monie D, Hutton N, et al. Continued production of drug-sensitive human immunodeficiency virus type 1 in children on combination antiretroviral therapy who have undetectable viral loads. J Virol. 2004;78:968–979. doi: 10.1128/JVI.78.2.968-979.2004. [DOI] [PMC free article] [PubMed] [Google Scholar]
- 4.Joos B, Fischer M, Kuster H, Pillai SK, Wong JK, Boni J, et al. HIV rebounds from latently infected cells, rather than from continuing low-level replication. Proc Natl Acad Sci U S A. 2008;105:16725–16730. doi: 10.1073/pnas.0804192105. [DOI] [PMC free article] [PubMed] [Google Scholar]
- 5.Wiegand A, Cossarini F, Poethke C, Kearney M, Spindler J, O'shea A, et al. Raltegravir intensification does not reduce persistent HIV-1 viremia in treatment-experienced patients. 17th Conference on Retroviruses and Opportunistic Infections (CROI 2010); 2010. [Google Scholar]
- 6.Joly V, Fagard C, Descamps D, Colin de Verdiere N, Raffi F, Tabuteau S, et al. Intensification of HAART through the addition of enfuvirtide in naive HIV-infected patients with severe immunosuppression does not improve immunologic response: results of a prospective randomized multicenter trial (APOLLO-ANRS 130). 17th Conference on Retroviruses and Opportunistic Infections (CROI 2010); 2010. [Google Scholar]
- 7.Evering T, Mehandru S, Poles M, Racz P, Tenner-Racz K, Mohri H, et al. Antiviral and immunologic effects of intensification of suppressive ART with maraviroc, a CCR5 antagonist. 17th Conference on Retroviruses and Opportunistic Infections (CROI 2010); 2010. [Google Scholar]
- 8.Hatano H, Hayes T, Dahl V, Sinclair E, Lee TH, Hunt P, et al. Raltegravir intensification in antiretroviral-treated patients exhibiting a suboptimal CD4+ T cell response. 17th Conference on Retroviruses and Opportunistic Infections (CROI 2010); 2010. [Google Scholar]
- 9.McMahon D, Jones J, Wiegand A, Gange SJ, Kearney M, Palmer S, et al. Short-course raltegravir intensification does not reduce persistent low-level viremia in patients with HIV-1 suppression during receipt of combination antiretroviral therapy. Clin Infect Dis. 2010;50:912–919. doi: 10.1086/650749. [DOI] [PMC free article] [PubMed] [Google Scholar]
- 10.Sharkey ME, Teo I, Greenough T, Sharova N, Lazuriaga K, Sullivan J, et al. Persistence of episomal HIV-1 infection intermediates in patients on highly active anti-retroviral therapy. Nature Medicine. 2000;6:76–81. doi: 10.1038/71569. [DOI] [PMC free article] [PubMed] [Google Scholar]
- 11.Petitjean G, Al Tabaa Y, Tuaillon E, Mettling C, Baillat V, Reynes J, et al. Unintegrated HIV-1 provides an inducible and functional reservoir in untreated and highly active antiretroviral therapy-treated patients. Retrovirology. 2007;4:60. doi: 10.1186/1742-4690-4-60. [DOI] [PMC free article] [PubMed] [Google Scholar]
- 12.Chun TW, Nickle DC, Justement JS, Large D, Semerjian A, Curlin ME, et al. HIV-infected individuals receiving effective antiviral therapy for extended periods of time continually replenish their viral reservoir. J Clin Invest. 2005;115:3250–3255. doi: 10.1172/JCI26197. [DOI] [PMC free article] [PubMed] [Google Scholar]
- 13.Hunt PW, Martin JN, Sinclair E, Bredt B, Hagos E, Lampiris H, Deeks SG. T cell activation is associated with lower CD4+ T cell gains in human immunodeficiency virus-infected patients with sustained viral suppression during antiretroviral therapy. J Infect Dis. 2003;187:1534–1543. doi: 10.1086/374786. [DOI] [PubMed] [Google Scholar]
- 14.Ramratnam B, Ribeiro R, He T, Chung C, Simon V, Vanderhoeven J, et al. Intensification of antiretroviral therapy accelerates the decay of the HIV-1 latent reservoir and decreases, but does not eliminate, ongoing virus replication. J Acquir Immune Defic Syndr. 2004;35:33–37. doi: 10.1097/00126334-200401010-00004. [DOI] [PubMed] [Google Scholar]
- 15.Havlir DV, Strain MC, Clerici M, Ignacio C, Trabattoni D, Ferrante P, Wong JK. Productive infection maintains a dynamic steady state of residual viremia in human immunodeficiency virus type 1-infected persons treated with suppressive antiretroviral therapy for five years. J Virol. 2003;77:11212–11219. doi: 10.1128/JVI.77.20.11212-11219.2003. [DOI] [PMC free article] [PubMed] [Google Scholar]
- 16.Kolber MA, Saenz MO, Tanner TJ, Arheart KL, Pahwa S, Liu H. Intensification of a suppressive HAART regimen increases CD4 counts and decreases CD8+ T-cell activation. Clin Immunol. 2008;126:315–321. doi: 10.1016/j.clim.2007.10.002. [DOI] [PubMed] [Google Scholar]
- 17.Gutierrez C, Diaz L, Hernandez-Novoa B, Vallejo A, Page C, Lorente R, et al. Effect of the intensification with a CCR5 antagonist on the decay of the latent reservoir and residual viremia. 17th Conference on Retroviruses and Opportunistic Infections (CROI 2010); 2010. [Google Scholar]
- 18.Wilkin T, Lalama C, Tenorio A, Landay A, Ribaudo H, McKinnon J, et al. Maraviroc intensification for suboptimal CD4+ cell response despite sustained virologic suppression: ACTG 5256. 17th Conference on Retroviruses and Opportunistic Infections (CROI 2010); 2010. [Google Scholar]
- 19.Buzon M, Massanella M, Llibre J, Esteve A, Puertas M, Palmer S, et al. HIV-1 replication and immune dynamics are impacted by raltegravir intensification of HAART-suppressed patients. 17th Conference on Retroviruses and Opportunistic Infections (CROI 2010); 2010. [Google Scholar]
- 20.Yukl S, Gianella S, Sinclair E, Epling L, Li Q, Duan L, et al. Differences in HIV burden and immune activation within the gut of patients on suppressive antiretroviral therapy. Journal of Infectious Diseases. 2010 February; doi: 10.1086/656722. submitted. [DOI] [PMC free article] [PubMed] [Google Scholar]
- 21.Critchfield JW, Lemongello D, Walker DH, Garcia JC, Asmuth DM, Pollard RB, Shacklett BL. Multifunctional human immunodeficiency virus (HIV) gag-specific CD8+ T-cell responses in rectal mucosa and peripheral blood mononuclear cells during chronic HIV type 1 infection. J Virol. 2007;81:5460–5471. doi: 10.1128/JVI.02535-06. [DOI] [PMC free article] [PubMed] [Google Scholar]
- 22.Shacklett BL, Critchfield JW, Lemongello D. Isolating mucosal lymphocytes from biopsy tissue for cellular immunology assays. Methods Mol Biol. 2009;485:347–356. doi: 10.1007/978-1-59745-170-3_23. [DOI] [PubMed] [Google Scholar]
- 23.Anton PA, Poles MA, Elliott J, Mao SH, McGowan I, Lenz HJ, Chen IS. Sensitive and reproducible quantitation of mucosal HIV-1 RNA and DNA viral burden in patients with detectable and undetectable plasma viral HIV-1 RNA using endoscopic biopsies. J Virol Methods. 2001;95:65–79. doi: 10.1016/s0166-0934(01)00295-6. [DOI] [PubMed] [Google Scholar]
- 24.Avettand-Fenoel V, Prazuck T, Hocqueloux L, Melard A, Michau C, Kerdraon R, et al. HIV-DNA in rectal cells is well correlated with HIV-DNA in blood in different groups of patients, including long-term non-progressors. AIDS. 2008;22:1880–1882. doi: 10.1097/QAD.0b013e32830fbdbc. [DOI] [PubMed] [Google Scholar]
- 25.Hunt PW, Brenchley J, Sinclair E, McCune JM, Roland M, Page-Shafer K, et al. Relationship between T cell activation and CD4+ T cell count in HIV-seropositive individuals with undetectable plasma HIV RNA levels in the absence of therapy. J Infect Dis. 2008;197:126–133. doi: 10.1086/524143. [DOI] [PMC free article] [PubMed] [Google Scholar]
- 26.Swanson P, Huang S, Abravaya K, de Mendoza C, Soriano V, Devare SG, Hackett J., Jr Evaluation of performance across the dynamic range of the Abbott RealTime HIV-1 assay as compared to VERSANT HIV-1 RNA 3.0 and AMPLICOR HIV-1 MONITOR v1.5 using serial dilutions of 39 group M and O viruses. J Virol Methods. 2007;141:49–57. doi: 10.1016/j.jviromet.2006.11.026. [DOI] [PubMed] [Google Scholar]
- 27.Tang N, Huang S, Salituro J, Mak WB, Cloherty G, Johanson J, et al. A RealTime HIV-1 viral load assay for automated quantitation of HIV-1 RNA in genetically diverse group M subtypes A-H, group O and group N samples. J Virol Methods. 2007;146:236–245. doi: 10.1016/j.jviromet.2007.07.003. [DOI] [PubMed] [Google Scholar]
- 28.Yukl S, Li P, Fujimoto K, Pandori M, Havlir D, Wong J. Adaptation of the Abbott m2000 assay to detect plasma HIV-1 RNA at levels of less than a single copy per ml. J Acquir Immune Defic Syndr. 2010 submitted. [Google Scholar]
- 29.Li P, Ruel T, Fujimoto K, Hatano H, Yukl S, Eller LA, et al. Novel application of Locked Nucleic Acid (LNA) chemistry for a Taqman assay to measure diverse HIV-1 subtypes. Journal of Virological Methods. 2010 January; doi: 10.1016/j.jviromet.2010.09.011. submitted. [DOI] [PMC free article] [PubMed] [Google Scholar]
- 30.Fischer M, Joos B, Niederost B, Kaiser P, Hafner R, von Wyl V, et al. Biphasic decay kinetics suggest progressive slowing in turnover of latently HIV-1 infected cells during antiretroviral therapy. Retrovirology. 2008;5:107. doi: 10.1186/1742-4690-5-107. [DOI] [PMC free article] [PubMed] [Google Scholar]
- 31.Kaiser P, Joos B, Niederost B, Weber R, Gunthard HF, Fischer M. Productive human immunodeficiency virus type 1 infection in peripheral blood predominantly takes place in CD4/CD8 double-negative T lymphocytes. J Virol. 2007;81:9693–9706. doi: 10.1128/JVI.00492-07. [DOI] [PMC free article] [PubMed] [Google Scholar]
- 32.Althaus CF, Gianella S, Rieder P, von Wyl V, Kouyos RD, Niederost B, et al. Rational design of HIV-1 fluorescent hydrolysis probes considering phylogenetic variation and probe performance. J Virol Methods. doi: 10.1016/j.jviromet.2010.01.012. [DOI] [PubMed] [Google Scholar]
- 33.Fischer M, Joos B, Hirschel B, Bleiber G, Weber R, Gunthard HF. Cellular viral rebound after cessation of potent antiretroviral therapy predicted by levels of multiply spliced HIV-1 RNA encoding nef. J Infect Dis. 2004;190:1979–1988. doi: 10.1086/425983. [DOI] [PubMed] [Google Scholar]
- 34.Fischer M, Huber W, Kallivroussis A, Ott P, Opravil M, Luthy R, et al. Highly sensitive methods for quantitation of human immunodeficiency virus type 1 RNA from plasma, cells, and tissues. J Clin Microbiol. 1999;37:1260–1264. doi: 10.1128/jcm.37.5.1260-1264.1999. [DOI] [PMC free article] [PubMed] [Google Scholar]
- 35.Chun TW, Nickle DC, Justement JS, Meyers JH, Roby G, Hallahan CW, et al. Persistence of HIV in Gut-Associated Lymphoid Tissue despite Long-Term Antiretroviral Therapy. J Infect Dis. 2008 doi: 10.1086/527324. [DOI] [PubMed] [Google Scholar]
- 36.Koelsch KK, Liu L, Haubrich R, May S, Havlir D, Gunthard HF, et al. Dynamics of total, linear nonintegrated, and integrated HIV-1 DNA in vivo and in vitro. J Infect Dis. 2008;197:411–419. doi: 10.1086/525283. [DOI] [PubMed] [Google Scholar]
- 37.Phillips DM. The role of cell-to-cell transmission in HIV infection. AIDS. 1994;8:719–731. doi: 10.1097/00002030-199406000-00001. [DOI] [PubMed] [Google Scholar]
- 38.Grossman Z, Feinberg M, Kuznetsov V, Dimitrov D, Paul W. HIV infection: how effective is drug combination treatment? Immunol Today. 1998;19:528–532. doi: 10.1016/s0167-5699(98)01353-x. [DOI] [PubMed] [Google Scholar]
- 39.Piguet V, Sattentau Q. Dangerous liaisons at the virological synapse. J Clin Invest. 2004;114:605–610. doi: 10.1172/JCI22812. [DOI] [PMC free article] [PubMed] [Google Scholar]
- 40.Jolly C, Sattentau QJ. Retroviral spread by induction of virological synapses. Traffic. 2004;5:643–650. doi: 10.1111/j.1600-0854.2004.00209.x. [DOI] [PubMed] [Google Scholar]
- 41.Haller C, Fackler OT. HIV-1 at the immunological and T-lymphocytic virological synapse. Biol Chem. 2008;389:1253–1260. doi: 10.1515/BC.2008.143. [DOI] [PubMed] [Google Scholar]
- 42.Sattentau Q. Avoiding the void: cell-to-cell spread of human viruses. Nat Rev Microbiol. 2008;6:815–826. doi: 10.1038/nrmicro1972. [DOI] [PubMed] [Google Scholar]
- 43.Martin N, Sattentau Q. Cell-to-cell HIV-1 spread and its implications for immune evasion. Curr Opin HIV AIDS. 2009;4:143–149. doi: 10.1097/COH.0b013e328322f94a. [DOI] [PubMed] [Google Scholar]
- 44.Rudnicka D, Feldmann J, Porrot F, Wietgrefe S, Guadagnini S, Prevost MC, et al. Simultaneous cell-to-cell transmission of human immunodeficiency virus to multiple targets through polysynapses. J Virol. 2009;83:6234–6246. doi: 10.1128/JVI.00282-09. [DOI] [PMC free article] [PubMed] [Google Scholar]
- 45.Puigdomenech I, Massanella M, Cabrera C, Clotet B, Blanco J. On the steps of cell-to-cell HIV transmission between CD4 T cells. Retrovirology. 2009;6:89. doi: 10.1186/1742-4690-6-89. [DOI] [PMC free article] [PubMed] [Google Scholar]
- 46.Sol-Foulon N, Moris A, Nobile C, Boccaccio C, Engering A, Abastado JP, et al. HIV-1 Nef-induced upregulation of DC-SIGN in dendritic cells promotes lymphocyte clustering and viral spread. Immunity. 2002;16:145–155. doi: 10.1016/s1074-7613(02)00260-1. [DOI] [PubMed] [Google Scholar]
- 47.Grossman Z, Polis M, Feinberg MB, Grossman Z, Levi I, Jankelevich S, et al. Ongoing HIV dissemination during HAART. Nat Med. 1999;5:1099–1104. doi: 10.1038/13410. [DOI] [PubMed] [Google Scholar]