

Abstract
Although structure and sequence signatures in ribosomal RNA and proteins are defining characteristics of the three domains of life and instrumental in constructing the modern phylogeny, little is known about their functional roles in the ribosome. In this work, the largest coevolving RNA/protein signatures in the bacterial 30S ribosome are investigated both experimentally and computationally through all-atom molecular-dynamics simulations. The complex includes the N-terminal fragment of the ribosomal protein S4, which is a primary binding protein that initiates 30S small subunit assembly from the 5′ domain, and helix 16 (h16), which is part of the five-way junction in 16S rRNA. Our results show that the S4 N-terminus signature is intrinsically disordered in solution, whereas h16 is relatively stable by itself. The dynamic disordered property of the protein is exploited to couple the folding and binding process to the five-way junction, and the results provide insight into the mechanism for the early and fast binding of S4 in the assembly of the ribosomal small subunit.
Introduction
Ribosomal signatures, idiosyncrasies in the ribosomal RNA (rRNA) and protein (r-protein) sequences, are characteristic of the three individual domains of life: Bacteria, Archaea, and Eucarya. First identified by Carl Woese more than 20 years ago (1,2), the positions of signatures in the rRNA of the ribosomal small subunit (SSU) were instrumental in construction of the universal phylogenetic tree that is still used today to classify biological organisms (3). As such, these molecular fossils offer insight into the early evolution of the translational apparatus. With the rapid growth of genomic and structural data, the definition of signatures has been extended to include structure motifs in the rRNA and r-proteins and arrangements of genomic content that are unique to one domain of life. In a study that included more than 90,000 16S and 23S sequences, Roberts et al. (4) demonstrated that the sequence and structure signatures of rRNA account for 50% of the phylogenetic separation between Bacteria and Archaea. Correlations between the rRNA and r-protein signatures show that the rRNA signatures coevolved with both domain-specific r-proteins and inserts in universal r-proteins. The largest continuous bacterial rRNA structure signature in the SSU with such a coevolutionary protein partner is found in helix 16 (h16) of the 16S rRNA 5′ domain, which is held together by the universal r-protein S4. As shown in Fig. 1, the N-terminal bacterial signature of S4 (S4N) interacts predominantly with the rRNA structure signature h16. S4 also makes a few contacts with h18, but with the exception of basepair C511⋅G540, none of these contacts are rRNA structure signatures.
Figure 1.
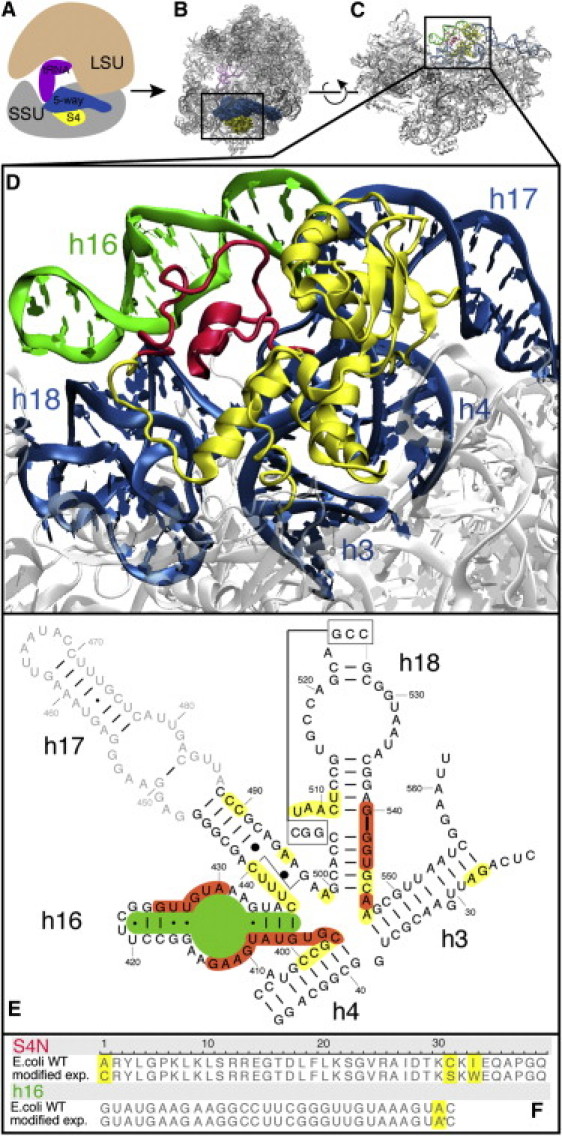
Visualization of the five-way junction and S4 on the ribosome. Shown are (A) a cartoon representation and (B) the crystal structure of the ribosome. Both plots show the five-way junction colored dark blue and S4 colored yellow. (C) The five-way junction, S4, and signature regions S4N (red) and h16 (green) on the ribosomal SSU. This figure has been rotated by 90° around the horizontal axis with respect to A and B. (D) A blow-up of the 3D structure for the system studied here, with the same coloring. (E) In the secondary structure diagram, bases colored orange and yellow are in contact with the S4N and S4C, respectively. (F) S4N and h16 sequences in the wild-type E. coli ribosome and the modified versions. Residues that have been mutated in this study are highlighted.
The Nomura map developed in the 1970s (5) showed that the assembly of the SSU in bacteria is dependent on the presence of S4 and five other primary binding proteins that must be in place before the remaining r-proteins can be incorporated. S4, S17, and S20 bind directly to the 5′ domain of the 16S rRNA, and the other primary binders, S15/S8 and S7, bind to the central and 3′ domains, respectively. Two of them, S4 and S7, were later identified as the only assembly-initiator proteins based on their noncooperative binding during the onset of assembly (6), and the effects of S7 binding on ribosomal stability were subsequently studied in silico through coarse-grained molecular-dynamics (MD) simulations (7). More recently, the Nomura dependency map was extended to include information about the kinetics and folding pathways for assembly of the 30S ribosome. Using pulse-chase experiments monitored by quantitative mass spectrometry, Talkington et al. (8) and Sykes and Williamson (9) determined the binding rates of each r-protein in the SSU and found that the 5′ domain proteins, especially S4, bind more quickly than the proteins in the central or 3′ domain, indicating a 5′ to 3′ directionality in the assembly process.
Folding of the 5′ domain of 16S rRNA was studied via time-resolved hydroxyl radical footprinting, which established a time dependence for the formation of rRNA tertiary contacts (10). Without any proteins, the structure signature h16, the binding site of the N-terminal S4 bacterial signature, folds earliest under a wide range of ion concentrations. The minimal rRNA-binding site for the complete S4 (11) was established from deletion and mutation studies on RNA. The measured binding free energies showed that S4 binds tightly to the five-way junction formed by h3, h4, h16, h17, and h18, and that truncations in the first three helices give the largest variations in binding free energies.
The critical role of S4 in the early assembly of the SSU, and the existence of RAM mutations on the S4 (12) suggest that the interactions between the signatures in this region are functionally important for ribosomal assembly and the fidelity of protein synthesis in bacteria; however, further experiments and simulations are required to characterize these interactions. Since both computational and experimental approaches are needed to elucidate the function of protein/RNA systems (13), we employed a combination of in silico and in vitro methods in this work. We performed a detailed study of the dynamics of the five-way junction and S4 using all-atom MD simulation with a particular emphasis on the signatures h16 and S4N. Circular dichroism (CD) and fluorescence spectroscopy experiments were performed in conjunction with the computational work, and qualitative agreement between the computational and experimental results gives insight into the intrinsic disorder of the signature on S4 and the flexible nature of the interactions between the RNA/protein signatures. Our results are consistent with a fly-casting mechanism in which folding of S4N and partial refolding of the five-way junction are induced by S4N binding to h16, and suggest that this signature region on the ribosome was a domain-specific invention in evolution aimed at speeding up the molecular recognition between the rRNA and the early binding r-protein S4.
Material and Methods
Protein and RNA design and sample preparation
A previous evolutionary analysis of S4 (14) indicated that the flexible N-terminus signature extends from residue 1 to ∼45 in Escherichia coli. However, to study the interaction with h16 in this study, we chose the S4N fragment such that the last residue was within 5 Å of the h16 in the crystal structure. The fragment of the wild-type E. coli S4 from positions 1–39 was ordered from Genscript (Piscataway, NJ). To make a fluorescence probe within the protein for bulk measurements, the isoleucine at position 33 was replaced by tryptophan. The cysteine at position 31 was replaced by serine, and the alanine at position 1 was replaced by cysteine. These two cysteine mutations were introduced to facilitate the labeling of the N-terminus with an Alexa-488 fluorophore for future single-molecule experiments. The mutated residues were carefully chosen according to the sequence alignment of S4 provided in Chen et al. (14), ensuring minimal perturbation from native behavior. The N-terminus of the fragment was acetylated and the C-terminus was amidated.
The h16 RNA fragment from positions 406–436 was ordered from Integrated DNA Technologies (Coralville, IA) with two modifications: the adenine at position 435 was changed to 2-aminopurine (2AP), a fluorescent analog of adenine that has been shown to not perturb RNA folding (15), and a nonfluorescent quencher (Iowa Black FQ) was attached to the 5′ end of the molecule. The wild-type and modified sequences of both S4N and h16 are shown in Fig. 1.
Standard PE buffer (10 mM sodium phosphate and 0.1 mM EDTA-Na2, pH 7.1) was used for all of the experiments performed in this study.
Experimental measurements
Absorbance thermal melts of the 1μM h16 solution were performed in a 1 cm path length cell with the use of a spectropolarimeter (Jasco, Easton, MD). Absorbance intensities were measured at 260 nm, and the resulting curve was fitted to a two-state thermodynamic heat capacity model (16). The determination of the unfolding transition temperature is described in detail in the Supporting Material.
Fluorescence melts were performed using a Cary Eclipse fluorescence spectrophotomer (Varian, Palo Alto, CA). An excitation wavelength of 280 nm was used and the spectra were scanned from 320 nm to 440 nm. The temperature was increased at 5°C intervals. The integrated spectrum was used for analysis, and the linear native signal baseline was subtracted from the h16 fluorescence melt to make the unfolding transition more obvious.
Dilution measurements were performed with a Cary Eclipse fluorescence spectrophotometer (Varian, Palo Alto, CA). Excited at 280 nm, the fluorescence spectrum was measured for 600 μL of a 7.5 μM sample of the 1:1 mixture of S4N and h16 at room temperature (22°C). Thereafter, 100 μL of the sample solution were removed from the cuvette and replaced with 100 μL of buffer; the sample was stirred and the spectrum was measured again. This was repeated until a concentration of 0.34 μM was achieved. The spectrum was baseline-subtracted and then fitted to a two-component thermodynamic model to obtain the binding constant K and dissociation constant K−1. Details of the model and formula used to calculate K are provided in the Supporting Material.
CD spectra were measured for a 20 μM solution of the protein and RNA molecules separately as well as for the 1:1 mixture of the two molecules in a 1 mm path length cuvette using a spectropolarimeter (Jasco, Easton, MD). The CD spectra were scanned from 190 to 300 nm.
Molecular modeling and simulation
Coordinates for S4 and the five-way junction in 16S rRNA were taken from the crystal structure of E. coli ribosomal SSU at 3.22 Å resolution (PDB ID 2I2P (17)). The Ile33Trp, Cys31Ser, and Ala1Cys mutations on the protein and A435(2AP) mutation on the RNA sequence were made according to sequences chosen to perform the experiments (Fig. 1) in the signature system (S4N and h16). Parameters for 2AP were developed by analogy with the separate adenine and lysine parameters already present in the CHARMM27 force field. The five-way junction system, including h3, h4, h16, h18, a truncated h17, a five-membered loop CUCAA that caps h4, and a seven-membered loop UUUUGCU that caps the truncated h17, was assembled according to the minimal S4 binding model suggested by Bellur and Woodson (11). The two additional loops were taken from the E. coli SSU (PDB ID 2I2P, residues 618–622) and glutamine tRNA (PDB ID 2RD2, residues 932–938) with two mutations (C934U and A937C), respectively.
All systems studied in this work were neutralized with Na+ or Cl− (18) and prepared in VMD (19) according to the protein/RNA simulation protocol described by Eargle et al. (20). We added 10 mM NaCl to the final solution according to experimental conditions, and ran the equilibration simulations using NAMD2 (21) with periodic boundary conditions and the NPT ensemble with pressure set to 1 atmosphere and temperature set to 298 K. Electrostatics were calculated with the particle mesh Ewald method. The van der Waals interactions were calculated using a switching distance of 12 Å and a cutoff of 14 Å.
Ten 50-ns MD simulations each were run for S4N, h16, and the S4N/h16 complex (referred to as unbound S4N runs, unbound h16 runs, and complex runs, respectively). Four additional runs were performed to establish reference points: two 50-ns runs for the full-length, unbound S4 (∼205 residues); one 50-ns run for the five-way junction; and one 50-ns run for the complex of the five-way junction and full-length S4. Additional details of the methodology and parameters are provided in the Supporting Material.
For comparison with the experimental melting data, unfolding of the S4N was also simulated. After 20 ns of equilibration, the temperature was raised linearly from 298K to 358K through 100 5-ps steps. Production runs at 358K were carried out for another 99.5 ns to achieve a total of 100 ns of unfolding simulations.
Basepairing and base-stacking interaction determination
Basepairing interactions were determined using 3DNA (22), which reports both canonical and noncanonical basepairs. Hydrogen-bond patterns were also recorded for each basepair, including those between atoms on the base and atoms on the sugar ring or backbone. Because the base-stacking information given in 3DNA is limited to the overlapping areas of successive basepairs, we developed a base-stacking detection program to include the occurrence of stacking interactions between bases not involved in basepairing. The criteria were based on the geometric measures established by Gabb et al. (23), with slightly relaxed cutoff values obtained from Gendron et al. (24) to incorporate the intrinsic RNA structure fluctuations. The three criteria were as follows: 1) the distance between the geometric centers of the two base rings should be <5.5 Å; 2) the angle between the base normal vectors of the two base rings should be <30°; and 3) the angle between one of the two base normal vectors and the vector connecting the two ring geometric centers should be <40°. Both rings in the purine bases were calculated individually, and if one of the rings met all of the above criteria, the base was considered stacked.
Results and Discussion
The N-terminal signature of S4 is dynamically disordered
The interactions between S4N and h16 in the crystal structure from E. coli will serve as a reference for the simulations and experiments on the signature complex. The 39-residue S4N consists of a short α-helix (Lys7–Glu14) followed by an unstructured loop with two helical turns. In the crystal structure of the Thermus thermophilus 30S subunit (PDB ID 2J00 (25)) and sequences of some other bacteria, this region of S4 contains a zinc-finger motif in which a zinc ion stabilizes the short helix and the two helical turns. Although this motif is partially missing in E. coli, the eight-residue helix is stable without the presence of metal ions. Like other r-proteins, S4 is highly charged. In E. coli, there are nine positively charged amino acids (arginine/lysine) and four negatively charged ones (aspartate/glutamate), comprising one-third of the total number of residues in this segment. In the crystal structure of the complex, these charged residues sit on opposite sides of the S4N, with the positively (negatively) charged ones oriented toward (away from) the S4N/h16 contact interface. In the crystal structure, no salt bridges are present within the S4N, but salt bridges do exist between Glu14 and Arg55 on the first helix of the C-terminal domain of S4, between Arg2 and the region 5′ to h16, and between Arg13 and h18. In addition, two pairs of residues, Arg13-Glu34 and Asp28-Lys30, are positioned relatively close to each other so that transient salt bridges form during the simulations, as shown in Table S2 and Fig. S5.
The MD simulations reveal distinct behaviors in the two domains of unbound S4: the stability of its C-terminal domain and the disorder of its N-terminal fragment. As shown in Fig. 2 A, residues in the C-terminal domain have small RMSD values irrespective of the alignment method used. The shape of the curve correlates well with the secondary structure of the protein, with the flat regions corresponding to helices and the peaks corresponding to loops. In contrast, the RMSD per residue in the S4N region shows large fluctuations.
Figure 2.
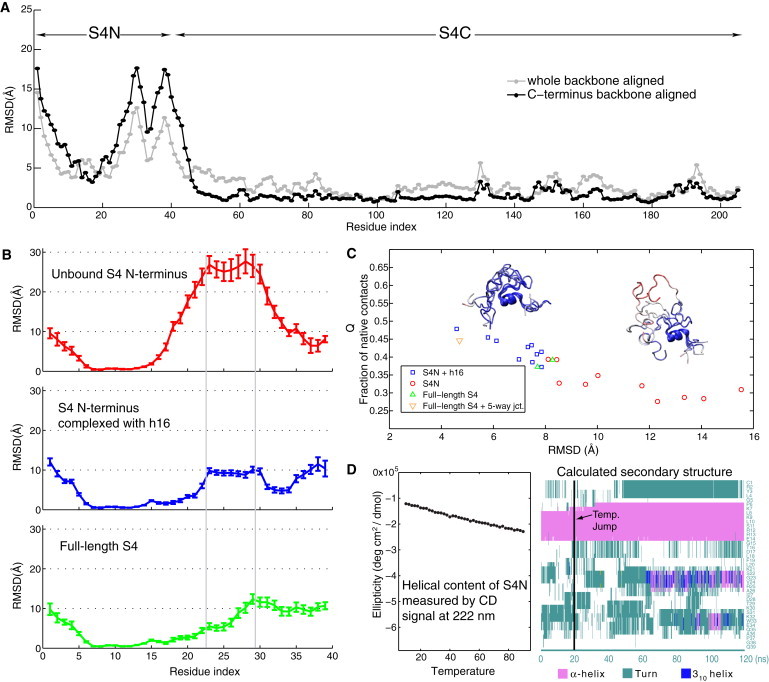
Backbone and secondary structure fluctuations of S4N. (A) The RMSD per residue shown in the plot is an average of two independent simulations of the full-length S4. (B) The RMSD per residue for S4N was calculated from representative replicates. (C) Time-averaged Q-value plotted against backbone RMSD for all simulations involving S4N. Each marker represents one particular replicate. Inset figures are representative conformations sampled from complex (left) and unbound (right) simulations and colored by RMSD per residue. (D) CD signal at 222 nm measured for S4N alone when temperature is increased gradually (left). The right plot shows how the secondary structure changes over time for an unfolding simulation of S4N at 85°C.
The large fluctuations in S4N make the structural alignment of conformations along the trajectories difficult to interpret when the alignment is based on the backbone of all 39 residues. A more informative comparison is achieved by aligning the relatively stable eight-residue α-helix (Fig. 2 B). This procedure results in a backbone RMSD of <1.5 Å for the α-helix in all of the simulated trajectories, clarifying that the overall RMSD value, though exceptionally large, is a measure of how much the coils and loops have moved away from their original orientations. Another measure of similarity to the native structure is Q, which is based on residue-residue pairwise distances and does not depend on structure alignment (see Supporting Material).
Time-averaged RMSDs and Q-values were plotted for the last 45 ns from each of the 23 trajectories involving S4N (Fig. 2 C) (the timelines of RMSD and Q for each individual run are provided in Fig. S2 and Fig. S3). Unbound S4N is much more flexible than S4N bound to h16. All simulations of the S4N/h16 complex (blue squares) have average S4N RMSDs < 8 Å, whereas all simulations of the unbound protein (red circles) have RMSDs > 8 Å. Similar results are observed for the mean Q-values, with the complex formed from either the full system or just the signature regions all having values > 0.4. From calculations carried out for protein folding and structural phylogenetic studies, Q-values < 0.30 represent unfolded states or structurally unrelated proteins (26). Furthermore, the disordered structure of unbound S4N is consistent with an NMR study in which the N-terminal fragment of S4 could not be resolved together with the globular C-terminal domain (27).
The backbone motions arise mostly from the coil and loop region between residues 23 and 30, as seen in the RMSD per residue plots in Fig. 2 B as well as the inset representative conformations colored by RMSD per residue in Fig. 2 C. When S4N is bound to h16, positively charged residues Lys21, Arg25, Lys30, and Lys32 interact with the RNA backbone strongly, such that the coils vary little from their binding positions. Although the range of movements is limited, the side chains of these lysines and arginines can interact with the phosphates of nucleotides neighboring the contact sites in the crystal structure, as discussed further below.
The high fraction of charged residues within S4N as well as the dominant random coil structure facilitates the formation of salt bridges when S4N is not bound to h16. Although none are observed in the crystal structure, 23 different salt bridges are recorded in the unbound runs (Table S2), whereas only nine are observed during the simulations of the signature complex. Without the presence of h16, the charged amino acids are free to interact with each other, and the only constraints on salt-bridge formation are geometric ones enforced by the stability of the eight-residue helix. Of the 23 salt bridges reported in the 500-ns simulations of unbound S4N, six (Glu14-Arg2, Glu14-Arg13, Glu34-Arg13, Glu34-Arg2, Glu34-Arg12, and Asp17-Arg25) have both substantial occupation (>10%) and duration (>2 ns). The formation of these many internal salt bridges gives rise to the large fluctuations reported in the RMSDs and the disordered property of S4N.
Temperature unfolding studies
During the temperature unfolding simulation (see Materials and Methods), the stability of the α-helix seen in both the unbound and complex simulations of S4N was maintained. The helix persisted across the 100-ns simulation with two smaller helices of length 4–5 transiently appearing over 40 ns after the temperature jump (Fig. 2 D). The additional helical turns are seen around the same positions in the crystal structure of T. thermophilus 30S subunit and also occur occasionally during the room temperature simulations (data not shown). However, it is clear that they persist more extensively when the temperature is raised moderately, probably due to the rapid rearrangement of backbone ϕ,ψ-values under such temperatures.
CD measurements taken during temperature melt experiments on unbound S4N also showed increasing α-helical content. The CD signal at 222 nm (the wavelength that is characteristic of α-helices) decreased linearly with increasing temperatures (Fig. 2 D). Furthermore, the CD temperature melt also supports the disordered structure of S4N at room temperature, since no cooperative structural transition of S4N was observed.
Stability and secondary structure fluctuations in h16 and the five-way junction
In the MD simulations, h16 in both the unbound and bound systems shows a much greater stability than S4N at room temperature. According to Fig. 3 A, the RMSDs of h16 in the bound forms are only slightly smaller than in the unbound forms. Similar trends are also observed for the time-averaged Q-values. Fluctuations in h16 further decrease when it is part of the five-way junction complexed with the full-length S4, with an average RMSD near 2.3 Å and a Q-value > 0.6. The calculated stability is in agreement with thermal denaturation experiments on the isolated, unbound h16, in which absorbance at 260 nm monitored global unfolding of the RNA molecule as a function of temperature. The result shows that h16 is stable at room temperature, and a gradual unfolding transition occurs with a melting midpoint of 41 ± 5°C (Fig. 3 B; also see the Supporting Material). The temperature dependence of 2AP fluorescence provides a more local measure of the base unstacking and decreased quenching by the Iowa Black label. It shows that the ends start fraying and the loss of base stacking occurs at 60°C (Fig. 3 C), again confirming the stability of h16. The MD simulations at elevated temperatures show that without S4N to stabilize the internal bulge conformation, it expands, allowing greater conformational flexibility. Base stacking along the frayed ends remains intact longer and only slowly becomes disordered. The difference in the melting behavior from the two probes indicates that the folding transition of h16 is more complicated than a simple two-state model.
Figure 3.
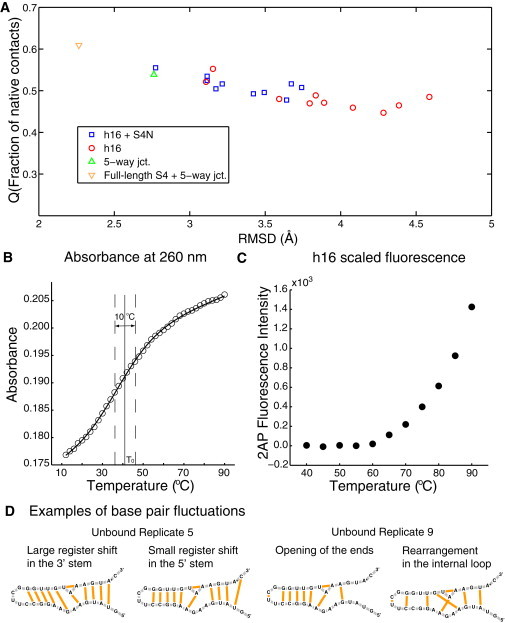
Backbone and secondary structure fluctuations of h16. (A) Time-averaged Q-value plotted against backbone RMSD for all runs involving h16. Each marker represents one particular run. (B) The absorbance measured at 260 nm as temperature is gradually increased. (C) Fluorescence intensities measured for 2AP on h16 with increasing temperature. (D) Examples of fluctuations in the basepairing interactions.
Fluctuations in the structure of unbound h16 arise primarily from shifts in basepairing and base-stacking interactions. In the crystal structure, h16 consists of two short stems connected by an internal loop and capped with a UUCG tetraloop at the end (Fig. 1; for a detailed discussion of the crystal structure conformation, see the Supporting Material). Of the 13 basepairs and 22 base-stacking interactions seen in the crystal structure of h16, several were lost in the hairpin loop, the 5′/3′ ends, and the internal loop where S4N binds (Fig. S4). In both unbound and complex simulations, the most abundant nonnative basepairs (not present in the crystal structure) are A414⋅A430, G413⋅G428, U429⋅A432, and U407⋅C436, and the first three of these basepairs are in the internal loop. Unbound replicates 5 and 9 have lost the largest number of native basepairs (Fig. 3 C). Particularly, in replicate 9, basepairing interactions in the internal loop have been greatly rearranged, and the two end bases (U421 and C422) in the tetraloop form an additional basepair that deforms the RNA backbone. In replicate 5, each base from A415 to C419 switched basepairing partners with its downstream neighboring base, resulting in a register shift of one base. This relatively stable large-scale shift is unique; however, smaller, brief register shifts of one or two basepairs are common in all of the simulations.
The average number of base-stacking interactions remained stable in both unbound and complex runs. However, several pairs of stacked bases that were absent from the crystal structure appeared during the simulations (for example, U407/A408, C418/C419, U426/U427, and U434/2AP435, which kept the continuity of the stem; and A411/G413, which is the counterpart of the stacked bases G428/A430 on the 3′ strand, and sits on top of the three interstrand stacking basepairs in the internal loop). Other cross-strand base-stacking interactions can be attributed to a more twisted helical backbone.
Secondary structure interactions in h16 are approximately the same whether it is isolated or included in the five-way junction, as shown in Fig. S4. The most noticeable difference is that base G423 flips out of the h16 hairpin loop. Basepair U420⋅G423 and base stacking between G423/G424 were rarely seen in the five-way junction simulations, whereas in the unbound and complexed h16 runs, occupancies of basepair U420⋅G423 were 56.2% and 38.8%; and stacked bases G423/G424 were 49.3% and 36.0%, respectively. The fact that the h16 hairpin loop is indeed a tetraloop in the five-way junction (but not in h16 alone), as seen in the traditional secondary structure diagram, can be attributed to the interaction between h16 and h18. The backbone fluctuations of h16 are slightly smaller when it is part of the five-way junction, as demonstrated by the RMSDs shown in Fig. 3, Fig. S2, and Fig. S7. The collective motion of the five-way junction is mainly demonstrated in the relative positioning among the helices, especially the distances between interacting sites on h16 and h18 (discussed further below). Even without S4, the secondary structure of the individual helices h4 and h16–h18 in the five-way junction remains stable over the 50-ns simulation, but h16 and h18 begin to separate from each other near the end of the simulation (see Fig. 5 A).
Figure 5.
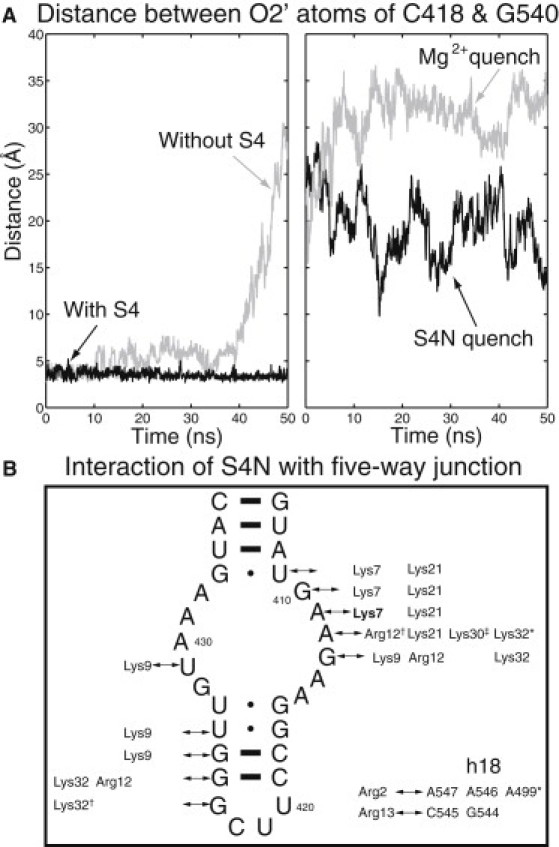
Unfolding and refolding of the five-way junction. (A) Distances were monitored between O2′ atoms on C418 (h16) and G540 (h18) in the five-way junction with/without S4 (left), and in quenching simulations using Mg2+ and S4N (right). (B) Interactions established between the unfolded five-way junction and S4N during 50 ns of the S4N quenching simulation. The simulation starts with a single interaction (shown in bold) between Lys7 and A411 in the unfolded conformations of S4N and the five-way junction. Positively charged residues on S4N form salt bridges with phosphate atoms on the RNA, hydrogen bonds with 2′ oxygens on the sugar rings (∗), and cation-π interactions with bases (†). Additional interactions between S4N and h18 close to those seen in the crystal structure are also observed.
In general, replicates with more flexibility in basepairing or base-stacking interactions have larger overall RMSDs and smaller Q-values. Furthermore, the register shift of basepairs in an RNA stem should be able to maintain most of its original base-stacking interactions. A more twisted backbone, which can shift base stacking from within one strand to across the strand, does not necessarily break the native basepairs. The rearrangement of basepairs in the internal loop, register shift of basepairs in the stems, and twisting of the helical backbone contribute to the subtle intrinsic fluctuations in h16's structure.
Experimental and computational measure of flexibility in protein-RNA interactions
To determine how strongly the two molecules bind, we measured the fluorescence of the S4N/h16 complex during progressive dilution (Fig. 4 A). Tryptophan fluorescence from S4N is quenched in the complex due to the proximity of Iowa Black FQ, which is attached to the 5′ end of h16, so a higher fluorescence intensity indicates a larger fraction of unbound S4N in solution. The general trend of the increasing normalized fluorescence intensity clearly shows that as the solution is diluted, the binding equilibrium shifts to more unbound S4N and h16. The two-component thermodynamic model allows us to obtain a binding constant of 0.91 μM. This weak binding is not surprising given the fact that only fragments of the rRNA and the protein S4 were used in this experiment.
Figure 4.
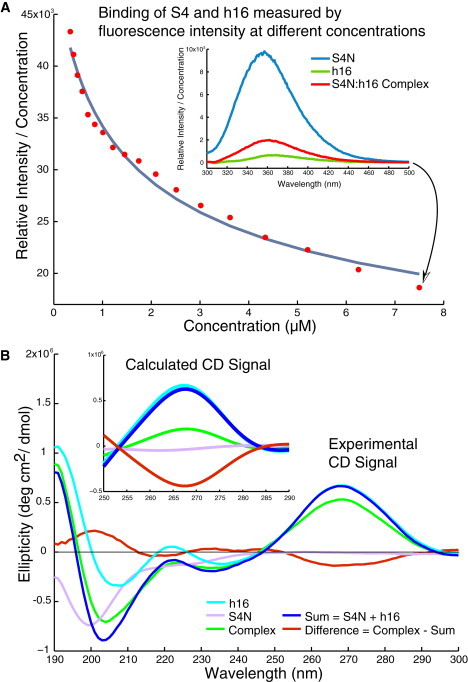
Binding of S4N and h16. (A) The dilution measurement shows increasing signal as the concentration of S4N/h16 is lowered. Inset plot shows the fluorescence quenching spectrum of S4N, h16, and a 1:1 mixture of S4N/h16 at the highest concentration of 7.5 μM. (B) Experimentally measured and theoretically calculated (inset plot) CD signals.
CD measurements were taken to investigate any possible conformational changes for either S4N or h16 upon binding. At 20 μM concentration, the sum of the individual spectra of h16 and S4N was subtracted from that of the 1:1 S4N/h16 mixture to obtain the difference spectrum (Fig. 4 B, red curve). This spectrum, together with the individual curves, indicates how the CD signal changes upon binding. At a shorter wavelength (190–215 nm), CD signal changes are mainly due to conformational changes in the protein. An increase in this region is generally indicative of a decrease in random coil characteristics in S4N upon binding. However, the small decrease observed near 222 nm is inconclusive as to the change in helical content, because the amplitude of the signal is almost comparable to the noise. Most interesting is the drop in CD signal at longer wavelengths (260–280 nm). There are two possible explanations for this drop: either h16 changes conformation upon binding S4 or the difference is caused by interactions between h16 and S4N, as nothing is expected from the protein in this region.
To determine which scenario was occurring, we calculated CD spectra based on MD trajectory data. Snapshots were taken from every replicate, and coordinates therein were used to calculate the CD signals using the online software DichroCalc (Fig. 4 B, inset; values have been scaled by 1200 times to enable direct comparison with experimental data). In the long-wavelength region (260–280 nm) where an unexpected decrease in the CD signal was seen upon binding, the averaged calculated CD signals peaked at the same wavelength and spread out in the same order as in experimental measurements, with an average diagonal correlation coefficient of 0.94. Futhermore, the mean CD spectra calculated using h16 and S4N coordinates taken from both complex and unbound runs showed that neither h16 or S4N underwent a conformational change that caused the CD signal to change at the peak wavelength ∼ 268 nm (data not shown). Therefore, the decrease of CD signal at the long-wavelength range upon binding of h16 and S4N is a consequence of interactions between the two molecules. As further discussed in the Supporting Material, conformational changes due to the existence of several cation-π interactions between the bases on h16 and the positively charged side-chains on S4N might give rise to the CD signal change, but it is not clear how they are included in the calculated spectra.
RNA-protein interactions through simulations
A detailed description of the salt bridges formed between protein residues arginine/lysine and phosphate oxygens of the RNA (Table 1) is given to illustrate the variety of possible amino acid-nucleotide charge-charge interactions in the S4N/h16 complex. Among the 50 salt bridges identified in simulations, only three (Arg12-U429, Lys9-G428, and Lys32-U426) appeared in every replicate run. Even for these three salt bridges, the largest occupancy is only ∼68% and the longest average duration is ∼7.2 ns. Considering the other salt bridges present in the crystal structure (shown in bold in Table 1), the average occupancy can be as low as ∼7.5% and average duration shorter than 1 ns. Most of the salt bridges that appeared during the simulation had an occupancy under 20% and mean duration under 3 ns.
Table 1.
Salt bridges between the ribosomal protein S4 N-terminus and backbone phosphate of h16
| ARG | RNA Res.∗ | Occu.† (%) | Dur.‡ (ns) | Replicate #§ | LYS | RNA Res. | Occu. (%) | Dur. (ns) | Replicate # |
|---|---|---|---|---|---|---|---|---|---|
| Arg2‖ | G406 | 8.23 | (33) 1.19 | 1,3,4,5, (8),9,10 | Lys7 | G406 | 9.22 | (24) 1.78 | 1,4,5,6,7,9,10 |
| U407 | 12.94 | (25) 2.38 | 1,2,3, (4),7,8,9 | U407 | 24.33 | (55) 2.03 | 1,2,3,4,5,6,7,9,10 | ||
| A408 | 1.18 | (6) 0.92 | 2,3, (9) | A408 | 20.48 | (78)1.22 | 1,2,3,4,5,7,9,10 | ||
| A431 | 0.13 | (1) 0.80 | 9 | U409 | 0.64 | (6) 0.46 | 2, (3,5,7) | ||
| Arg12 | U426 | 5.16 | (29) 0.79 | 1,4,5, (6),7, (8,9,10) | A430 | 13.67 | (24) 2.58 | 1, (2),3, (4),5, (6),8,9 | |
| U427¶ | 54.24 | (21) 11.72 | 1,2,3,4,5,6,7,8,9 | Lys9‖ | U427 | 14.41 | (20) 3.22 | 1, (2,3),4,5, (6),8,10 | |
| G428 | 0.02 | (1,6) | G428 | 62.96 | (50) 5.71 | all | |||
| U429 | 67.92 | (43) 7.21 | all | U429 | 11.28 | (20) 2.62 | 3,4,5,7,10 | ||
| Arg13‖ | U426 | 0.27 | (1) 1.10 | 1 | A430 | 8.52 | (29) 1.34 | 3,5,7,10 | |
| U427 | 11.73 | (26) 2.05 | 1,4,5,7,9 | Lys21 | G406 | 0.14 | (1) 0.55 | 5, (6) | |
| G428 | 2.67 | (11) 1.06 | 5,7 | U407 | 1.09 | (4) 1.20 | 5,6,7 | ||
| U429 | 0.07 | (1) 0.15 | 5 | A408 | 12.07 | (16) 3.38 | (1),3,5,6,7, (9),10 | ||
| Arg25 | A408 | 0.03 | (1) 0.20 | 8 | U409 | 7.48 | (36) 0.94 | 1,2,3,6,7, (8),9,10 | |
| U409 | 3.99 | (13) 1.50 | 6,8 | G410 | 23.72 | (32) 3.30 | 1,2,3, (4),7,8,9,10 | ||
| G410 | 22.90 | (49) 2.23 | 1,3,4,5,6,7,8,10 | A411 | 0.09 | (2) 0.25 | 7 | ||
| A411 | 27.52 | (77) 1.71 | 1,3,4,5,6,7,8,10 | A430 | 15.71 | (54) 1.38 | 1,2, (3),4, (6),9,10 | ||
| A412 | 10.67 | (23) 2.12 | 1,4,5,7,10 | Lys30 | A411 | 2.17 | (6) 1.61 | 5,6,7 | |
| G413 | 2.36 | (16) 0.70 | 1,2 | A412 | 9.42 | (22) 1.98 | 4,5,6,7,10 | ||
| G425 | 0.71 | (3) 1.08 | (2),10 | G413 | 12.59 | (36) 1.58 | (2),3,4,5,6,8, (9),10 | ||
| U426 | 0.23 | (4) 0.39 | 10 | G423 | 2.59 | (1) 11.75 | 2 | ||
| U429 | 17.48 | (19) 4.31 | 3,6,9 | G424 | 12.08 | (24) 2.31 | 2,3,4,6,8, (9),10 | ||
| A430 | 7.13 | (11) 3.11 | 3 | G425 | 26.57 | (82) 1.55 | 1,2,3,4,6,8,10 | ||
| U426 | 11.78 | (11) 4.85 | 1,3,6,10 | ||||||
| Lys32 | G424 | 1.46 | (8) 0.86 | 5 | |||||
| G425 | 24.41 | (41) 2.74 | 1, (2),3,4,5,7,9,10 | ||||||
| U426 | 63.00 | (65) 4.43 | all | ||||||
| U427 | 23.09 | (34) 3.09 | 2,3,4,6,7,8,10 | ||||||
| U429 | 20.21 | (18) 5.10 | 2,3,4,6,7,8 |
Calculation including atoms O1P, O2P, and O5′ from residue N, and atom O3′ from residue N-1.
Percentage values obtained by averaging over the last 45 ns of all 10 replicates.
Averaged residence time measured in nanoseconds. The number in parentheses is the number of times the salt bridges formed in all replicates.
Numbers in this column indicate which replicate runs have the specific salt bridges. The replicate number in parentheses shows that this replicate run does not possess long stretches of salt bridges that are counted into the duration calculation.
Rows in bold indicate presence in the crystal structure.
Residues that interact with other helices in the crystal structure (Table S1).
Four of the nine positively charged protein residues interact exclusively with the 3′ strand of h16, and two interact with the 5′ strand for the majority of time. Generally, the 3′ strand of h16 interacts much more strongly with the S4N than does the 5′ strand. However, Arg25, Lys21, and Lys30 interact with both strands and especially the internal loop. The number of salt bridges formed by these three residues was large, but not one of them dominated in terms of occupancy or duration. These three residues either sit in or are close to the coil region on S4N, where the RMSD per residue is as high as the opening ends even in complex runs. These fluctuating contacts contribute to the high RMSDs for this particular region of the S4N.
Role of S4N signature in the refolding of the five-way junction
The average electrostatic potential map of S4 has a predominantly positive surface along the interface to the rRNA (Fig. S8). Due to its large number of positively charged residues, S4N contributes disproportionately to this potential. As suggested in the fly-casting mechanism for molecular recognition (28–30), the docking of a protein to its nucleic acid target can be accelerated by electrostatic forces and an increased capture radius when the protein is unfolded. This suggests that, guided by the electrostatic potential, the disordered S4N searches for its binding site while undergoing conformational changes. The unstructured coil gives it a larger searching volume centered on the stable C-terminus, and the alternating salt bridges expose different charged residues to the target RNA. Because there are so many acceptable interactions between h16 and the disordered S4N, the initial contact can be established with very few tries. These interactions might be weak with a binding constant much smaller than that of the binding of the full-length S4 to 16S rRNA, but they could start the coupled folding and binding and speed up the assembly process.
To demonstrate how quickly and effectively these interactions can be established, we performed two additional 50-ns simulations in which either S4N or magnesium ions were added to the unfolded five-way junction. From alignments of the ensemble of partially unfolded S4 and five-way junctions, an initial placement of S4N was selected such that only a single contact between Lys7 and A411 existed (Fig. S6). Within 50 ns, additional salt bridges between h16/h18 and the lysines/arginines on S4N were made. A comparison of the interactions in Fig. 5 B with those observed during S4N/h16 simulation, provided in Fig. S5, reveals that many interactions between S4N and h16 were reestablished. Furthermore, interactions established between Arg2/Arg13 and h18 are close to those in the crystal structure. As measured by the decrease in distance between the O2′ atoms in C418 (h16) and G540 (h18) in Fig. 5 A, the addition of S4N partially refolds the five-way junction. This distance between h16 and h18 further decreased to ∼7 Å within the next 50 ns, but then the pseudoknot in h18 began to separate. This is consistent with the crystal structure contacts (Fig. 1) and the experimental measurements in Bellur and Woodson (11), which showed that stabilization of the pseudoknot requires the presence of S4C. For comparison, the addition of magnesium folds the five-way junction by drawing nucleotides on both h16 and h18 close together (31,32). However, because the nucleotides interacting with the magnesium ions do not form native contacts in the crystal structure, the five-way junction is caught in a wrong conformation.
The S4 is unique in being both a fast primary binding protein and an initiator protein. However, a similar binding mechanism may be applied to other signature regions on the ribosome. As shown in Fig. S9, most ribosomal structure signatures are interacting with one or two r-proteins. Some of these proteins (e.g., S18, S19, and L27) are defined as intrinsically disordered in the Disprot Database (33), whereas others interact with the RNA using their unstructured loops. It is reasonable to suggest that rRNA structure signatures occurred later during cellular evolution, promoting faster assembly of the ribosome by means of a fly-casting strategy with the help of cooperatively designed, disordered r-proteins. Further validation is needed for the functional role of signatures other than h16 and S4N, since those proteins depend on the prior binding of primary binding proteins.
Conclusions
In this study we investigated the functional role of RNA (h16) and protein (S4N) bacterial signatures in the ribosomal 30S assembly. The signature complex is the result of coevolution, and it is small enough that one can perform multiple, long, all-atom MD simulations to study the dynamics of the complex as well as the individual components. Agreement between analysis of the simulated trajectories and results of the experimental data obtained from fluorescence spectroscopy and CD at room temperature clearly demonstrate the stability of h16 and the intrinsic disorder of the unbound S4N with respect to the C-terminal portion of S4. In the simulations, the dynamic fluctuations in the highly charged S4N were exploited to initiate binding of the protein signature to h16 in the unfolded five-way junction, which resulted in its partial refolding. Such a mechanism is consistent with S4's known role as a primary binding and initiator protein for the assembly of the bacterial SSU, and may be a consequence of evolutionary pressure to ensure the rapid binding of S4 to the 16S rRNA.
Acknowledgments
The authors thank the National Science Foundation Center for the Physics of Living Cells (PHY08-22613) at the University of Illinois at Urbana-Champaign for partial support of this work. The work was supported by grants from the National Science Foundation (MCB-0844670, MCB-0613643) and National Institutes of Health (P41-RR005969). Supercomputer time was provided by the National Science Foundation under grant TRAC (MCA03T027). We also thank Jonathan Hirst and Ben Bulheller for helpful discussions of the theoretical CD calculations.
Supporting Material
References
- 1.Woese C.R., Kandler O., Wheelis M.L. Towards a natural system of organisms: proposal for the domains Archaea, Bacteria, and Eucarya. Proc. Natl. Acad. Sci. USA. 1990;87:4576–4579. doi: 10.1073/pnas.87.12.4576. [DOI] [PMC free article] [PubMed] [Google Scholar]
- 2.Winker S., Woese C.R. A definition of the domains Archaea, Bacteria and Eucarya in terms of small subunit ribosomal RNA characteristics. Syst. Appl. Microbiol. 1991;14:305–310. doi: 10.1016/S0723-2020(11)80303-6. [DOI] [PubMed] [Google Scholar]
- 3.Woese C.R. Interpreting the universal phylogenetic tree. Proc. Natl. Acad. Sci. USA. 2000;97:8392–8396. doi: 10.1073/pnas.97.15.8392. [DOI] [PMC free article] [PubMed] [Google Scholar]
- 4.Roberts E., Sethi A., Luthey-Schulten Z. Molecular signatures of ribosomal evolution. Proc. Natl. Acad. Sci. USA. 2008;105:13953–13958. doi: 10.1073/pnas.0804861105. [DOI] [PMC free article] [PubMed] [Google Scholar]
- 5.Held W.A., Ballou B., Nomura M. Assembly mapping of 30 S ribosomal proteins from Escherichia coli. Further studies. J. Biol. Chem. 1974;249:3103–3111. [PubMed] [Google Scholar]
- 6.Nowotny V., Nierhaus K.H. Assembly of the 30S subunit from Escherichia coli ribosomes occurs via two assembly domains which are initiated by S4 and S7. Biochemistry. 1988;27:7051–7055. doi: 10.1021/bi00418a057. [DOI] [PubMed] [Google Scholar]
- 7.Cui Q., Tan R., Case D. Low-resolution molecular dynamics simulations of the 30S ribosomal subunit. Multiscale Model. Simul. 2006;5:1248–1263. [Google Scholar]
- 8.Talkington M.W., Siuzdak G., Williamson J.R. An assembly landscape for the 30S ribosomal subunit. Nature. 2005;438:628–632. doi: 10.1038/nature04261. [DOI] [PMC free article] [PubMed] [Google Scholar]
- 9.Sykes M.T., Williamson J.R. A complex assembly landscape for the 30S ribosomal subunit. Annu. Rev. Biochem. 2009;38:197–215. doi: 10.1146/annurev.biophys.050708.133615. [DOI] [PMC free article] [PubMed] [Google Scholar]
- 10.Adilakshmi T., Ramaswamy P., Woodson S.A. Protein-independent folding pathway of the 16S rRNA 5′ domain. J. Mol. Biol. 2005;351:508–519. doi: 10.1016/j.jmb.2005.06.020. [DOI] [PubMed] [Google Scholar]
- 11.Bellur D.L., Woodson S.A. A minimized rRNA-binding site for ribosomal protein S4 and its implications for 30S assembly. Nucleic Acids Res. 2009;37:1886–1896. doi: 10.1093/nar/gkp036. [DOI] [PMC free article] [PubMed] [Google Scholar]
- 12.Allen P.N., Noller H.F. Mutations in ribosomal proteins S4 and S12 influence the higher order structure of 16 S ribosomal RNA. J. Mol. Biol. 1989;208:457–468. doi: 10.1016/0022-2836(89)90509-3. [DOI] [PubMed] [Google Scholar]
- 13.Hall K.B. RNA in motion. Curr. Opin. Chem. Biol. 2008;12:612–618. doi: 10.1016/j.cbpa.2008.09.033. [DOI] [PMC free article] [PubMed] [Google Scholar]
- 14.Chen K., Roberts E., Luthey-Schulten Z. Horizontal gene transfer of zinc and non-zinc forms of bacterial ribosomal protein S4. BMC Evol. Biol. 2009;9:179–195. doi: 10.1186/1471-2148-9-179. [DOI] [PMC free article] [PubMed] [Google Scholar]
- 15.Rachofsky E.L., Osman R., Ross J.B. Probing structure and dynamics of DNA with 2-aminopurine: effects of local environment on fluorescence. Biochemistry. 2001;40:946–956. doi: 10.1021/bi001664o. [DOI] [PubMed] [Google Scholar]
- 16.Nishii I., Kataoka M., Goto Y. Cold denaturation of the molten globule states of apomyoglobin and a profile for protein folding. Biochemistry. 1994;33:4903–4909. doi: 10.1021/bi00182a019. [DOI] [PubMed] [Google Scholar]
- 17.Berk V., Zhang W., Cate J.H. Structural basis for mRNA and tRNA positioning on the ribosome. Proc. Natl. Acad. Sci. USA. 2006;103:15830–15834. doi: 10.1073/pnas.0607541103. [DOI] [PMC free article] [PubMed] [Google Scholar]
- 18.Chen A.A., Marucho M., Baker N.A., Pappu R.V. Simulations of RNA interactions with monovalent ions. Methods Enzymol. 2009;469:411–432. doi: 10.1016/S0076-6879(09)69020-0. [DOI] [PubMed] [Google Scholar]
- 19.Humphrey W., Dalke A., Schulten K. VMD: visual molecular dynamics. J. Mol. Graph. 1996;14:33–38. doi: 10.1016/0263-7855(96)00018-5. 27–28. [DOI] [PubMed] [Google Scholar]
- 20.Eargle J., Black A.A., Luthey-Schulten Z. Dynamics of recognition between tRNA and elongation factor Tu. J. Mol. Biol. 2008;377:1382–1405. doi: 10.1016/j.jmb.2008.01.073. [DOI] [PMC free article] [PubMed] [Google Scholar]
- 21.Phillips J.C., Braun R., Schulten K. Scalable molecular dynamics with NAMD. J. Comput. Chem. 2005;26:1781–1802. doi: 10.1002/jcc.20289. [DOI] [PMC free article] [PubMed] [Google Scholar]
- 22.Lu X.J., Olson W.K. 3DNA: a software package for the analysis, rebuilding and visualization of three-dimensional nucleic acid structures. Nucleic Acids Res. 2003;31:5108–5121. doi: 10.1093/nar/gkg680. [DOI] [PMC free article] [PubMed] [Google Scholar]
- 23.Gabb H.A., Sanghani S.R., Prévost C. Finding and visualizing nucleic acid base stacking. J. Mol. Graph. 1996;14:6–11. doi: 10.1016/0263-7855(95)00086-0. 23–24. [DOI] [PubMed] [Google Scholar]
- 24.Gendron P., Lemieux S., Major F. Quantitative analysis of nucleic acid three-dimensional structures. J. Mol. Biol. 2001;308:919–936. doi: 10.1006/jmbi.2001.4626. [DOI] [PubMed] [Google Scholar]
- 25.Selmer M., Dunham C.M., Ramakrishnan V. Structure of the 70S ribosome complexed with mRNA and tRNA. Science. 2006;313:1935–1942. doi: 10.1126/science.1131127. [DOI] [PubMed] [Google Scholar]
- 26.Eastwood M.P., Hardin C., Wolynes P.G. Evaluating protein structure-prediction schemes using energy landscape theory. IBM J. Res. Develop. 2001;45:475–497. [Google Scholar]
- 27.Markus M.A., Gerstner R.B., Torchia D.A. The solution structure of ribosomal protein S4 Δ41 reveals two subdomains and a positively charged surface that may interact with RNA. EMBO J. 1998;17:4559–4571. doi: 10.1093/emboj/17.16.4559. [DOI] [PMC free article] [PubMed] [Google Scholar]
- 28.Shoemaker B.A., Portman J.J., Wolynes P.G. Speeding molecular recognition by using the folding funnel: the fly-casting mechanism. Proc. Natl. Acad. Sci. USA. 2000;97:8868–8873. doi: 10.1073/pnas.160259697. [DOI] [PMC free article] [PubMed] [Google Scholar]
- 29.Levy Y., Onuchic J.N., Wolynes P.G. Fly-casting in protein-DNA binding: frustration between protein folding and electrostatics facilitates target recognition. J. Am. Chem. Soc. 2007;129:738–739. doi: 10.1021/ja065531n. [DOI] [PubMed] [Google Scholar]
- 30.Huang Y., Liu Z. Kinetic advantage of intrinsically disordered proteins in coupled folding-binding process: a critical assessment of the “fly-casting” mechanism. J. Mol. Biol. 2009;393:1143–1159. doi: 10.1016/j.jmb.2009.09.010. [DOI] [PubMed] [Google Scholar]
- 31.Draper D.E., Grilley D., Soto A.M. Ions and RNA folding. Annu. Rev. Biophys. Biomol. Struct. 2005;34:221–243. doi: 10.1146/annurev.biophys.34.040204.144511. [DOI] [PubMed] [Google Scholar]
- 32.Chen G., Tan Z.J., Chen S.J. Salt-dependent folding energy landscape of RNA three-way junction. Biophys. J. 2010;98:111–120. doi: 10.1016/j.bpj.2009.09.057. [DOI] [PMC free article] [PubMed] [Google Scholar]
- 33.Sickmeier M., Hamilton J.A., Dunker A.K. DisProt: the database of disordered proteins. Nucleic Acids Res. 2007;35(Database issue):D786–D793. doi: 10.1093/nar/gkl893. [DOI] [PMC free article] [PubMed] [Google Scholar]
Associated Data
This section collects any data citations, data availability statements, or supplementary materials included in this article.