Abstract
Quantitative ultrasonic characterization of cancellous bone can be complicated by artifacts introduced by analyzing acquired data consisting of two propagating waves (a fast wave and a slow wave) as if only one wave were present. Recovering the ultrasonic properties of overlapping fast and slow waves could therefore lead to enhancement of bone quality assessment. The current study uses Bayesian probability theory to estimate phase velocity and normalized broadband ultrasonic attenuation (nBUA) parameters in a model of fast and slow wave propagation. Calculations are carried out using Markov chain Monte Carlo with simulated annealing to approximate the marginal posterior probability densities for parameters in the model. The technique is applied to simulated data, to data acquired on two phantoms capable of generating two waves in acquired signals, and to data acquired on a human femur condyle specimen. The models are in good agreement with both the simulated and experimental data, and the values of the estimated ultrasonic parameters fall within expected ranges.
INTRODUCTION
Quantitative ultrasound is a modality for evaluating changes in bone quality associated with osteoporosis.1, 2, 3, 4, 5, 6, 7, 8, 9, 10 Quantitative ultrasound parameters, such as speed of sound and broadband ultrasonic attenuation (BUA), have been shown to correlate with bone mineral density (BMD).3, 11, 12 The frequency dependence of phase velocity (i.e., dispersion) may also contain relevant clinical information, but it has not yet been demonstrated as a reliable indicator of bone quality.
Cancellous (trabecular) bone is a porous material found within the cavities of long bones and vertebrae. It consists of a complex matrix of hard spicules (trabeculae) interspersed with soft bone marrow. The complicated microstructure is known to support the propagation of multiple compressional ultrasonic wave modes, often referred to as fast waves and slow waves.13, 14, 15, 16, 17, 18, 19 When cancellous bone samples are insonified in through-transmission studies, the two waves occasionally are separated and clearly distinct in the radiofrequency (rf) data. However, in some circumstances, the two waves can strongly overlap during the time period over which the rf data are acquired, resulting in interference and difficulties in distinguishing between the two waves.5, 15, 17, 18, 20, 21
Ultrasonic measurements from many laboratories have revealed that cancellous bone exhibits a linear or nearly-linear increase in attenuation coefficient with frequency.1, 3, 22, 23, 24 According to some forms of the causality-imposed Kramers-Kronig (KK) relations that relate the frequency dependence of the phase velocity to the attenuation coefficient, materials that exhibit a linear-with-frequency increase in attenuation coefficient are expected to exhibit a logarithmic-with-frequency increase in phase velocity.22, 25, 26, 27, 28, 29, 30, 31, 32 However, many laboratories report phase velocity measurements that decrease with frequency, a phenomenon known as anomalous negative dispersion.2, 6, 8, 20, 21, 22, 33, 34, 35, 36, 37 In an effort to explain the observed phase velocity dispersion, our Laboratory proposed that conventional phase spectroscopy analysis of acquired radiofrequency data might be influenced by the presence of multiple interfering compressional wave modes. In instances where fast and slow waves are overlapped, anomalous dispersion measurements could result from analyzing the interfering waves as if only one wave were present.20, 21 Numerical simulations demonstrated that when interference between a fast wave and a slow wave occurs, the acquired waveform exhibits apparent ultrasonic properties that differ from the true properties of the individual fast and slow waves.20, 21 Solving the inverse problem—that is, reconstructing the ultrasonic properties of the interfering fast and slow waves—could provide more reliable information about the medium under study. Studies undertaken by Sebaa et al.,38 our Laboratory,39, 40, 41, 42 and Wear43 have addressed various ways of addressing inverse problems in the ultrasonic investigation of cancellous bone to accomplish these goals. The objective of the current study is to extend and enhance our Laboratory’s proposed technique of using Bayesian probability theory to recover the properties of individual interfering waves in data acquired on bone and bone-mimicking phantoms.
METHODS
Ultrasonic data acquisition
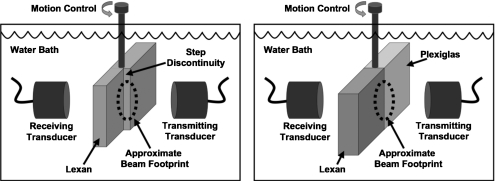
Two phantoms capable of producing two overlapping waves in acquired ultrasonic data were constructed from plastics. The plastic phantoms were not introduced to strictly reproduce the mechanisms of attenuation and dispersion in cancellous bone, which are produced by interactions between fluid and solid components of a porous medium. However, for the purposes of investigating a method for estimating the ultrasonic properties of interfering fast and slow waves described in the current study, such phantoms provide an appropriate and less complicated way to generate experimental data consisting of overlapping waves with the well-understood ultrasonic properties of the plastics used in their construction. One phantom was constructed by machining a step discontinuity into a previously flat and parallel block of Lexan (polycarbonate thermoplastic resin). The thick portion of the block was 8.5 mm, and the thin portion of the block was 8.1 mm thick. Upon insonation, approximately half the ultrasonic beam propagates through the thick portion of the block, and half propagates through the thin side of the block. The difference in sample lengths for the two portions of the beam leads to two apparently independent waves in the acquired data. The size of the step discontinuity was chosen so that the fast and slow wave components would be approximately 180 degrees out of phase in order to maximize the degree of interference between the two waves. Data were acquired on this phantom in a water tank using planar broadband transducers with a diameter of 1.3 cm and a center frequency of 5 MHz (Panametrics V309, Waltham, MA, USA) in a through-transmission arrangement. Although frequencies near 5 MHz constitute an experimental bandwidth higher than typical clinical frequencies, the choice of this bandwidth was to more closely approximate the strength of signal attenuation in cancellous bone. Signals at frequencies relevant to clinical studies (those near 0.5 MHz) tend to be strongly attenuated in cancellous bone, but such frequencies are not strongly attenuated in plastics. Therefore, the stepped Lexan plastic phantom was interrogated with 5 MHz signals, which are more strongly attenuated in plastic.
A second phantom was constructed from rectangular blocks of Plexiglas (polymethyl methacrylate) and Lexan (polycarbonate thermoplastic resin). These blocks were bonded with Acrylic cement (IPS Corporation, Gardena, CA, USA) and machined so that the bonded material was flat and parallel, with a thickness of 1.1 cm. When this phantom is insonified near the boundary between the plastics, half of the ultrasonic beam travels through Lexan, and the other half travels through Plexiglas. Two waves arise in the acquired data because the speed of sound in Plexiglas is faster than the speed of sound in Lexan. To better approximate the conditions used in data acquisition on cancellous bone, especially the high kilohertz frequency range, data were acquired on this phantom using matched broadband 500 kHz center-frequency transducers (Panametrics V391, Waltham, MA, USA) in a through-transmission arrangement. These transducers were also planar and had a diameter of 2.9 cm. Schematics of the acquisition arrangement are shown in Fig. 1.
Figure 1.
Data acquisition arrangement for the Lexan phantom with a step discontinuity (left) and the phantom made from bonded Lexan and Plexiglas (right).
Additionally, a human femur condyle specimen was prepared by machining the anterior and posterior sides of the condyle so that they were flat and parallel, with the trabecular structure exposed. The marrow was removed, and the sample was saturated with water. Data were acquired in a water tank at several spatial sites on the sample using a matched pair of 1 cm diameter, planar, 500 kHz center-frequency broadband transducers in a through transmission arrangement similar to the one used for data acquisition on the plastic bone-mimicking phantoms.
The data acquired on the plastic phantoms and on the human bone sample served as input to a Bayesian program that estimated the ultrasonic parameters of a fast wave and a slow wave.
Model of ultrasonic wave propagation
Ultrasonic data can be modeled as
| (1) |
where output(f) and input(f) are the complex Fourier spectra of the model waveform and incident ultrasonic pulse, respectively, Hfast(f) and Hslow(f) are the transfer functions for the fast and slow waves, and n is an additive noise vector. When calculations were performed on the simulated input data, a simulated incident pulse was used to generate input(f). When experimentally acquired data were used as input to the calculations, a reference water-path signal was used as the source for input(f). The transfer functions are given by
| (2) |
| (3) |
where Afast and Aslow are parameters that account for frequency-independent signal loss, such as transmission losses that might occur at interfaces between different media. The parameters βfast and βslow are the slopes of attenuation (nBUA) for the fast and slow waves, d is the thickness of the bone sample, and cfast and cslow are the phase velocities for the fast and slow waves. To ensure agreement with the Kramers-Kronig relations, the phase velocities are related to the attenuation coefficients by
| (4) |
| (5) |
where f0 is a reference frequency chosen from within the experimental bandwidth and loge denotes the natural logarithm. In all calculations, f0 was set at or near the middle of the experimental bandwidth, typically corresponding to a frequency near the center frequency of the transducer (either 500 kHz or 5 MHz for the experimentally acquired data).
In Eqs. 2, 3, 4, 5, the nBUAs, βfast and βslow, are expressed in natural (i.e., base e) units (e.g., cm−1 MHz−1). However, a common convention is to report nBUA in units of dB∕cm∕MHz. To avoid confusion, the notation βdBfast and βdBslow is used when referring to logarithmic values of nBUA, and βfast and βslow (without the superscript) is used when referring to natural units, with the understanding that
| (6) |
and that a similar relationship exists between βslow and βdBslow.
Bayesian calculations
Bayesian probability theory44 is used to estimate all of the parameters appearing in Eqs. 1, 2, 3, 4, 5. Bretthorst45 gives a detailed example of a calculation similar to the one carried out here. In Bayesian probability theory, everything known about a parameter is summarized by a probability density function. For example, the probability for cslow(f0) is represented symbolically as P(cslow(f0)|DI), where this notation should be understood as the posterior probability for the parameter cslow(f0) given the data D and the prior information I. The posterior probabilities for each individual parameter can all be computed from the joint posterior probability for all of the parameters by a process called marginalization, in which an integral over the joint posterior probability is performed over the uninteresting parameters. For example, if all of the parameters are represented as Θ={Afast,βfast,cfast(f0),Aslow,βslow,cslow(f0)}, then the posterior probability for cslow(f0) is computed as
| (7) |
where P(Θ|DI) is the joint posterior probability for all of the parameters. In a similar fashion, the posterior probabilities for the other parameters can be obtained by marginalizing over all of the parameters except the parameter of interest.
The joint posterior probability for all of the parameters is obtained by applying Bayes’ theorem,
| (8) |
where P(Θ|I) is the prior probability for Θ given only I, P(D|ΘI) is the likelihood or the direct probability for the data given the parameters and the prior information, and P(D|I) is a normalization constant.
Using the product rule of probability theory, the prior probability for the parameters can be factored,
| (9) |
To make this factorization, it has been assumed that each parameter is logically independent; i.e., each prior probability depends only on the parameter in question. For example, it has been assumed that what is known about Afast does not depend on cslow(f0), etc.
In the calculation reported in this paper, it has been assumed that only vague prior information is available about each parameter. Because the prior information is vague, the functional form used to represent each prior probability is found to make very little difference in the resulting posterior probabilities. Consequently, these prior probabilities were assigned using bounded Gaussian distributions that provide order-of-magnitude estimates of each parameter. A summary of these order of magnitude estimates is given in Table 1.
Table 1.
Prior probability distributions for each model parameter. The means and standard deviations define Gaussian distributions that are bounded by the low and high values.
| Afast | Aslow | βdBfast (dB∕cm MHz) | βdBslow (dB∕cm MHz) | cfast at 500 kHz (m∕s) | cslow at 500 kHz (m∕s) | |
|---|---|---|---|---|---|---|
| Low | 0 | 0 | 0 | 0 | 1000 | 1000 |
| Mean | 0.5 | 0.5 | 43.4 | 43.4 | 2000 | 2000 |
| High | 1 | 1 | 86.8 | 86.8 | 3000 | 3000 |
| Std. dev. | 0.5 | 0.5 | 43.4 | 43.4 | 1000 | 1000 |
Finally, the likelihood, P(D|ΘI) was assigned using a Gaussian prior probability to represent what was known about the noise. The standard deviation of this Gaussian was removed using marginalization with a Jeffreys prior.46
The calculation represented symbolically by Eq. 7 is a complicated five dimensional integral that must be repeated six times, once for each parameter appearing in the model. Such multi-dimensional integrals are difficult or impossible to solve analytically. Consequently, a Markov chain Monte Carlo simulation with simulated annealing was used to approximate these integrals. More details on Bayesian probability theory are given by Sivia et al.44 and Bretthorstet al.,45 and further information on how Markov chain Monte Carlo is used in Bayesian probability theory is available in the literature.47, 48, 49, 50 Each calculation took approximately 6 min to complete on a computer system with two dual core AMD Opteron 2220 processors.
RESULTS
Simulated data
As a preliminary investigation, simulated ultrasonic data were prepared using the model described in Eqs. 1, 2, 3, 4, 5, with varying levels of Gaussian noise added to the simulated signal to create three different simulated data sets with peak signal-to-noise ratios of 50:1, 100:1, and 250:1. In each case, the parameters used to create the simulated data were {Afast,βdBfast,cfast(f0),Aslow,βdBslow,cslow(f0)} ={0.4, 20 dB∕cm MHz, 1600 m∕s, 0.6, 6.9 dB∕cm MHz, 1500 m∕s}, values previously shown to generate a negative dispersion using this model for acoustic wave propagation in bone.20 The value of f0 was set at 300 kHz, and the propagation distance was set at 1 cm.
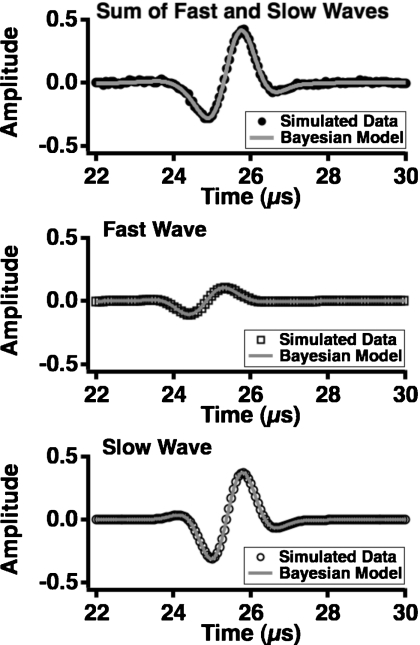
A comparison of the input fast and slow waves to the estimated fast and slow waves is shown in Fig. 2. The simulated data used in this example had a signal-to-noise ratio of 50:1, and the estimated fast and slow waves were generated from the parameters that had maximum posterior probability. The agreement between the simulated input and model output waves is excellent. In addition, the estimated parameters are in good agreement with the input values. In additional numerical studies (not shown), it was determined that the Bayesian parameter estimation approach accurately estimated the ultrasonic properties of the fast and slow wave modes over a range of input parameter values. This ability is not significantly diminished even when the fast and slow waves overlap more substantially than illustrated in Fig. 2, although the uncertainty in the parameter values is increased as the degree of overlap increases.
Figure 2.
Input data to the Bayesian calculations (top panel, solid black circles) consisting of the sum of a simulated fast wave (middle panel, black squares) and slow wave (bottom panel, black circles). The output of the Bayesian calculations corresponding to each portion of the data is shown superimposed in a gray line. The signal-to-noise ratio in the input data is 50:1.
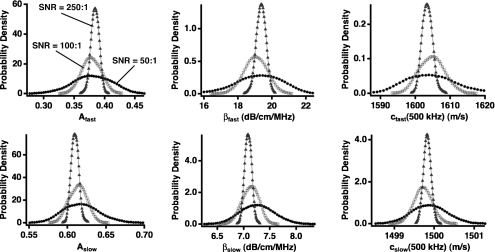
The marginal distributions for each parameter in the model are shown in Fig. 3. Even when the signal-to-noise ratio is relatively poor, Bayesian probability theory successfully estimates the true input parameter values; the peak values of the marginal distributions do not change appreciably as signal quality changes. However, the benefit of high quality data is evident in that the widths of the marginal posterior probability density functions are reduced as the signal-to-noise ratio improves. A numerical summary of these results is presented in Table 2.
Figure 3.
Marginal posterior probability density functions for the three sets of simulated data at varying signal-to-noise ratio (SNR) levels. All distributions integrate to 1. SNRs of 50:1, 100:1, and 250:1 are shown in circles, squares, and triangles, respectively. As the signal quality improves, the width of the distributions decreases, indicating increased confidence in the parameter value. However, the mean and peak parameter values do not change appreciably.
Table 2.
The input values of the model parameters used to construct simulated data sets are compared to the output means and standard deviations of the Monte Carlo samples computed using Bayesian probability theory.
| Afast | Aslow | βdBfast (dB∕cm MHz) | βdBslow (dB∕cm MHz) | cfast at 500 kHz (m∕s) | cslow at 500 kHz (m∕s) | |
|---|---|---|---|---|---|---|
| Input value | 0.40 | 0.60 | 20.0 | 6.9 | 1600 | 1500 |
| SNR 50:1 | 0.38±0.03 | 0.62±0.02 | 19.2±1.3 | 7.2±0.3 | 1605±7 | 1500±0.4 |
| SNR 100:1 | 0.38±0.02 | 0.61±0.01 | 19.0±0.7 | 7.1±0.2 | 1605±3 | 1500±0.2 |
| SNR 250:1 | 0.38±0.01 | 0.61±0.005 | 19.4±0.3 | 7.1±0.1 | 1603±2 | 1500±0.1 |
Phantom data
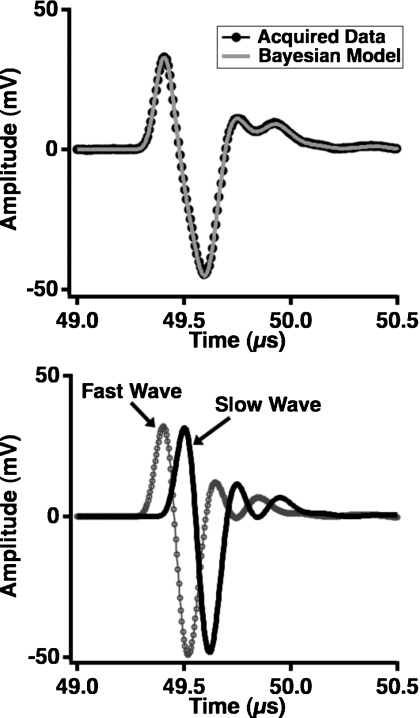
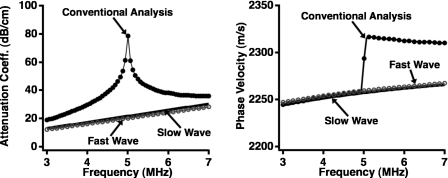
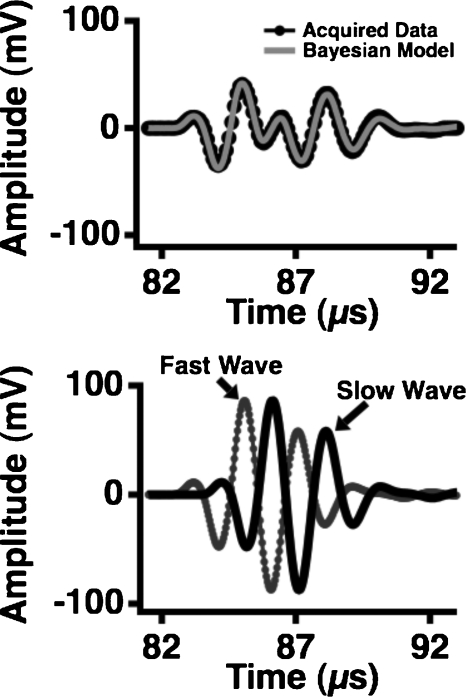
Ultrasonic data acquired on the Lexan phantom with a step discontinuity are shown in the top panel of Fig. 4, with the model constructed from the parameters that maximized the posterior probability shown superimposed on the data. In these calculations, the value of f0 was set at 5 MHz and the distances of propagation for the fast and slow waves were set to the distances corresponding to the thick and thin portions of the Lexan phantom as measured with calipers. The individual fast and slow waves that comprise the model are shown in the corresponding lower panel. The qualitative agreement between the input data and the model constructed using Bayesian probability theory is excellent despite the large difference in the phases of the fast and slow waves. Moreover, as shown in Fig. 5, a conventional analysis of the acquired data in Fig. 4 yields large artifacts near 5 MHz in both the attenuation coefficient and phase velocity. In contrast, the attenuation coefficients and phase velocities of the fast and slow waves obtained with Bayesian probability theory do not exhibit such anomalous behavior, and are consistent with the expected values for Lexan.
Figure 4.
Data acquired at 5 MHz on a Lexan phantom with a step discontinuity (top panel, dark circles) with the model constructed from the parameters that maximized the joint posterior probability superimposed (top panel, gray line). The fast and slow waves that comprise the model are displayed in the bottom panel.
Figure 5.
Conventional analysis of the data from a Lexan phantom with a step discontinuity yields significant artifacts in the attenuation coefficient and phase velocity near band center. In contrast, the curves for the fast and slow waves obtained using Bayesian probability theory are smoothly varying and consistent with a flat and parallel block of Lexan.
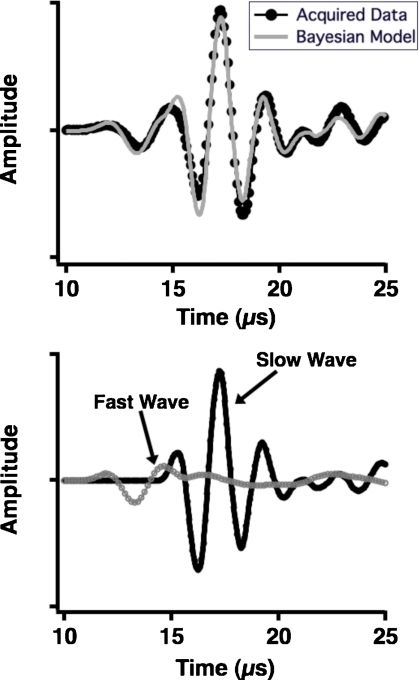
A summary of the parameter estimates (the means and standard deviations of the Monte Carlo samples), is given in Table 3. The properties of the fast and slow waves are similar because the medium under investigation in each case is Lexan. Similar results for the bonded Lexan and Plexiglas phantom are shown in Fig. 6. For these calculations, f0 was set at 500 kHz and the propagation distance for each wave was set at 1.1 cm, the thickness of the phantom as measured with calipers. Each of these plastics has relatively low internal losses at frequencies in the 300–700 kHz bandwidth compared to those in the 3–7 MHz bandwidth. This effect is especially notable for Plexiglas, which has a relatively low nBUA even over megahertz bandwiths (on the order of 0.7 dB∕cm MHz from 3–7 MHz). Consequently, the frequency-dependent attenuation coefficient is more difficult to estimate in the hundreds of kilohertz frequency range, because energy loss is dominated by (approximately frequency-independent) reflection losses at the interfaces between the plastics and water. Nevertheless, the qualitative agreement between the model and the data remains quite good, and the ability of the Bayesian approach to estimate the fast and slow wave phase velocities is preserved despite the difficulties in estimating nBUA for the fast and slow waves. These additional complexities are not likely to persist in data acquired on cancellous bone because the attenuation coefficients are much larger than those in plastics (see Discussion section).
Table 3.
The expected values of the model parameters are taken from ultrasonic measurements performed on a flat and parallel block of Lexan. These expected values are compared to the means and standard deviations of the Monte Carlo samples computed using Bayesian probability theory for the data acquired on a block of Lexan with a step discontinuity.
| Afast | Aslow | βdBfast (dB∕cm MHz) | βdBslow (dB∕cm MHz) | cfast at5 MHz (m∕s) | cslow at5 MHz (m∕s) | |
|---|---|---|---|---|---|---|
| Expected | – | – | 4.2 | 4.2 | 2250 | 2250 |
| Bayesian estimate | 0.43±0.01 | 0.44±0.01 | 4.0±0.1 | 4.3±0.1 | 2259±1 | 2257±1 |
Figure 6.
Data acquired at 500 kHz on a phantom constructed from bonded blocks of Lexan and Plexiglas (top panel, dark circles) with the model constructed from the parameters that maximized the joint posterior probability superimposed (top panel, gray line). The fast and slow waves that comprise the model are displayed in the bottom panel.
A summary of the parameter estimates for the velocity parameters in this data set is given in Table 4, with comparisons to approximate expected phase velocities at band center for individual Lexan and Plexiglas samples. Here, Plexiglas corresponds to the fast wave and Lexan corresponds to the slow wave.
Table 4.
The expected values of the model velocity parameters are taken from ultrasonic measurement performed on flat and parallel blocks of Lexan and Plexiglas. These expected values are compared to the means and standard deviations of the Monte Carlo samples computed using Bayesian probability theory for the data acquired on a phantom constructed by bonding blocks of Lexan and Plexiglas.
| cfast at500 kHz (m∕s) | cslow at500 kHz (m∕s) | |
|---|---|---|
| Expected | 2735 | 2185 |
| Bayesian estimate | 2765±1 | 2192±1 |
Cancellous bone data
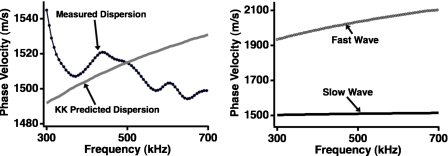
Acquired ultrasonic data and the corresponding Bayesian model for a single site on a human femur condyle are shown in Fig. 7, with the fast and slow waves generated using the parameters that had maximum posterior probability displayed in the lower panel. The calculations were performed with f0 set to 500 kHz and the propagation distance set to 1.68 cm, the thickness of the bone sample. The complex structure of cancellous bone results in data that are less clean than the data acquired on flat and parallel blocks of plastic; the signal-to-nose ratio for the fast wave is approximately 48:1, and the signal-to-noise ratio for the slow wave is approximately 230:1. In turn, the anticipated agreement between the data and model is lessened because the attenuation coefficients for the fast and slow waves may deviate from strict linearity, and thus the phase velocities become less logarithmic in nature. However, in spite of these anticipated challenges, the data and model for this site are in good agreement. Additionally, as shown in Fig. 8, the phase velocities for the fast and slow waves recovered using Bayesian methods are causally consistent. The conventionally measured dispersion for this site is shown in the left panel of Fig. 8 (black circles), and a negative dispersion is evident. The frequency dependence of this curve contrasts with that of the dispersion predicted by the Kramers-Kronig relations, given the nBUA at this site. However, the right panel of Fig. 8 shows that the dispersions for the fast and slow waves are positive and increasing, as required by the model. A summary of the parameter estimates for these data is given in Table 5.
Figure 7.
Data acquired at 500 kHz at one site on a human femur condyle specimen (top panel, dark circles) with the model constructed from the parameters that maximized the joint posterior probability superimposed (top panel, gray line). The fast and slow waves that comprise the model are displayed in the bottom panel.
Figure 8.
The conventionally measured phase velocity for the data acquired on a human femur condyle (left panel, dark circles) exhibits an anomalous negative dispersion, in contrast with the dispersion predicted by the Kramers-Kronig relations (left panel, gray curve). The fast and slow wave dispersions obtained using Bayesian probability theory (right panel) do not exhibit anomalous behavior.
Table 5.
Means and standard deviations of the Monte Carlo samples computed using Bayesian probability theory for the data acquired on a human cancellous bone specimen taken from a femur condyle.
| Afast | Aslow | βdBfast (dB∕cm MHz) | βdBslow (dB∕cm MHz) | cfast at 500 kHz (m∕s) | cslow at 500 kHz (m∕s) | |
|---|---|---|---|---|---|---|
| Bayesian estimate | 0.82±0.05 | 0.23±0.01 | 42.8±1.2 | 5.2±0.3 | 2036±5 | 1511±1 |
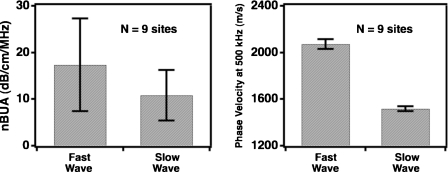
The analysis was performed at nine different sites on the same femur condyle to verify that it could be applied to a variety of data acquired on cancellous bone. The peak values of βdBfast, βdBslow, cfast (500 kHz), and cslow (500 kHz) were recorded at each location and averaged to obtain mean values for each parameter across the nine spatial sites. The results are displayed in Fig. 9, with the error bars representing the standard deviation in the most probable values for the parameter estimates across all of the nine spatial locations. There is relatively little variance in cfast (500 kHz), and cslow (500 kHz) over the spatial sites, but there is considerably more variation in βdBfast and βdBslow over the same locations.
Figure 9.
Values for nBUA and phase velocity at band center inferred by Bayesian probability theory for nine spatial locations within the same human femur condyle specimen. The phase velocities do not vary substantially over the nine sites, but there is considerable variation in nBUA.
DISCUSSION
Analysis of ultrasonic data acquired on cancellous bone is often performed by using time-of-flight or phase spectroscopy methods to determine speeds of sound, and applying log spectral subtraction methods to obtain values for BUA or nBUA. Some assumptions underlying these approaches—namely, that the signal loss and attenuation coefficient of cancellous bone can be approximated by a linear relationship with frequency—have been explicitly incorporated into the model for ultrasonic wave propagation in bone used in the current study. It should be noted, however, that there is not yet an established empirical consensus on the frequency dependence of individual fast and slow wave attenuation coefficients or phase velocities in cancellous bone. There are relatively few studies in the literature that report measurements of individual fast and slow wave attenuation and dispersion. However, one study by Hosokawa and Otani suggests that fast wave attenuation coefficients become large and perhaps not-linear-with-frequency at higher frequencies above 1 MHz, and that the fast and slow waves may not be very dispersive.16 However, the results reported by Hosokawa and Otani show that the attenuation coefficients for both the fast and the slow waves appear to retain an approximately linear frequency dependence for frequencies near 500 kHz, which is the center frequency of the experimental bandwidth used on cancellous bone in this study.
Because the attenuation coefficient is assumed to rise linearly with frequency, this model employs a dispersion that rises logarithmically with frequency as determined by the Kramers-Kronig relations. The heterogeneity and general complexity of cancellous bone structure appears to result in some deviation from these strict frequency dependences. Indeed, results presented above suggest that as analysis is performed on data obtained from specimens ranging from computer simulation, to homogeneous plastics, and to cancellous bone, these approximations become less satisfying. In spite of this trend, the fast and slow wave estimated parameters appear to be plausible and might in future studies be shown to be of diagnostic value. Furthermore, somewhat more sophisticated models for ultrasonic wave propagation can easily be incorporated into the Bayesian analysis introduced here if appropriate.
Other potential complicating experimental factors not directly accounted for in the model described here are the effects of diffraction and phase cancellation at the face of a piezoelectric receiver.51, 52 Because the model does not currently include a mechanism for these effects, systematic errors are introduced that could influence the parameter estimates, especially those that govern signal loss (Afast, Aslow, βfast, βslow). It is challenging to determine how much, or in what capacity, these parameter estimates are affected. Interpretation of the estimated values of Afast and Aslow is particularly difficult, since these parameters presumably include contributions from insertion losses, diffraction, phase cancellation, and the distribution of energy among the fast and slow wave modes. These complicating factors are one of the reasons why, in Tables 3, 4, 5, no “expected” value for Afast or Aslow is given. The nBUA parameters βfast and βslow can also suffer from a similar ambiguity in their interpretation in some circumstances. However, if the internal losses in the sample under investigation are large, nBUA parameters are dominated by the contributions of the attenuation coefficient; hence, the other complicating experimental factors can sometimes be ignored. This reasoning provides an explanation for the fact that the use of this model resulted in an accurate determination of nBUA for plastic phantoms over an experimental bandwidth of 3–7 MHz, where attenuation coefficients are relatively large, but failed to do so over an experimental bandwidth of 300–700 kHz, where attenuation coefficients are relatively small.
The results presented show that Bayesian probability theory can be used to determine the individual properties of overlapping and interfering fast and slow waves that are not obtained with more conventional analysis techniques. Although the specific clinical relevance of the fast and slow wave properties has yet to be determined, knowledge of individual fast and slow wave parameters might be expected to have advantages over ultrasonic parameters determined from waveforms consisting of overlapped and interfering waves. Analysis of individual fast and slow waves may reduce or eliminate spurious conclusions resulting from mixed mode waveforms. Furthermore, supplementary parameters derived from the fast and slow waves may provide additional information about bone structure (i.e., the relative amplitude of the fast wave and slow wave). Bayesian probability theory allows the direct computation of posterior probability density functions for each parameter, as approximated by Markov chain Monte Carlo simulations, which provide easily interpreted representations of all information about a given parameter. Traditionally, Bayesian analysis has been limited by the large computational resources needed to solve complicated problems. However, advances in computing technology have resulted in the ability to apply Bayesian probability theory to problems with high dimensionality and complexity with reasonably short calculation times and at relatively low cost.
CONCLUSION
We have applied Bayesian probability theory to simulated ultrasonic data, to data acquired on two different plastic bone-mimicking phantoms, and to data from a human femur condyle specimen. Agreement between the models and data ranges from good to excellent. Marginal posterior probability densities for the model parameters accurately reflect true input values in simulated data and provide good estimates for the ultrasonic characteristics of the plastic bone-mimicking phantoms, although the analysis performs less well when the medium under study exhibits a small attenuation coefficient. Artifacts present in conventionally obtained phase velocities and attenuation coefficients are replaced by smoothly varying curves determined by probability theory.
ACKNOWLEDGMENTS
This study was supported by NIH Grant No. R01-AR057433.
References
- Barkmann R., Laugier P., Moser U., Dencks S., Klausner M., Padilla F., Haiat G., Heller M., and Glüer C. -C., “In vivo measurements of ultrasound transmission through the human proximal femur,” Ultrasound Med. Biol. 34, 1186–1190 (2008). 10.1016/j.ultrasmedbio.2007.12.008 [DOI] [PubMed] [Google Scholar]
- Droin P., Berger G., and Laugier P., “Velocity dispersion of acoustic waves in cancellous bone,” IEEE Trans. Ultrason. Ferroelectr. Freq. Control 45, 581–592 (1998). 10.1109/58.677603 [DOI] [PubMed] [Google Scholar]
- Haïat G., Padilla F., Cleveland R. O., and Laugier P., “Effects of frequency-dependent attenuation and velocity dispersion on in vitro ultrasound velocity measurements in intact human femur specimens,” IEEE Trans. Ultrason. Ferroelectr. Freq. Control 53, 39–51 (2006). 10.1109/TUFFC.2006.1588390 [DOI] [PubMed] [Google Scholar]
- NIH Consensus Development Panel on Osteoporosis Prevention, Diagnosis, and Therapy, “Osteoporosis prevention, diagnosis, and therapy,” JAMA, J. Am. Med. Assoc. 285, 785–795 (2001). 10.1001/jama.285.6.785 [DOI] [Google Scholar]
- Padilla F. and Laugier P., “Phase and group velocities of fast and slow compressional waves in trabecular bone,” J. Acoust. Soc. Am. 108, 1949–1952 (2000). 10.1121/1.1288935 [DOI] [PubMed] [Google Scholar]
- Pakula M., Padilla F., and Laugier P., “Influence of the filling fluid on frequency-dependent velocity and attenuation in cancellous bones between 0.35 and 2.5 MHz,” J. Acoust. Soc. Am. 126, 3301–3310 (2009). 10.1121/1.3257233 [DOI] [PubMed] [Google Scholar]
- Petley G. W., Robins P. A., and Aindow J. D., “Broadband ultrasonic attenuation: Are current measurement techniques inherently inaccurate?” Br. J. Radiol. 68, 1212–1214 (1995). 10.1259/0007-1285-68-815-1212 [DOI] [PubMed] [Google Scholar]
- Strelitzki R. and Evans J., “On the measurement of the velocity of ultrasound in the os calcis using short pulses,” Eur. J. Ultrasound 4, 205–213 (1996). 10.1016/S0929-8266(96)00193-0 [DOI] [Google Scholar]
- Wear K. A., Stuber A. P., and Reynolds J. C., “Relationships of ultrasonic backscatter with ultrasonic attenuation, sound speed and bone mineral density in human calcaneus,” Ultrasound Med. Biol. 26, 1311–1316 (2000). 10.1016/S0301-5629(00)00267-2 [DOI] [PMC free article] [PubMed] [Google Scholar]
- Williams J. L., “Ultrasonic wave propagation in cancellous and cortical bone: Prediction of some experimental results by Biot’s theory,” J. Acoust. Soc. Am. 91, 1106–1112 (1992). 10.1121/1.402637 [DOI] [PubMed] [Google Scholar]
- Langton C. M. and Langton D. K., “Comparison of bone mineral density and quantitative ultrasound of the calcaneus: Site-matched correlation and discrimination of axial BMD status,” Br. J. Radiol. 73, 31–35 (2000). [DOI] [PubMed] [Google Scholar]
- Njeh C. F., Kuo C. W., Langton C. M., Atrah H. I., and Boivin C. M., “Prediction of human femoral bone strength using ultrasound velocity and BMD: An in vitro study,” Osteoporosis Int. 7, 471–477 (1997). 10.1007/s001980050035 [DOI] [PubMed] [Google Scholar]
- Hosokawa A., “Effect of porosity distribution in the propagation direction on ultrasound waves through cancellous bone,” IEEE Trans. Ultrason. Ferroelectr. Freq. Control , 57, 1320–1328 (2010). 10.1109/TUFFC.2010.1552 [DOI] [PubMed] [Google Scholar]
- Fellah Z., Sebaa N., Fellah M., Mitri F., Ogam E., Lauriks W., and Depollier C., “Application of the Biot model to ultrasound in bone: Direct problem,” IEEE Trans. Ultrason. Ferroelectr. Freq. Control 55, 1508–1515 (2008). 10.1109/TUFFC.2008.826 [DOI] [PubMed] [Google Scholar]
- Haïat G., Padilla F., Peyrin F., and Laugier P., “Fast wave ultrasonic propagation in trabecular bone: Numerical study of the influence of porosity and structural anisotropy,” J. Acoust. Soc. Am. 123, 1694–1705 (2008). 10.1121/1.2832611 [DOI] [PubMed] [Google Scholar]
- Hosokawa A. and Otani T., “Ultrasonic wave propagation in bovine cancellous bone,” J. Acoust. Soc. Am. 101, 558–562 (1997). 10.1121/1.418118 [DOI] [PubMed] [Google Scholar]
- Hosokawa A. and Otani T., “Acoustic anisotropy in bovine cancellous bone,” J. Acoust. Soc. Am. 103, 2718–2722 (1998). 10.1121/1.422790 [DOI] [PubMed] [Google Scholar]
- Lee K. I., Hughes E. R., Humphrey V. F., Leighton T. G., and Choi M. J., “Empirical angle-dependent Biot and MBA models for acoustic anisotropy in cancellous bone,” Phys. Med. Biol. 52, 59–73 (2007). 10.1088/0031-9155/52/1/005 [DOI] [PubMed] [Google Scholar]
- Mizuno K., Matsukawa M., Otani T., Laugier P., and Padilla F., “Propagation of two longitudinal waves in human cancellous bone: An in vitro study,” J. Acoust. Soc. Am. 125, 3460–3466 (2009). 10.1121/1.3111107 [DOI] [PubMed] [Google Scholar]
- Anderson C. C., Marutyan K. R., Holland M. R., Wear K. A., and Miller J. G., “Interference between wave modes may contribute to the apparent negative dispersion observed in cancellous bone,” J. Acoust. Soc. Am. 124, 1781–1789 (2008). 10.1121/1.2953309 [DOI] [PMC free article] [PubMed] [Google Scholar]
- Marutyan K. R., Holland M. R., and Miller J. G., “Anomalous negative dispersion in bone can result from the interference of fast and slow waves,” J. Acoust. Soc. Am. 120, EL55–EL61 (2006). 10.1121/1.2357187 [DOI] [PubMed] [Google Scholar]
- Waters K. R. and Hoffmeister B. K., “Kramers-Kronig analysis of attenuation and dispersion in trabecular bone,” J. Acoust. Soc. Am. 118, 3912–3920 (2005). 10.1121/1.2126934 [DOI] [PubMed] [Google Scholar]
- Wear K. A., “The effect of phase cancellation on estimates of calcaneal broadband ultrasound attenuation in vivo,” IEEE Trans. Ultrason. Ferroelectr. Freq. Control 54, 1352–1359 (2007). 10.1109/TUFFC.2007.395 [DOI] [PMC free article] [PubMed] [Google Scholar]
- Wear K. A., “The effect of phase cancellation on estimates of broadband ultrasound attenuation and backscatter coefficient in human calcaneus in vitro,” IEEE Trans. Ultrason. Ferroelectr. Freq. Control 55, 384–390 (2008). 10.1109/TUFFC.2008.656 [DOI] [PMC free article] [PubMed] [Google Scholar]
- Bauer A., Marutyan K., Holland M., and Miller J., “Is the Kramers-Kronig relationship between ultrasonic attenuation and dispersion maintained in the presence of apparent losses due to phase cancellation?” J. Acoust. Soc. Am. 122, 222–228 (2007). 10.1121/1.2735803 [DOI] [PubMed] [Google Scholar]
- O’Donnell M., Jaynes E., and Miller J., “General relationships between ultrasonic attenuation and dispersion,” J. Acoust. Soc. Am. 63, 1935–1937 (1978). 10.1121/1.381902 [DOI] [Google Scholar]
- O’Donnell M., Jaynes E. T., and Miller J. G., “Kramers-Kronig relationship between ultrasonic attenuation and phase velocity,” J. Acoust. Soc. Am. 69, 696–701 (1981). 10.1121/1.385566 [DOI] [Google Scholar]
- Toll J. S., “Causality and the dispersion relation: Logical foundations,” Phys. Rev. 104, 1760–1770 (1956). 10.1103/PhysRev.104.1760 [DOI] [Google Scholar]
- Waters K., Hughes M., Brandenburger G., and Miller J., “On a time-domain representation of the Kramers-Kronig dispersion relations,” J. Acoust. Soc. Am. 108, 2114–2119 (2000). 10.1121/1.1315294 [DOI] [PubMed] [Google Scholar]
- Waters K., Hughes M., Mobley J., and Miller J., “Differential forms of the Kramers-Kronig dispersion relations,” IEEE Trans. Ultrason. Ferroelectr. Freq. Control 50, 68–76 (2003). 10.1109/TUFFC.2003.1176526 [DOI] [PubMed] [Google Scholar]
- Waters K., Mobley J., and Miller J., “Causality-imposed (Kramers-Kronig) relationships between attenuation and dispersion,” IEEE Trans. Ultrason. Ferroelectr. Freq. Control 52, 822–823 (2005). 10.1109/TUFFC.2005.1503968 [DOI] [PubMed] [Google Scholar]
- Waters K. R., Hughes M. S., Mobley J., Brandenburger G. H., and Miller J. G., “On the applicability of Kramers–Krönig relations for ultrasonic attenuation obeying a frequency power law,” J. Acoust. Soc. Am. 108, 556–563 (2000). 10.1121/1.429586 [DOI] [PubMed] [Google Scholar]
- Bauer A. Q., Marutyan K. R., Holland M. R., and Miller J. G., “Negative dispersion in bone: The role of interference in measurements of the apparent phase velocity of two temporally overlapping signals,” J. Acoust. Soc. Am. 123, 2407–2414 (2008). 10.1121/1.2839893 [DOI] [PMC free article] [PubMed] [Google Scholar]
- Nicholson P. H., Lowet G., Langton C. M., Dequeker J., and Van der Perre G., “A comparison of time-domain and frequency-domain approaches to ultrasonic velocity measurement in trabecular bone,” Phys. Med. Biol. 41, 2421–2435 (1996). 10.1088/0031-9155/41/11/013 [DOI] [PubMed] [Google Scholar]
- Wear K. A., “Measurements of phase velocity and group velocity in human calcaneus,” Ultrasound Med. Biol. 26, 641–646 (2000). 10.1016/S0301-5629(99)00172-6 [DOI] [PMC free article] [PubMed] [Google Scholar]
- Wear K. A., “Group velocity, phase velocity, and dispersion in human calcaneus in vivo,” J. Acoust. Soc. Am. 121, 2431–2437 (2007). 10.1121/1.2697436 [DOI] [PMC free article] [PubMed] [Google Scholar]
- Wear K. A., “Frequency dependence of average phase shift from human calcaneus in vitro,” J. Acoust. Soc. Am. 126, 3291–3300 (2009). 10.1121/1.3257550 [DOI] [PubMed] [Google Scholar]
- Sebaa N., Fellah Z., Fellah M., Ogam E., Mitri F., Depollier C., and Lauriks W., “Application of the Biot model to ultrasound in bone: Inverse problem,” IEEE Trans. Ultrason. Ferroelectr. Freq. Control 55, 1516–1523 (2008). 10.1109/TUFFC.2008.827 [DOI] [PubMed] [Google Scholar]
- Anderson C. C., Marutyan K. R., Wear K. A., Holland M. R., Miller J. G., and Bretthorst G. L., “Model selection in ultrasonic measurements on trabecular bone,” AIP Conf. Proc. 954, 337–345 (2007). 10.1063/1.2821280 [DOI] [Google Scholar]
- Anderson C. C., Pakula M., Holland M. R., Laugier P., Bretthorst G. L., and Miller J. G., “Decomposition of interfering ultrasonic waves in bone and bone-mimicking materials,” AIP Conf. Proc. 1193, 321–328 (2009). 10.1063/1.3275629 [DOI] [Google Scholar]
- Marutyan K. R., Anderson C. C., Wear K. A., Holland M. R., Miller J. G., and Bretthorst G. L., “Parameter estimation in ultrasonic measurements on trabecular bone,” AIP Conf. Proc. 954, 329–336 (2007). 10.1063/1.2821279 [DOI] [Google Scholar]
- Marutyan K. R., Bretthorst G. L., and Miller J. G., “Bayesian estimation of the underlying bone properties from mixed fast and slow mode ultrasonic signals,” J. Acoust. Soc. Am. 121, EL8–EL15 (2007). 10.1121/1.2401198 [DOI] [PubMed] [Google Scholar]
- Wear K., “Decomposition of two-component ultrasound pulses in cancellous bone using modified least squares Prony method-phantom experiment and simulation,” Ultrasound Med. Biol. 36, 276–287 (2010). 10.1016/j.ultrasmedbio.2009.06.1092 [DOI] [PMC free article] [PubMed] [Google Scholar]
- Sivia D. S. and Skilling J., Data Analysis: A Bayesian Tutorial (Cambridge University Press, Cambridge, 2006), pp. 1–246. [Google Scholar]
- Bretthorst G. L., Hutton W. C., Garbow J. R., and Ackerman J. J. H., “Exponential parameter estimation (in NMR) using Bayesian probability theory,” Concepts Magn. Reson. 27A, 55–63 (2005). 10.1002/cmr.a.20043 [DOI] [Google Scholar]
- Jeffreys H. S., Theory of Probability (Oxford University Press, Oxford, 1961), pp. 1–470. [Google Scholar]
- Bretthorst G. L., Hutton W. C., Garbow J. R., and Ackerman J. J. H., “Exponential model selection (in NMR) using Bayesian probability theory,” Concepts Magn. Reson. 27A, 64–72 (2005). 10.1002/cmr.a.20042 [DOI] [Google Scholar]
- Hastings W. K., “Monte Carlo sampling methods using Markov chains and their applications,” Biometrika 57, 97–109 (1970). 10.1093/biomet/57.1.97 [DOI] [Google Scholar]
- Metropolis N., Rosenbluth A., Rosenbluth M., Teller A., and Teller E., “Equation of state calculations by fast computing machines,” J. Chem. Phys. 21, 1087–1092 (1953). 10.1063/1.1699114 [DOI] [Google Scholar]
- Neal R., Probabilistic Inference Using Markov Chain Monte Carlo Methods (University of Toronto, Toronto, 1993), pp. 1–144. [Google Scholar]
- Bauer A., Anderson C., Holland M., and Miller J., “Measurement artifacts in sonometry of cancellous bone: The relative impact of phase cancellation and interference on measurements of phase-distorting phantoms,” 2008 IEEE International Ultrasonics Symposium Proceedings (2008), pp. 137–141.
- Bauer A. Q., Anderson C. C., Holland M. R., and Miller J. G., “Bone sonometry: Reducing phase aberration to improve estimates of broadband ultrasonic attenuation,” J. Acoust. Soc. Am. 125, 522–529 (2009). 10.1121/1.3035841 [DOI] [PMC free article] [PubMed] [Google Scholar]


