Abstract
Translocation of DNA oligomers through a single walled carbon nanotube was demonstrated recently. Translocation events are accompanied by giant current pulses, the origin of which remains obscure. Here, we show that introduction of a nucleotide alone, guanosine triphosphate into the input reservoir of a carbon nanotube nanofluidic also gives giant current pulses. Taken together with data on oligomer translocation, theses new results suggest that pulse width has a non-linear, power-law dependence on the number of nucleotides in a DNA molecule. We have also measured the time for the onset of DNA translocation pulses after bias reversal, finding that the time for the onset of translocation is directly proportional to the period of bias reversal.
1. Introduction
Nanopores are orifices of molecular diameter that connect two fluid reservoirs [1]. Kasianowicz et al first demonstrated translocation of DNA through a α-hemolysin (αHL) protein nanopore under external electrical field in 1996 [2]. Since then, there have been growing interests in applying nanopores as single molecule sensors and biophysics tools for studying biomolecules (DNA, RNA, protein, etc) [3, 4]. Single molecule DNA sequencing is one of the exciting applications proposed for nanopore [5]. The principle underlying nanopores is straightforward: nanopores can act as Coulter counters. When a single molecule carrying net charges is driven through the molecular size pore by an applied electric potential, it can physically block the pore during the translocation, which produces measurable and distinctive changes in ionic current.
There are mainly two types of nanopores: biological nanopores (e.g., αHL) and synthetic nanopores (also known as solid state nanopores). Recently, the carbon nanotube (CNT) emerged as a new type of synthetic nanopore. CNTs are remarkable materials [6, 7]. They are perfect seamless cylinders, formed by rolling up a graphene sheet (figure 1(a)) and capping each ends with half of a fullerene molecule. Depending on the number of layers, the CNT can be divided into single-walled carbon nanotube (SWCNT), double-walled carbon nanotube (DWCNT), and multi-walled carbon nanotube (MWCNT). Carbon Nanotube based nanofluidic is a burgeoning field [8–11]. From a biological point of view, the CNT is an ideal model to help understand the biological membrane channels that work in aqueous environments with hydrophobic inner walls and nanometer channel sizes. From a fundamental research point of view, it's an exciting system to test classical theories of fluid flow at the nanoscale. From an application point of view, CNTs are perfect candidates for nanopores or nanochannels in nanofluidic devices. (1) They require no special nanofabrication to achieve a pore size of less than 5 nm. They have an atomically smooth surface and perfect uniformity over large distances. (2) For high quality CNTs, the chemistry and structures of the interior surface are well-defined, which simplifies theoretical simulations. (3) The excellent electrical properties of CNT provide new routes to electrical detection, trapping and manipulation of charged biomolecules and nanoparticles. (4) Well-defined sites are available for chemical functionalization at the ends of the tubes. Such modifications will be extremely useful for ion and molecule selection, gating or separation.
Figure 1.
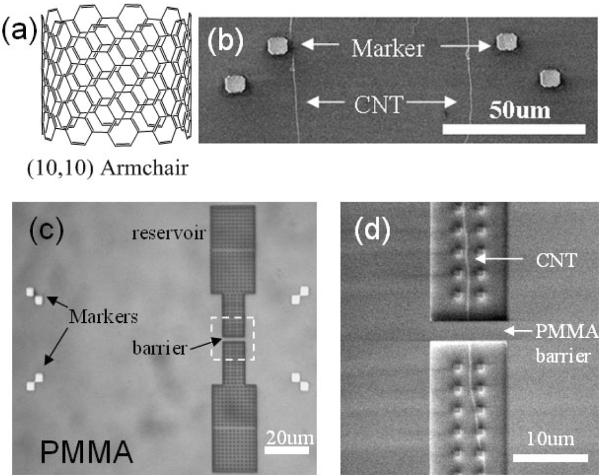
(a) The atomic structure of a (10, 10) armchair SWCNT (~1.4 nm in diameter). (b) SEM of SWCNTs on silicon oxide surface. The gold markers are fabricated after SWCNT growth and are used to locate the CNT. (c) Optical image of a fabricated device after EBL step. Gold alignment markers and reservoirs are clearly seen. The white dashed square labeled the barrier area. (d) SEM of the barrier area (~2 μm in width). One SWCNT passes the barrier and bridges two reservoirs. The SWCNT in the reservoirs will disappear after oxygen plasma.
To utilize CNT as a nanopore or nanochannel, it's important to first understand the transport of water through CNT. It seems counter intuitive that water will enter and transport through hydrophobic and nanometer-sized CNT. However, Hummer et al. have used large scale molecular dynamics (MD) simulations to observe the spontaneous wetting and filling of a (6,6) CNT (1.34 nm in length) with water molecules [12]. The nanoscale confinement and the interactions between water and CNT surface are found critical. The water molecules form ordered structures inside CNT, which makes confined water within the CNT more stable than bulk water. The lower free energy of confined water drives water molecules into the CNT automatically. Very fast water transport through CNT was predicted because of the friction-less motion. Following the pioneering work of water molecule transport, the translocations of more complicated molecules, such as long chain polymer molecules [13], DNA [14] and RNA [15] through CNT were simulated as well. Simulations revealed that DNA molecules enter CNT spontaneously with the aid of van der Waals and hydrophobic interaction forces [16] and the translocation events can be driven by electric field [14].
So far, experimental studies by nuclear magnetic resonance (NMR) [17], X-ray diffraction (XRD) [18], IR spectroscopy [19], transmission electron microscope (TEM) [20] and scanning electron microscope (SEM) [21] have confirmed that water could enter and form ordered structures in SWCNTs or MWCNTs. More direct transport measurements are finished by using CNT membrane, which consists of millions of carbon nanotubes in parallel [11]. Hinds' group has pioneered a MWCNT membrane fabrication strategy [22]. They cast a polystyrene polymer layer on a vertical aligned MWCNT forest to fill the gaps between MWCNTs and form an impenetrable membrane. Then both ends of the MWCNT were opened by oxygen plasma. Holt et al followed the work by replacing the polymer with low-stress silicon nitride and using smaller sized DWCNT [23]. Both groups found that the mobility of gas, water and ions can be indeed greatly enhanced inside the tube. The transport of small redox and fluorescent molecules through CNTs has also been measured [24, 25]. The CNT membrane is relatively easy to fabricate and is perfect for applications such as molecular separation and sea water desalination [25, 26].
Inspired by these experiments and theories, we set out to fabricate single carbon nanotube based nanofluidic device. There are several reasons to pursue individual CNT based nanofluidic device. First, the CNTs are heterogeneous in physical properties. The single CNT approach allows us to carefully study the properties of individual CNT nanopores, facilitating development of a fundamental understanding of the mechanisms. Second, the single CNT approach provides great potential for detecting and controlling the translocation of water, ion and small organic/bio molecules through CNT. The excellent electrical properties of individual CNTs are readily utilized. We have shown that the semiconducting CNTs were permanently switched on after filling CNT with pure water [27]. The transition of CNT electrical properties during water filling and conduction will provide a valuable probe for studying CNT based nanofluidic phenomena. Crook's group did some preliminary experiments in the single CNT direction by fabricating devices containing only one carbon nanofiber (about 150 nm in diamter) in epoxy membrane [28]. Shashank et al also reported the fabrication and fluid flow measurements of devices based on individual carbon nanopipe (about 300 nm in diameter) [29]. We have successfully fabricated molecular size CNT (about 2 nm in diameter) based nanofluidic device with only one SWCNT bridging two fluid reservoirs. The translocation of short single-stranded DNA through SWCNT (mainly metallic) was studied, as marked by unusual electrical signals and confirmed by polymerase chain reaction (PCR) [27]. Interestingly, the ionic current signatures during DNA translocation in SWCNT are quite different from those in silicon based nanopore/nanochannel [30–32]. The origin is not clear yet. One reason may stem from the unique geometrical and electrical property of CNT. In addition, experimental and theoretical studies have revealed the complicated interactions between DNA oligomers and the graphitic surface [33–37], which should also affect the translocation dynamics of DNA and hence the electrical signal structures in ionic current. It's still a challenging task to understand the DNA translocation events in CNT, which requires numerous experiments and simulations.
In this paper, we will first briefly explain the device fabrication and ionic current measurement. High ionic current was measured in a fraction of the devices, and was attributed to the rapid electro-osmotic flow in the tube according to the multi-scale simulations. It appears that small molecules will enter the tube much more readily than long polymers, so we have studied the signals obtained from guanosine triphosphate (GTP) as a model of an N=1 molecule (or N=3 based on charges). We cannot use PCR to confirm translocation (cf. section 3), but the similarity in signals suggests that translocation of GTP does occur. We also present new data on the onset time for DNA translocation signals as a function of the time for which bias was previously reversed.
2. Device fabrication and ionic current measurement
Device fabrication has been described in detail previously [27]. In brief, well separated and high quality SWCNT was grown on silicon oxide surface by the chemical vapor deposition (CVD) method using ethanol as carbon source and Cobalt nanoparticles as catalyst [38]. The average outer diameter of SWCNT is about 1.6 nm as determined by atomic force microscope (AFM). After the growth, gold alignment marks were patterned on the substrate to register the location of the CNTs (figure 1(b)). Then the substrate was coated with a 800 nm thick poly (methyl methacrylate) (PMMA) layer and the reservoir patterns were generated by electron beam lithography (EBL). An optical image of the device is shown in figure 1(c). The SEM image of the barrier area (figure 1(d)) shows that only one CNT is buried under the 2 μm wide barrier and bridges the two reservoirs. Oxygen plasma was used to remove the exposed CNT in the reservoirs and open the ends. The intensity of oxygen plasma needs to be carefully controlled to avoid damaging the PMMA surface. Control devices without CNT are always fabricated in the same chip to monitor the leakage current.
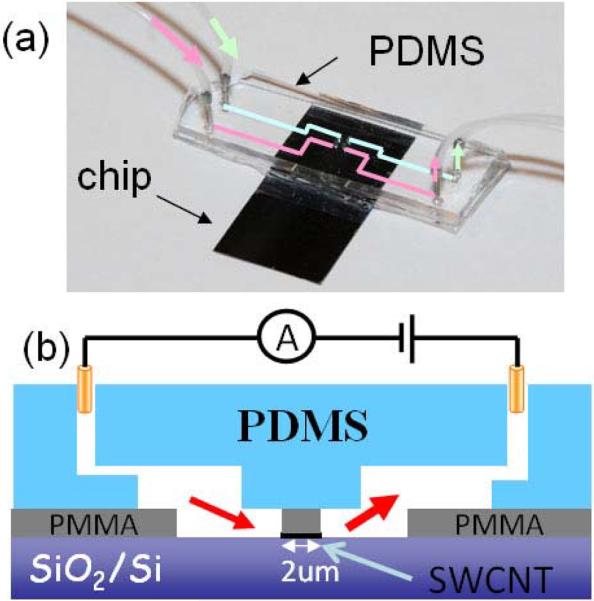
As shown in figure 2 (a) and (b), a polydimethylsiloxane (PDMS) stamp with embedded microfluidic channels seals the top surface of the device. Buffered KCl solution (1mM PBS buffer, pH=7) is injected into both reservoirs and reaches the CNT openings. Silver/silver chloride electrodes (BASI MF-2078) are immersed in the salt solution. A voltage is applied between the two reservoirs and the ionic current is recorded (figure 2 (b)) using an Axopatch 200B (Molecular Devices, Inc., CA).
Figure 2.
(a) Optical image of an assembled device with one pair of silicon tubes for flushing the input channel (green pathway) and a second set for flushing the output channel (pink pathway). (b) Schematics of the cross-section of the assembled device and the ionic current measurement setup.
We found [27] an enormous range of ion currents through these devices, apparently uncorrelated with SWCNT diameter. We also made field effect transistors (FETs) out of the tubes used for translocation and measured their electronic properties. On doing this, we found that the ion transport fell into two categories. The low current group (where currents correlated well with classical models) was mainly made up by the semiconducting tubes. The high current group was mainly composed by the metallic tubes. Theoretical multiscale modeling suggests that electro-osmosis dominates over electrophoresis in the metallic tubes that show large ionic conductivity. We focus on devices made with these tubes in what follows.
3. GTP Translocation
Short ssDNA oligomers were chosen for the CNT translocation experiments. Quantitative PCR (Q-PCR) was used to verify DNA translocation. PCR is a fascinating molecular biology technique that a few or even single copies of DNA can be quickly and exponentially amplified to millions of copies. Therefore PCR is an ideal tool to detect trace amount of DNA with known sequence. However, the minimum length of DNA that can be amplified is about 20 nt. We have measured the translocation of 60nt, 120nt and 180nt long oligomers. In all the experiments, large transient increases (“spikes”) in ionic current were observed. Those spikes signal the molecular translocation events, as confirmed by Q-PCR for the 60 and 120 nt oligomers. In general, the shorter oligomers show shorter spike width, but these widths are large compared to the translocation times observed with conventional nanopores [39]. This raises the question of whether a single nucleoside-triphosphate can generate a measureable signal.
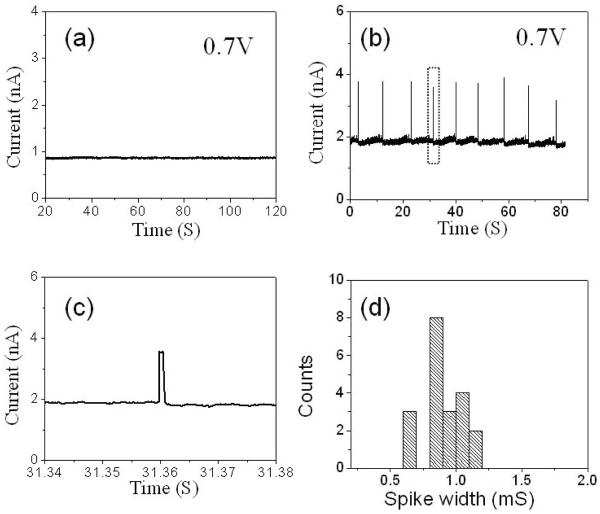
To test for this possibility, we used a guanosine 5'-triphosphate (Sigma Aldrich, HPLC grade) molecule. The device has a SWCNT bridging 2 μm barrier. Two control devices were fabricated on the same chip to test the leakage current. Before the introduction of 5 μM GTP into the input reservoir, the ionic current of the device at 1M buffered KCl (1mM PBS buffer, pH=7) solution was measured by applying a 700 mV bias at the output reservoir (input reservoir is grounded) for several minutes. An example of the ionic current time trace is shown in figure 3 (a). The ionic current was about 1.2 nS. No spikes or other fluctuations were observed in the ionic current. After the introduction a solution of 5 μM GTP in 1M buffered KCl solution, the ionic current gradually increased to 2.9 nS and large transient increases in ionic current were observed at 700 mV. These “spikes” were accompanied by fluctuations in the background current (figure 3 (b) and (c)). No spikes were observed, at smaller or negative biases. These spikes must be induced by GTP and are most likely due to the translocation of GTP molecules, although this cannot be tested by PCR. The average spike duration is about 0.86 ± 0.15 ms (figure 3 (d)).
Figure 3.
(a) An example of ionic current versus time at an applied voltage of 700 mV in 1M buffered KCl solution (1mM PBS, pH 7). (b) Upward spikes appear in the ionic current versus time at an applied voltage of 700 mV after the addition of 5μM guanosine triphosphate (GTP) GTP (1M KCl, 1mM PBS, pH 7) into the input reservoir. (c) A zoom-in of one typical current spike in (b) (inside the dot lines). (d) The histogram of the spike width. The average duration of the spike is 0.86 ± 0.15 ms.
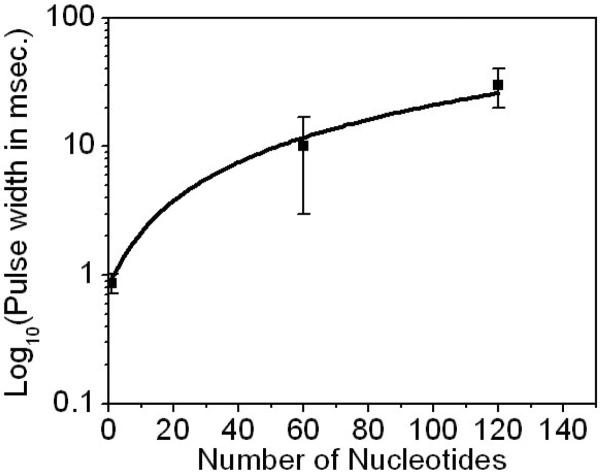
Figure 4 shows a plot of the log of the average pulse width for 120 and 60 nt DNA (both at 500 mV). The pulse widths are widely distributed, but plotted together with the datum for GTP (at 700 mV), they suggest a non-linear, power-law relationship (~ 0.08 N1.2) between the number of nucleotides and translocation time. For the purposes of this plot, GTP has been shown as N=1. If the backbone charge is the important physical parameter, then the GTP data point should be moved to N=3. The errors in the data are such that this would not alter the important implication of a power-law relationship between pulse width and polymer length. Certainly, this relation needs to be further verified on much longer ssDNA.
Figure 4.
Semi-log plot of the average pulse width versus the number of nucleotide in the ssDNA oligomers. The solid line is a non-linear, power-law fitting (~0.08 N1..2) to the experimental data. The bias is 500 mV for oligomers and 700 mV for GTP.
4. Accumulation times for DNA Translocation
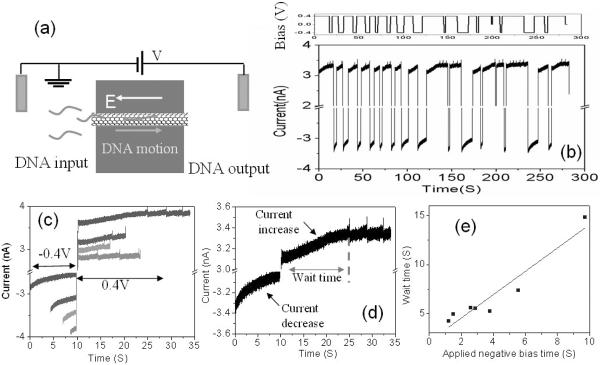
Here we turn to investigate in more detail the timescale associated with DNA accumulation at the input to the SWCNT. The reference electrode in the DNA input reservoir is grounded as shown in figure 5 (a). 0.1 nM 60 nt ssDNA is injected into the input reservoir. Both reservoirs contain 1M KCl solution with 1mM PBS buffer (pH 7). Translocation requires that the output reservoir is biased positive with respect to the input reservoir. After the onset of tranlocation signals, we investigated the effects of reversing the polarity applied to the device.
Figure 5.
(a) The schematic of a DNA translocation measurement setup. The electrode at input reservoir is always grounded. 0.1nM 60 nt DNA is injected in the input reservoir. (b) The time trace of ionic current when switching the polarity of bias at output reservoir. (c) Re-organized ionic current data by aligning ionic current at voltage transition position. (d) The zoom-in of one typical data. The current magnitude always increases at positive bias and decreases at negative bias. Spikes appear after a wait time at positive bias and no spikes at negative bias. (e) The relationship between the wait time and the applied negative bias. The solid line is a linear fit to the experimental data.
We switch the bias between −0.4 V and 0.4 V back and forth frequently and recorded the ionic current through the device. A typical time trace of the current is shown in the lower panel of figure 5 (b). The applied voltage versus time is shown in the upper panel of figure 5 (b). The ionic current data in figure 5 (b) can be reorganized by aligning ionic current at the negative to positive voltage transition position. The re-plotted data is shown in figure 5 (c) – lines to the left of 10s (arbitrarily set to the transition time) represent current versus time as the output reservoir sat at −0.4V (time stopping at 10s), while those to the right represent current versus time as the output reservoir sat at +0.4V (time starting at 10s). Note that translocation spikes are only observed when the output reservoir is positive, as previously reported [27].
One recording through a bias reversal is expanded in Figure 5 (d) to show the wait time for the onset of translocation spikes more clearly. The wait time is plotted vs. the period for which bias was reversed in Figure 5 (e). Clearly, DNA is swept away from the entrance to the device when the input reservoir is biased positive. The recovery time for the onset of signals is very close (slope = 1.2) to the time for which the bias was reversed. This suggests that the wait time reflects the time needed to acquire an adequate concentration of DNA on the input side of the tube. Such a pre-concentration process has been demonstrated in other microfluidc to nanofluidic interfaces [40, 41]. So the existence of a wait time may suggest that the DNA translocation can only start when the local DNA concentration at the entrance achieves a critical level. This might imply a collective DNA translocation (i.e. more than one molecule translocating at a time), consistent with the measured relationship between the number of translocation spikes and amount of DNA translocated [27].
5. Conclusions
In conclusion, we have successfully fabricated individual CNT based nanofluidic devices and demonstrated the translocation of ion and DNA through individual SWCNTs. The device fabrication methods are straightforward and can be generally applied to SWCNTs, MWCNTs, carbon nanofibers and etc. The new data for the translocation times of GTP are suggestive of a power-law relationship between translocation time and polymer length. If this turns out to be a generally valid result, it is important because it predicts a very slow translocation speed of very long DNA through devices. More data is needed on the relationship between translocation time, applied bias, polymer length, tube diameter and tube length. The correct choice of tube dimensions might permit translocation of long DNA while also slowing it to a speed that matches sequence readout. This is a critical missing component of current nanopore devices where translocation is generally much too rapid [5]. Our study of the wait times points to the pre-concentration of DNA at the entrance to the device. This is clearly important because it suggests that very small amounts of DNA could be handled simply by increasing the wait time for translocation.
Individual CNT based nanofluidic devices may open new avenues for fundamental research, such as molecular confinement and mass transport at nanoscale, and practical applications, such as new schemes for DNA sequencing and new type of single molecule sensor. To achieve these goals, significant efforts in experiment and theory are needed. We will continue to improve the device fabrication methods, carried out detailed and systematic experiments, and also use large multi-scale simulations to understand the considerable number of new physical and chemical phenomena appeared in these devices.
Acknowledgments
This work was supported by the grants from the DNA sequencing technology program of the National Human Genome Research Institute (1R21HG004770-01, 1RC2HG005625-01), Arizona Technology Enterprises and the Biodesign Institute. We acknowledge valuable discussions with Dr. Haitao Liu, Dr. Collin Nuckolls, Dr. P. Krstic, Dr. S. Joseph, and Dr. J. H. Park. We also acknowledge the use of facilities within the Center for Solid State Science (CSSS) at Arizona State University.
References
- [1].Howorka S, Siwy Z. Nanopore analytics: sensing of single molecules. Chemical Society Reviews. 2009;38:2360–84. doi: 10.1039/b813796j. [DOI] [PubMed] [Google Scholar]
- [2].Kasianowicz J, Brandin E, Branton D, Deamer D. Characterization of individual polynucleotide molecules using a membrane channel. Proceedings of the National Academy of Sciences of the United States of America. 1996;93:13770–3. doi: 10.1073/pnas.93.24.13770. [DOI] [PMC free article] [PubMed] [Google Scholar]
- [3].Kasianowicz JJ, Henrickson SE, Weetall HH, Robertson B. Simultaneous multianalyte detection with a nanometer-scale pore. Analytical Chemistry. 2001;73:2268–72. doi: 10.1021/ac000958c. [DOI] [PubMed] [Google Scholar]
- [4].Kasianowicz JJ, Henrickson SE, Misakian M, Weetall HH, Robertson B. Applications for DNA transport in a single nanopore. Biophysical Journal. 2001;80:1418. [Google Scholar]
- [5].Branton D, Deamer DW, Marziali A, Bayley H, Benner SA, Butler T, Di Ventra M, Garaj S, Hibbs A, Huang XH, Jovanovich SB, Krstic PS, Lindsay S, Ling XSS, Mastrangelo CH, Meller A, Oliver JS, Pershin YV, Ramsey JM, Riehn R, Soni GV, Tabard-Cossa V, Wanunu M, Wiggin M, Schloss JA. The potential and challenges of nanopore sequencing. Nat. Biotechnol. 2008;26:1146–53. doi: 10.1038/nbt.1495. [DOI] [PMC free article] [PubMed] [Google Scholar]
- [6].Iijima S. Helical Microtubules of Graphitic Carbon. Nature. 1991;354:56–8. [Google Scholar]
- [7].Saito R, Dresselhaus G, Dresselhaus MS. Physical properties of carbon nanotubes. Imperal College Press; 1998. [Google Scholar]
- [8].Mattia D, Gogotsi Y. Review: static and dynamic behavior of liquids inside carbon nanotubes. Microfluidics and Nanofluidics. 2008;5:289–305. [Google Scholar]
- [9].Schoch RB, Han J, Renaud P. Transport phenomena in nanofluidics. Reviews of Modern Physics. 2008;80:839. [Google Scholar]
- [10].Noy A, Park HG, Fornasiero F, Holt JK, Grigoropoulos CP, Bakajin O. Nanofluidics in carbon nanotubes. Nano Today. 2007;2:22–9. [Google Scholar]
- [11].Whitby M, Quirke N. Fluid flow in carbon nanotubes and nanopipes. Nat Nano. 2007;2:87–94. doi: 10.1038/nnano.2006.175. [DOI] [PubMed] [Google Scholar]
- [12].Hummer G, Rasaiah JC, Noworyta JP. Water conduction through the hydrophobic channel of a carbon nanotube. Nature. 2001;414:188–90. doi: 10.1038/35102535. [DOI] [PubMed] [Google Scholar]
- [13].Wei C, Srivastava D. Theory of Transport of Long Polymer Molecules through Carbon Nanotube Channels. Physical Review Letters. 2003;91:235901. doi: 10.1103/PhysRevLett.91.235901. [DOI] [PubMed] [Google Scholar]
- [14].Yinghong X, Yong K, Soh AK, Huajian G. Electric field-induced translocation of single-stranded DNA through a polarized carbon nanotube membrane. The Journal of Chemical Physics. 2007;127:225101. doi: 10.1063/1.2799989. [DOI] [PubMed] [Google Scholar]
- [15].Yeh I-C, Hummer G. Nucleic acid transport through carbon nanotube membranes. Proceedings of the National Academy of Sciences of the United States of America. 2004;101:12177–82. doi: 10.1073/pnas.0402699101. [DOI] [PMC free article] [PubMed] [Google Scholar]
- [16].Gao H, Kong Y, Cui D, Ozkan CS. Spontaneous Insertion of DNA Oligonucleotides into Carbon Nanotubes. Nano Letters. 2003;3:471–3. [Google Scholar]
- [17].Chen M, Khalid S, Sansom MSP, Bayley H. Outer membrane protein G: Engineering a quiet pore for biosensing. Proceedings of the National Academy of Sciences of the United States of America. 2008;105:6272–7. doi: 10.1073/pnas.0711561105. [DOI] [PMC free article] [PubMed] [Google Scholar]
- [18].Maniwa Y, Matsuda K, Kyakuno H, Ogasawara S, Hibi T, Kadowaki H, Suzuki S, Achiba Y, Kataura H. Water-filled single-wall carbon nanotubes as molecular nanovalves. Nat Mater. 2007;6:135–41. doi: 10.1038/nmat1823. [DOI] [PubMed] [Google Scholar]
- [19].Byl O, Liu JC, Wang Y, Yim WL, Johnson JK, Yates JT. Unusual Hydrogen Bonding in Water-Filled Carbon Nanotubes. J. Am. Chem. Soc. 2006;128:12090–7. doi: 10.1021/ja057856u. [DOI] [PubMed] [Google Scholar]
- [20].Naguib N, Ye H, Gogotsi Y, Yazicioglu AG, Megaridis CM, Yoshimura M. Observation of Water Confined in Nanometer Channels of Closed Carbon Nanotubes. Nano Letters. 2004;4:2237–43. [Google Scholar]
- [21].Rossi MP, Ye H, Gogotsi Y, Babu S, Ndungu P, Bradley J-C. Environmental Scanning Electron Microscopy Study of Water in Carbon Nanopipes. Nano Letters. 2004;4:989–93. [Google Scholar]
- [22].Hinds BJ, Chopra N, Rantell T, Andrews R, Gavalas V, Bachas LG. Aligned Multiwalled Carbon Nanotube Membranes. Science. 2004;303:62–5. doi: 10.1126/science.1092048. [DOI] [PubMed] [Google Scholar]
- [23].Holt JK, Park HG, Wang YM, Stadermann M, Artyukhin AB, Grigoropoulos CP, Noy A, Bakajin O. Fast mass transport through sub-2-nanometer carbon nanotubes. Science. 2006;312:1034–7. doi: 10.1126/science.1126298. [DOI] [PubMed] [Google Scholar]
- [24].Majumder M, Chopra N, Hinds BJ. Effect of Tip Functionalization on Transport through Vertically Oriented Carbon Nanotube Membranes. Journal of the American Chemical Society. 2005;127:9062–70. doi: 10.1021/ja043013b. [DOI] [PubMed] [Google Scholar]
- [25].Fornasiero F, Park HG, Holt JK, Stadermann M, Grigoropoulos CP, Noy A, Bakajin O. Ion exclusion by sub-2-nm carbon nanotube pores. Proceedings of the National Academy of Sciences. 2008;105:17250–5. doi: 10.1073/pnas.0710437105. [DOI] [PMC free article] [PubMed] [Google Scholar]
- [26].Corry B. Designing Carbon Nanotube Membranes for Efficient Water Desalination. The Journal of Physical Chemistry B. 2007;112:1427–34. doi: 10.1021/jp709845u. [DOI] [PubMed] [Google Scholar]
- [27].Liu H, He J, Tang J, Liu H, Pang P, Cao D, Krstic P, Joseph S, Lindsay S, Nuckolls C. Translocation of Single-Stranded DNA Through Single-Walled Carbon Nanotubes. Science. 2010;327:64–7. doi: 10.1126/science.1181799. [DOI] [PMC free article] [PubMed] [Google Scholar]
- [28].Sun L, Crooks RM. Single Carbon Nanotube Membranes: A Well-Defined Model for Studying Mass Transport through Nanoporous Materials. Journal of the American Chemical Society. 2000;122:12340–5. [Google Scholar]
- [29].Shashank S, Maria Pia R, Mattia D, Yury G, Haim HB. Induction and measurement of minute flow rates through nanopipes. Physics of Fluids. 2007;19:013603. [Google Scholar]
- [30].Liang X, Chou SY. Nanogap Detector Inside Nanofluidic Channel for Fast Real-Time Label-Free DNA Analysis. Nano Letters. 2008;8:1472–6. doi: 10.1021/nl080473k. [DOI] [PubMed] [Google Scholar]
- [31].Fan R, Karnik R, Yue M, Li D, Majumdar A, Yang P. DNA Translocation in Inorganic Nanotubes. Nano Letters. 2005;5:1633–7. doi: 10.1021/nl0509677. [DOI] [PubMed] [Google Scholar]
- [32].Li J, Stein D, McMullan C, Branton D, Aziz MJ, Golovchenko JA. Ion-beam sculpting at nanometre length scales. Nature. 2001;412:166–9. doi: 10.1038/35084037. [DOI] [PubMed] [Google Scholar]
- [33].Johnson RR, Johnson ATC, Klein ML. Probing the Structure of DNA-carbon Nanotube Hybrids with Molecular Dynamics. Nano Letters. 2007;8:69–75. doi: 10.1021/nl071909j. [DOI] [PubMed] [Google Scholar]
- [34].Gowtham S, Scheicher RH, Ahuja R, Pandey R, Karna SP. Physisorption of nucleobases on graphene: Density-functional calculations. Physical Review B. 2007;76:033401. [Google Scholar]
- [35].Robert RJ, Johnson ATC, Michael LK. The Nature of DNA-Base-Carbon-Nanotube Interactions. Small. 6:31–4. doi: 10.1002/smll.200901481. [DOI] [PubMed] [Google Scholar]
- [36].Manohar S, Mantz AR, Bancroft KE, Hui C-Y, Jagota A, Vezenov DV. Peeling Single-Stranded DNA from Graphite Surface to Determine Oligonucleotide Binding Energy by Force Spectroscopy. Nano Letters. 2008;8:4365–72. doi: 10.1021/nl8022143. [DOI] [PMC free article] [PubMed] [Google Scholar]
- [37].Zheng M, Jagota A, Strano MS, Santos AP, Barone P, Chou SG, Diner BA, Dresselhaus MS, McLean RS, Onoa GB, Samsonidze GG, Semke ED, Usrey M, Walls DJ. Structure-Based Carbon Nanotube Sorting by Sequence-Dependent DNA Assembly. Science. 2003;302:1545–8. doi: 10.1126/science.1091911. [DOI] [PubMed] [Google Scholar]
- [38].Sreekar B, et al. Block-copolymer assisted synthesis of arrays of metal nanoparticles and their catalytic activities for the growth of SWNTs. Nanotechnology. 2006;17:5080. [Google Scholar]
- [39].Dekker C. Solid-state nanopores. Nature Nanotechnology. 2007;2:209–15. doi: 10.1038/nnano.2007.27. [DOI] [PubMed] [Google Scholar]
- [40].Jin X, Joseph S, Gatimu EN, Bohn PW, Aluru NR. Induced Electrokinetic Transport in Micro-Nanofluidic Interconnect Devices. Langmuir. 2007;23:13209–22. doi: 10.1021/la702326v. [DOI] [PubMed] [Google Scholar]
- [41].Kim SJ, Wang Y-C, Lee JH, Jang H, Han J. Concentration Polarization and Nonlinear Electrokinetic Flow near a Nanofluidic Channel. Physical Review Letters. 2007;99:044501. doi: 10.1103/PhysRevLett.99.044501. [DOI] [PMC free article] [PubMed] [Google Scholar]


