

Abstract
Abstract
Background
RNA-binding proteins (RBPs) play crucial roles in post-transcriptional control of RNA. RBPs are designed to efficiently recognize specific RNA sequences after it is derived from the DNA sequence. To satisfy diverse functional requirements, RNA binding proteins are composed of multiple blocks of RNA-binding domains (RBDs) presented in various structural arrangements to provide versatile functions. The ability to computationally predict RNA-binding residues in a RNA-binding protein can help biologists reveal important site-directed mutagenesis in wet-lab experiments.
Results
The proposed prediction framework named “ProteRNA” combines a SVM-based classifier with conserved residue discovery by WildSpan to identify the residues that interact with RNA in a RNA-binding protein. Although these conserved residues can be either functionally conserved residues or structurally conserved residues, they provide clues on the important residues in a protein sequence. In the independent testing dataset, ProteRNA has been able to deliver overall accuracy of 89.78%, MCC of 0.2628, F-score of 0.3075, and F0.5-score of 0.3546.
Conclusions
This article presents the design of a sequence-based predictor aiming to identify the RNA-binding residues in a RNA-binding protein by combining machine learning and pattern mining approaches. RNA-binding proteins have diverse functions while interacting with different categories of RNAs because these proteins are composed of multiple copies of RNA-binding domains presented in various structural arrangements to expand the functional repertoire of RNA-binding proteins. Furthermore, predicting RNA-binding residues in a RNA-binding protein can help biologists reveal important site-directed mutagenesis in wet-lab experiments.
Background
RNA-binding proteins (RBPs) are designed to efficiently recognize specific RNA sequences after they are derived from the DNA sequences. Protein-RNA interactions are fundamental to cellular processes, including the assembly and function of ribonucleoprotein particles (RNPs), such as ribosomes and spliceosomes and the post-transcriptional regulation of gene products. For satisfying diverse functional requirements, RNA binding proteins are composed of multiple blocks of RNA-binding domains (RBDs) presented in various structural arrangements to provide versatile functionality [1,2]. Although RNA structure is hierarchical, that is, the primary sequence determines the secondary structure which, in turns, determines tertiary structure, the tertiary structure of RNA is not as stable as secondary structure and is hard to predict [3]. However, sequence conservations in RNA-binding domains have been discovered in RNA-binding proteins [4, 5, 6, 7]. With the recent growth of protein-RNA complexes in the Protein Data Bank (PDB) [8] and the Nucleic Acid Database (NDB) [9], structural analysis on RNA-binding pockets [10, 11, 12, 13, 14, 15, 16, 17, 18] and the themes of RNA-protein recognition [18, 19, 20] have been investigated as well.
Most recent works on predicting RNA-binding residues used support vector machine (SVM) with protein evolutionary information from protein sequence. Wang and Brown (2006) developed the web service, BindN [21], to predict DNA and RNA binding sites using sequence features to represent structural characteristics including relative solvent accessible surface area, side chain pKa, hydrophobicity index and molecular mass of an amino acid. Tong et al. (2008) [22] proposed the hybrid RISP (RNA-Interaction Site Prediction) method by adjusting cutoff value of SVM discrimination function to improve prediction performance. Kumar et al. (2008) developed Pprint [23] by using evolutionary profiles of the position-specific scoring matrices (PSSMs) and amino acid composition while they also adjusted cutoff value of SVM discrimination function to improve prediction performance. Wang et al. (2008) developed PRINTR [24] by using additional structural information from protein-RNA complexes. Cheng et al. (2008) developed RNAProB [25] by smoothing PSSM profiles with consideration of the correlation and dependency from the neighboring residues for each amino acid in a protein. Spriggs et al. (2009) [26] developed the PiRaNhA by using support vector machine with a PSSM profile and three amino acid properties, including interface propensity (IP), predicted solvent accessibility (pA) and hydrophobicity (H) for recognizing RNA-binding residues [27]. Other machine learning approaches such as neural network and Naïve Bayes classifier have also been applied to predict RNA-binding residues. Jeong et al. (2004) [28] applied artificial neural network (ANN)-based method with amino acid sequence and predicted secondary structure information and improved the performance by using post-processing procedures such as state-shifting and filtering isolated interacting residues from prediction. Improved version by Jeong et al. (2006) [29] used evolutionary information extracted from PSI-BLAST profiles and CLUSTALW alignment. Terribilini et al. (2006) [30] applied a Naïve Bayes classifier with amino acid sequence information for predicting RNA interacting residues and presented the results through the web service RNABindR [31]. The ability to computationally predict RNA-binding residues in a RNA-binding protein can help biologists reveal site-directed mutagenesis in wet-lab experiments.
Caragea et al. [32] explored the problem of assessing the performance of classifiers trained on macromolecular sequence data, with the emphasis on cross-validation and data selection methods. In comparison of window-based k-fold cross-validation and sequence-based k-fold cross-validation, window-based cross-validation can yield overly optimistic estimates of the performance of classifier relative to the estimates obtained using sequence-based cross-validation. RNAProB, BindN, RISP, PRINTR and PiRaNhA are predictors that report performance window-based k-fold cross-validation while Pprint and RNABindR report performance with sequence-based k-fold cross-validation. The predictors evaluated with window-based k-fold cross-validation have superior performance than those with sequence-based k-fold cross-validation. The reason is that data instances in the testing fold would be predicted by data instances with sub-sequence identity higher than 25% in the training fold in window-based k-fold cross-validation. Therefore, in data with class imbalance, the metrics that measure the classification performance must be chosen carefully. Matthew's correlation coefficient (MCC), F-score and F0.5-score are widely applied to assess the prediction performance. MCC is used to measure prediction quality with the consideration of both under- and over-predictions. F-score and F0.5-score are used to assess balanced prediction quality on both positive class and negative class.
In this article, we proposed the prediction framework “ProteRNA” with the combination of SVM-based classifier with evolutionary profiles and conserved residues discovery by sequence conservation for identifying RNA-interacting residues in a RNA-binding protein. In the SVM-based classifier, we use features including position-specific scoring matrix computed by PSI-BLAST and secondary structure information predicted by PSIPRED as feature vectors [33]. To exploit the sequence conservation information, WildSpan [34] (http://biominer.bime.ntu.edu.tw/wildspan/), which is developed to discover functional signatures and diagnostic patterns of proteins directly from a set of unaligned protein sequences, is incorporated. The most distinguishing feature of WildSpan is that it links short motifs (local conserved regions) with large flexible gaps to deliver the most frequently observed discontinuous patterns present in related proteins. WildSpan has been embedded in many applications [35, 36, 37, 38, 39] to discover functionally important residues; therefore, we apply WildSpan to discover conserved residues as RNA-binding residues in a protein sequence to improve prediction performance on detecting more RNA-binding residues. The independent testing dataset collected for performance evaluation contains 33 testing RNA-binding proteins with less than 30% sequence identity against with training data. In the independent testing dataset, ProteRNA has been able to deliver overall accuracy of 89.78%, MCC of 0.2628, F-score of 0.3075, and F0.5-score of 0.3546. We emphasize MCC, F-score and F0.5-score because it provides the biochemist with a confidence level for designing an experiment to confirm whether a predicted binding residue is really involved in interaction with the RNA.
Results and discussion
In this section, we will report the experiments conducted to evaluate the performance of our proposed approach, ProteRNA with the combination of SVM-based classifier with evolutionary profiles and conserved residues discovery by sequence conservation. In order to avoid bias, we repeated 5-fold cross-validation procedure 20 times to observe prediction performance on the training dataset RB147 (see Materials and Methods for details). For each run, we applied sequence-based 5-fold cross-validation; therefore, protein chains will be randomly divided into 5 folds: one fold for testing and remaining 4 folds for training. For this study, LIBSVM (http://www.csie.ntu.edu.tw/~cjlin/libsvm) was used for data training and classification and WildSpan was used for detecting conserved residues from homologous protein sequences. We use independent testing dataset containing 33 protein chains for comparing ProteRNA with other predictors such as PiRaNhA, Pprint, BindN, and PRIP.
Performance evaluation by five-fold cross-validation
In order to avoid bias, we repeated 5-fold cross-validation 20 times to observe prediction performance and experimental result was shown in Table 1. Only using SVM-based classifier, ProteRNASVM delivers overall sensitivity of 38.85%, specificity of 97.01%, precision of 75.99%, accuracy of 85.93%, MCC of 0.4732, F-score of 0.5170 and F0.5-score of 0.6343. Since the experiments are repeated 20 times for reducing prediction bias, standard deviation for each assessment is also listed. The results have been obtained using the training parameters, C = 21, γ = 2-5, which give better results than other values for prediction of RNA-binding residues. Then WildSpan only outputs patterns for each input protein chain once so there is no information about standard deviation for each assessment. ProteRNAWildSpan delivers overall sensitivity of 12.28%, specificity of 96.26%, precision of 43.60%, accuracy of 80.27%, MCC of 0.1489, F-score of 0.1916 and F0.5-score of 0.2887. After combining prediction results by ProteRNASVM and ProteRNAWildSpan, ProteRNA delivers overall sensitivity of 44.84%, specificity of 93.56%, precision of 62.10%, accuracy of 84.28%, MCC of 0.4378, F-score of 0.5208 and F0.5-score of 0.5766.
Table 1.
Prediction performance evaluated by the 5-fold cross-validation using the training dataset, RB147
| Predictors | Sensitivity | Specificity | Precision | Accuracy | MCC | F-score | F0.5-score |
|---|---|---|---|---|---|---|---|
| ProteRNASVM | 38.85% ± 0.46% | 97.01% ± 0.09% | 75.99% ± 0.48% | 85.93% ± 0.08% | 0.4732 ± 0.0036 | 0.5170 ± 0.0040 | 0.6343 ± 0.0034 |
| ProteRNAWildSpan | 12.28% | 96.26% | 43.60% | 80.27% | 0.1489 | 0.1916 | 0.2887 |
| ProteRNA | 44.84% ± 0.37% | 93.56% ± 0.09% | 62.10% ± 0.25% | 84.28% ± 0.06% | 0.4378 ± 0.0027 | 0.5208 ± 0.0027 | 0.5766 ± 0.0022 |
As reported by Towfic et al. [40], over half (55.7%) of the RNAs are rRNAs in the dataset of RB147. According to their study, Table 2 shows the distribution of different categories of RNAs on RNA-binding residues. rRNA is the major group that contains about 38% positive samples in rRNA group. Remaining groups presents highly imbalanced class dataset, containing about 10% positive sample in average. If the predictor tries to predict all samples as negative class exclusive of rRNA group, the predictor may gain better performance in assessment but provide no clues for biologists. Table 1 describes the average prediction performance of 20 runs of 5-fold cross-validation; however, we only choose one of the repeated experiments that had a performance that is close to the average performance for detailed analysis in Table 3. As shown in Table 3 ProteRNAWildSpan predicts an equal amount of true positives and false positives on average. Previous research on studying RNA-binding domains revealed that RNA binding proteins are composed of multiple blocks of RNA-binding domains to provide versatile functionality. Therefore, conserved residues in the same RNA-binding domain from different RNA-binding proteins would not always interact with a specific RNA. Furthermore, while combining prediction results predicted by ProteRNASVM and ProteRNAWildSpan, ProteRNAWildSpan detected additional RNA-binding residues that ProteRNASVM didn’t predict.
Table 2.
Statistical information of the training dataset, RB147 in terms of RNA-binding residues
| Number of RNA-binding residues | Total number of residues | Ratio of RNA-binding residues | |
|---|---|---|---|
| rRNA | 3916 | 10267 | 38.14% |
| mRNA | 256 | 1878 | 13.63% |
| tRNA | 1230 | 12401 | 9.92% |
| others | 755 | 7778 | 9.71% |
| Total | 6157 | 32324 | 19.05% |
Table 3.
Prediction performance breakdown in terms of the categories of RNA using the training dataset, RB147
| Predictor | RNA | TP | FP | TN | FN | Sensitivity | Specificity | Precision | Accuracy | MCC | F-score | F0.5-score |
|---|---|---|---|---|---|---|---|---|---|---|---|---|
| ProteRNASVM | rRNA | 2060 | 537 | 5814 | 1856 | 52.60% | 91.54% | 79.32% | 76.69% | 0.4933 | 0.6326 | 0.7201 |
| mRNA | 27 | 16 | 1606 | 229 | 10.55% | 99.01% | 62.79% | 86.95% | 0.2193 | 0.1806 | 0.3154 | |
| tRNA | 234 | 171 | 11000 | 996 | 19.02% | 98.47% | 57.78% | 90.59% | 0.2942 | 0.2862 | 0.4105 | |
| others | 109 | 93 | 6930 | 646 | 14.44% | 98.68% | 53.96% | 90.50% | 0.2441 | 0.2278 | 0.3487 | |
| Total | 2430 | 823 | 25344 | 3727 | 39.47% | 96.86% | 74.70% | 85.92% | 0.4741 | 0.5165 | 0.6338 | |
| ProteRNAWildSpan | rRNA | 554 | 412 | 5939 | 3362 | 14.15% | 93.51% | 57.35% | 63.24% | 0.1274 | 0.2270 | 0.3560 |
| mRNA | 67 | 121 | 1501 | 189 | 26.17% | 92.54% | 35.64% | 83.49% | 0.2139 | 0.3018 | 0.3323 | |
| tRNA | 50 | 173 | 10998 | 1180 | 4.07% | 98.45% | 22.42% | 89.09% | 0.0566 | 0.0688 | 0.1178 | |
| others | 85 | 272 | 6751 | 670 | 11.26% | 96.13% | 23.81% | 87.89% | 0.1045 | 0.1529 | 0.1947 | |
| Total | 756 | 978 | 25189 | 5401 | 12.28% | 96.26% | 43.60% | 80.27% | 0.1489 | 0.1916 | 0.2887 | |
| ProteRNA | rRNA | 2256 | 878 | 5473 | 1660 | 57.61% | 86.18% | 71.98% | 75.28% | 0.4618 | 0.6400 | 0.6856 |
| mRNA | 89 | 138 | 1484 | 167 | 34.77% | 91.49% | 39.21% | 83.76% | 0.2764 | 0.3685 | 0.3823 | |
| tRNA | 238 | 304 | 10867 | 992 | 19.35% | 97.28% | 43.91% | 89.55% | 0.2431 | 0.2686 | 0.3502 | |
| others | 177 | 366 | 6657 | 578 | 23.44% | 94.79% | 32.60% | 87.86% | 0.2118 | 0.2727 | 0.3024 | |
| Total | 2760 | 1686 | 24481 | 3397 | 44.83% | 93.56% | 62.08% | 84.28% | 0.4376 | 0.5206 | 0.5764 | |
As we known, rRNA is the major group among the training dataset. Comparing the amount of RNA-binding proteins in terms of interacting target (e.g. rRNA, tRNA, mRNA), we find that tRNA generally has the most interaction partners followed by mRNA and rRNA has the least partners. ProteRNASVM tends to predict negative for proteins in the mRNA group and over-predict either positive class or negative class in tRNA group. However, ProteRNAWildSpan shows no different between categories of RNAs because of discovered homologous proteins in Swiss-Prot. In addition, ProteRNAWildSpan detects conserved residues as binding residues that cover regions that ProteRNASVM doesn’t predict; therefore, we apply WildSpan to detect conserved residues because these conserved residues have higher probability to play roles in interacting RNAs.
Comparison with other predictors by independent testing
Only predictors that predict RNA-binding residues from protein primary sequence information were selected for performance comparison. In addition, RISP did not respond with any prediction results after submitting the jobs and PRINTR is unavailable. According to the designed framework of RNABindR, if there is an exact matched protein chain in Protein Data Bank, RNABindR will return the actual RNA-binding residues of protein-RNA complex. Therefore, it is difficult to distinguish whether the returned result is actually binding or predicted binding so RNABindR will be excluded. Finally, Table 4 shows the prediction performance of ProteRNA in comparison with PiRaNhA, Pprint, BindN, and PRIP. While ordering prediction performance in terms of MCC, ProteRNA delivers better performance than other predictors in accuracy, MCC, and F0.5-score.
Table 4.
Comparison of ProteRNA with other predictors using the independent testing dataset, RB33
| Predictor* | TP | FP | TN | FN | Sensitivity | Specificity | Precision | Accuracy | MCC | F-score | F0.5-score |
| ProteRNA | 222 | 340 | 8563 | 660 | 25.17% | 96.18% | 39.50% | 89.78% | 0.2628 | 0.3075 | 0.3546 |
| PiRaNhA | 265 | 538 | 8365 | 617 | 30.05% | 93.96% | 33.00% | 88.20% | 0.2504 | 0.3145 | 0.3236 |
| Pprint | 447 | 1782 | 7121 | 435 | 50.68% | 79.98% | 20.05% | 77.34% | 0.2094 | 0.2873 | 0.2281 |
| BindN | 348 | 1613 | 7290 | 534 | 39.46% | 81.88% | 17.75% | 78.06% | 0.1527 | 0.2449 | 0.1994 |
| PRIP | 131 | 835 | 8068 | 751 | 14.85% | 90.62% | 13.56% | 83.79% | 0.0526 | 0.1418 | 0.1380 |
*Order by MCC.
Table 5 shows the Top-10 predictions by different predictors ordered by the MCC and precision among 33 independent testing samples. In terms of MCC, we can find that at least 4 predictors have predictions in 6 protein chains of Top-10 ranking. In terms of precision, we can find that at least 4 predictors have predictions in 7 protein chains of Top-10 ranking. Figure 1 (a) and (b) show the predicted RNA-binding residues in the case of E. coli SelB protein with PDB ID 2PJPA [41] by ProteRNA and PiRaNhA respectively. In this case, because WildSpan does not mine any patterns for 2PJPA, only ProteRNASVM gives prediction result. Figure 2 (a) and (b) show the predicted RNA-binding residues in the case of RluA [42]. In this case, ProteRNA outperforms than other predictors in terms of MCC. BindN and Pprint tend to predict more and more class label for each residue; therefore, they recommend more and more false positives and false negatives. Meanwhile, PRIP and PiRaNhA have similar performance in predicting RNA-binding residues in the case of 2I82C. These figures are rendered by PyMOL (http://www.pymol.org/).
Table 5.
Comparison of the top 10 ranking predictions with results from other predictors
| Rank | ProteRNA | PiRaNhA | Pprint | BindN | PRIP |
|---|---|---|---|---|---|
| (a) Rank by MCC | |||||
| 1 | 2PJP_A | 2QAM_Z | 2QAM_Z | 2QAM_Z | 2PY9_C |
| 2 | 2QAM_Z | 2QBE_T | 1VS8_O | 2PY9_C | 2QAM_Z |
| 3 | 2PY9_C | 2DER_B | 2PJP_A | 1VS8_O | 2HYI_D |
| 4 | 1VS8_O | 2G4B_A | 2PY9_C | 2QBE_T | 2NQP_B |
| 5 | 2G4B_A | 1VS8_O | 2GYA_3 | 2G4B_A | 2IY5_A |
| 6 | 2Q66_A | 2PY9_C | 2DER_B | 2DER_B | 1VS8_O |
| 7 | 2I82_C | 2G8K_A | 2G4B_A | 2J0Q_A | 2I82_C |
| 8 | 2DER_B | 2OZB_B | 2QBE_T | 2IPY_B | 2V47_C |
| 9 | 2QBE_T | 2V47_C | 2DR2_A | 2HVR_A | 2GJE_A |
| 10 | 2DR2_A | 2GJE_D | 2QKK_F | 2GTT_G | 2JEA_B |
| MCC of Rank 1 | 0.6668 | 0.6415 | 0.6006 | 0.4364 | 0.5521 |
| MCC of Rank 10 | 0.3063 | 0.2719 | 0.2390 | 0.1951 | 0.0517 |
| (b) Rank by precision | |||||
| 1 | 2Q66_A | 2GYA_3 | 2GYA_3 | 2QAM_Z | 2QAM_Z |
| 2 | 2PJP_A | 2QBE_T | 2QAM_Z | 2QBE_T | 2PY9_C |
| 3 | 2PY9_C | 2QAM_Z | 2QBE_T | 1VS8_O | 1VS8_O |
| 4 | 2QAM_Z | 1VS8_O | 1VS8_O | 2PY9_C | 2QBE_T |
| 5 | 2DER_B | 2OZB_B | 2PY9_C | 2GYA_3 | 2I82_C |
| 6 | 1VS8_O | 2PY9_C | 2DER_B | 2G4B_A | 2V47_C |
| 7 | 2GYA_3 | 2DER_B | 2V47_C | 2J0Q_A | 2IY5_A |
| 8 | 2I82_C | 2V47_C | 2I82_C | 2I82_C | 2GYA_3 |
| 9 | 2QBE_T | 2G4B_A | 2G4B_A | 2DER_B | 2G4B_A |
| 10 | 2G8K_A | 2Q66_A | 2GJE_A | 2V47_C | 2GJE_A |
| Precision of Rank 1 | 100.00% | 100.00% | 76.92% | 76.47% | 75.00% |
| Precision of Rank 10 | 50.00% | 35.71% | 25.00% | 24.00% | 13.33% |
Values in bold indicate listing in the top 10 by at least 5 predictors.
Values in bold and italics indicate listing in the top 10 by at least 4 predictors.
Figure 1.

Case study on E. coli SelB (PDBID 2PJPA) Residues colored by green, red, and blue represent true positive, false positive and false negative, respectively. (a) Predicted RNA-binding residues by ProteRNA. (b) Predicted RNA-binding residues by PiRaNhA.
Figure 2.

Case study on RluA (PDBID 2I82C) Residues colored by green, red, and blue represent true positive, false positive and false negative, respectively. (a) Predicted RNA-binding residues by ProteRNA. (b) Predicted RNA-binding residues by PiRaNhA.
Conclusions
This article presents the design of a sequence based predictor aiming to identify the RNA-binding residues in a RNA-binding protein by machine learning and pattern mining approaches. RNA-binding proteins play different roles while interacting with different categories of RNAs to represent diverse functions. However, RNA-binding proteins are accommodated by the presence of multiple copies of these RNA-binding domains presented in various structural arrangements to expand the functional repertoire of RNA-binding proteins. Therefore, it is still difficult to predict RNA-binding residues in a RNA-binding protein. Furthermore, predicting RNA-binding residues in a RNA-binding protein can help biologists reveal site-directed mutagenesis in wet-lab experiments.
In the experiments reported in this article, ProteRNA used not only evolutionary profile with predicted secondary structure but also sequence conservation information. Although these conserved residues can be functional conserved residues or structural conserved residues, they also provide clues to indicate the important residues in a protein sequence. In the independent testing dataset, ProteRNA has been able to deliver overall accuracy of 89.78%, MCC of 0.2628, F-score of 0.3075, and F0.5-score of 0.3546. It is anticipated that the prediction accuracy delivered by ProteRNA will continue to improve as the number of protein-RNA complexes deposited in the PDB continues to grow and the number of training samples that can be exploited continues to increase accordingly. Nevertheless, it is the computational biologists’ primary interest to develop more advanced prediction mechanisms. In this respect, we believe that, as the number of protein-RNA complexes deposited in the PDB increases, we can obtain more insights about the key physiochemical properties that play essential roles in protein-RNA interactions and then we will be able to develop more advanced prediction mechanisms accordingly. In addition, we will exploit the experiences learned in this study in order to design specific predictors for other families of proteins interacting with RNA. We believe that different families of proteins may have very different characteristics. Therefore, concerning a specific type of proteins, a specifically-designed predictor should be able to deliver superior performance in compared to a general-purpose predictor.
Materials and methods
Datasets
We used RB147 as the training dataset for predicting RNA-binding residues in a protein collected by Terribilini et al., containing 147 non-redundant protein chains with resolution better than 3.5 Å in the PDB solved by X-ray crystallography [31,40]. No two protein chains has a sequence identity greater than 30%. Based on the cut-off distance of 5 Å, a total of 32,324 amino acids are in RB147, which contains 6,157 RNA-binding residues and 26,167 non-binding residues. The list of PDB ids of the training dataset, RB147, is shown in Table 6(a).
Table 6.
Datasets for ProteRNA
| (a) Training dataset - RB147 | |||||||
|---|---|---|---|---|---|---|---|
| 1A34_A | 1A9N_A | 1APG_A | 1ASY_A | 1AV6_A | 1B23_P | 1B2M_A | 1C0A_A |
| 1DDL_A | 1DFU_P | 1DI2_A | 1E8O_A | 1EC6_A | 1EIY_B | 1F7U_A | 1FEU_A |
| 1FFY_A | 1FJG_B | 1FJG_C | 1FJG_D | 1FJG_E | 1FJG_G | 1FJG_I | 1FJG_J |
| 1FJG_K | 1FJG_L | 1FJG_M | 1FJG_N | 1FJG_P | 1FJG_Q | 1FJG_S | 1FJG_T |
| 1FJG_V | 1G1X_A | 1G1X_B | 1G1X_C | 1G2E_A | 1GTF_Q | 1H2C_A | 1H3E_A |
| 1H4S_A | 1HQ1_A | 1HRO_W | 1I6U_A | 1J1U_A | 1J2B_A | 1JBR_A | 1JID_A |
| 1K8W_A | 1KNZ_A | 1KQ2_A | 1LAJ_A | 1LNG_A | 1M5O_C | 1M8V_A | 1M8X_A |
| 1MZP_A | 1N35_A | 1N78_A | 1NB7_A | 1OOA_A | 1PGL_2 | 1Q2S_A | 1QF6_A |
| 1QTQ_A | 1R3E_A | 1RMV_A | 1RPU_A | 1SDS_A | 1SER_A | 1SI3_A | 1T0K_B |
| 1TFW_A | 1U0B_B | 1UN6_B | 1UVJ_A | 1VFG_A | 1VQO_1 | 1VQO_2 | 1VQO_3 |
| 1VQO_A | 1VQO_B | 1VQO_C | 1VQO_D | 1VQO_E | 1VQO_G | 1VQO_H | 1VQO_I |
| 1VQO_J | 1VQO_K | 1VQO_L | 1VQO_M | 1VQO_N | 1VQO_P | 1VQO_Q | 1VQO_R |
| 1VQO_S | 1VQO_T | 1VQO_U | 1VQO_V | 1VQO_W | 1VQO_X | 1VQO_Y | 1VQO_Z |
| 1W2B_5 | 1WNE_A | 1WPU_A | 1WSU_A | 1WZ2_A | 1Y69_8 | 1Y69_K | 1Y69_U |
| 1YVP_A | 1YZ9_A | 1ZH5_A | 2A1R_A | 2A8V_A | 2ASB_A | 2AVY_F | 2AVY_U |
| 2AW4_0 | 2AW4_1 | 2AW4_2 | 2AW4_3 | 2AW4_D | 2AW4_E | 2AW4_G | 2AW4_H |
| 2AW4_J | 2AW4_L | 2AW4_N | 2AW4_P | 2AW4_Q | 2AW4_R | 2AW4_S | 2AW4_Y |
| 2AW4_Z | 2AZ0_A | 2BGG_A | 2BH2_A | 2BTE_A | 2BU1_A | 2BX2_L | 2CT8_A |
| 2D3O_1 | 2D3O_S | 2FMT_A | |||||
| (b) Independent Testing Dataset - RB33 | |||||||
| 1VS8_O | 2D6F_D | 2DB3_C | 2DER_B | 2DR2_A | 2DU3_A | 2F8S_A | 2FK6_A |
| 2G4B_A | 2G8K_A | 2GJE_A | 2GJE_D | 2GJW_C | 2GTT_G | 2GYA_3 | 2HVR_A |
| 2HYI_D | 2I82_C | 2IPY_B | 2IX1_A | 2IY5_A | 2J0Q_A | 2JEA_A | 2JEA_B |
| 2NQP_B | 2OZB_B | 2PJP_A | 2PY9_C | 2Q66_A | 2QAM_Z | 2QBE_T | 2QKK_F |
| 2V47_C | |||||||
In order to evaluate prediction performance among different prediction models, we collected a new independent testing dataset by extracting all structures of Protein-RNA complexes from the PDB that were added after January 2006. Protein chains with a resolution better than 3.5 Å and sequence length of protein chain longer than 40 amino acids will be reserved. We then performed a redundancy reduction using BLASTclust [2] to ensure that none of the chains showed a sequence similarity of more than 30% within the dataset and also in the training dataset; therefore, 33 protein-RNA complexes were selected to create a dataset called RB33. The list of PDB ids in RB33 are shown in Table 6(b). Based on the cut-off distance of 5 Å, a total of 9,785 amino acids are in RB33, which contains 882 RNA-binding residues and 8,903 non-binding residues.
Framework for prediction RNA-interacting residues
Figure 3 presents the overall framework for predicting RNA-binding residues. In the overall framework, we combined SVM-based classifier and sequence conservation discovery by WildSpan to predict RNA-binding residues. For the SVM-based classifier (ProteRNASVM), we have employed the LIBSVM package with the Gaussian kernel (software available at http://www.csie.ntu.edu.tw/~cjlin/libsvm). The model of the SVM has been generated based on the training data set derived by associating each residue in the training protein chains with the evolutionary profiles of the residue and its 22 neighboring residues (window size = 23) [43,44]. The evolutionary profile of a residue is in fact the vector corresponding to the residue in the position specific scoring matrix (PSSM) computed by the PSI-BLAST package [45] with three iterations (blastpgp -j 3) against with NCBI non-redundant reference sequence database (ftp://ftp.ncbi.nih.gov/blast/db/). The normalization function for PSSM features is defined as follow:
Figure 3.

The overall framework of ProteRNA for predicting RNA-binding residues
where x is the entry value in 20xN matrix of PSSM (N is sequence length of a protein). With the consideration of structure information, we also used secondary structure information predicted by PSIPRED; the predicted secondary structure information consists of three probability values that represent helix, sheet and coil respectively (e.g. (H, E, C) = (0.75, 0.25, 0.25)). In addition, each residue was labelled based on whether it is involved in binding with the RNA or not. Therefore, for each residue in a protein sequence, we construct a 23 * 24 = 552 dimensional feature factor (window size = 23, feature size = 24); the 24 dimensions include 20 features from PSSM, 3 features from PSIPRED and a boundary flag. As shown in Figure 4, the detail data flow and feature vector preparation for SVM-based classifier is addressed. The best parameters selected for predicting RNA-binding residues is decided by 5-fold cross-validation.
Figure 4.
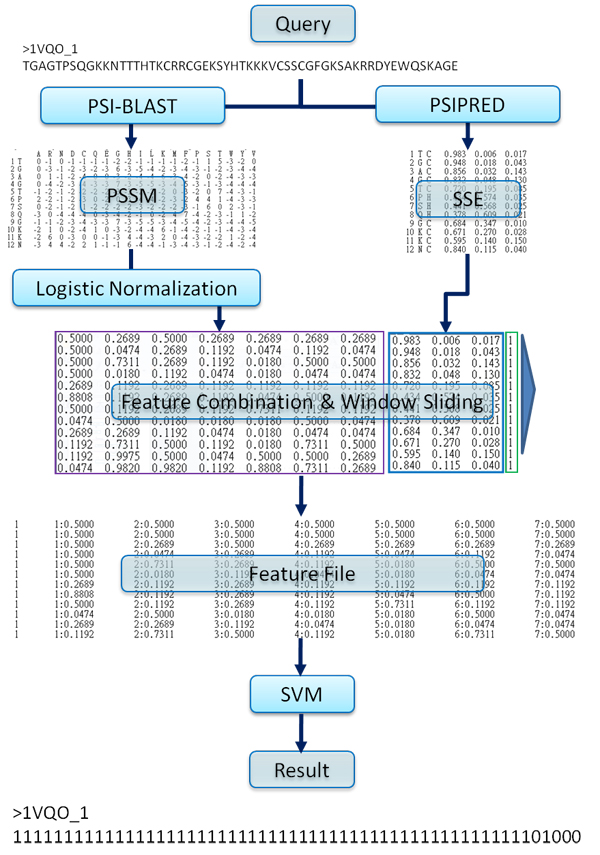
An outline of RNA-binding residue prediction by the SVM-based classifier.
In the part of WildSpan (ProteRNAWildSpan), for protein-based mining suggested by the authors, at most 150 unique homologous proteins with sequence identity ranged from 30% to 90% are required by searching against Swiss-Prot sequence database with PSI-BLAST (blastpgp –j 6). Then we applied default parameter to obtain patterns by WildSpan. WildSpan can’t generate any pattern if there are not enough homologous proteins selected from Swiss-Prot protein sequence database or too similar homologous proteins.
Significance and performance evaluation
The predictions made for the testing instances are compared with the defined class labels (binding or non-binding) to evaluate the predictor. The accuracy is defined as
where TP is the number of true positives (binding residues with positive predictions); TN is the number of true negatives (non-binding residues with negative predictions); FP is the number of false positives (non-binding residues but predicted as binding residues) and FN is the number of false negatives (binding residues but predicted as non-binding residues). Matthew's correlation coefficient (MCC) is defined as follows:
MCC is used to measure prediction performance with the consideration of both under- and over-predictions, where MCC = 1 denotes a perfect prediction, MCC = 0 indicates a completely random assignment, and MCC = -1 means a perfectly reverse correlation.
Since the data for RNA-binding residue prediction is skewed, so-called class imbalanced data, the accuracy alone may be misleading. The predictor can achieve 85% accuracy by simply predicting all residues as negative for datasets where the positive to negative sample ratio is 1:10. Therefore, prediction performance on positive class and negative class should be assessed individually. Metrics of the specificity and sensitivity can help predictors to know their prediction performance on positive and negative samples respectively. The sensitivity is used to measure the prediction capability of positive samples; the specificity is used to measure the prediction capability of negative samples. Specificity and sensitivity are defined as follows:
In addition, precision and Fβ-score are also defined as follows:
Precision is used to assess prediction power on positive class. F-score (F1-score) is the harmonic mean of precision and Sensitivity if β = 1. F0.5-score weights precision twice as much as sensitivity if β = 0.5.
List of abbreviations
RBP: RNA-binding protein, RBD: RNA-binding domain; RNP: Ribonucleoprotein particle; PSSM: Position-specific scoring matrix; NDB: Nucleic Acid Database; PDB: Protein Data Bank; SVM: Support vector machine.
Competing interests
The authors declare that they have no competing interests.
Authors' contributions
YFH and LYC developed and implemented the overall framework and drafted the manuscript; CCH provided valuable suggestion on experiments based on his previous works on predicting DNA-binding residues. CKH conceived of the study and participated in its design and coordination and helped to draft this manuscript. All authors have read and approved the final manuscript.
Contributor Information
Yu-Feng Huang, Email: yfhuang@csie.ntu.edu.tw.
Li-Yuan Chiu, Email: r97525034@ntu.edu.tw.
Chun-Chin Huang, Email: d98922043@ntu.edu.tw.
Chien-Kang Huang, Email: ckhuang@ntu.edu.tw.
Acknowledgements
This research has been supported by the National Science Council and National Taiwan University. Funding for article processing charges: National Science Council, NSC 98-2627-B-002-018.
This article has been published as part of BMC Genomics Volume 11 Supplement 4, 2010: Ninth International Conference on Bioinformatics (InCoB2010): Computational Biology. The full contents of the supplement are available online at http://www.biomedcentral.com/1471-2164/11?issue=S4.
References
- Lunde BM, Moore C, Varani G. RNA-binding proteins: modular design for efficient function. Nat Rev Mol Cell Biol. 2007;8(6):479–490. doi: 10.1038/nrm2178. [DOI] [PMC free article] [PubMed] [Google Scholar]
- Burd CG, Dreyfuss G. Conserved structures and diversity of functions of RNA-binding proteins. Science. 1994;265(5172):615–621. doi: 10.1126/science.8036511. [DOI] [PubMed] [Google Scholar]
- Tinoco I, Bustamante C. How RNA folds. Journal of molecular biology. 1999;293(2):271–281. doi: 10.1006/jmbi.1999.3001. [DOI] [PubMed] [Google Scholar]
- Yan KS, Yan S, Farooq A, Han A, Zeng L, Zhou MM. Structure and conserved RNA binding of the PAZ domain. Nature. 2003;426(6965):468–474. doi: 10.1038/nature02129. [DOI] [PubMed] [Google Scholar]
- Soulard M, Della Valle V, Siomi MC, Pinol-Roma S, Codogno P, Bauvy C, Bellini M, Lacroix JC, Monod G, Dreyfuss G. et al. hnRNP G: sequence and characterization of a glycosylated RNA-binding protein. Nucleic Acids Res. 1993;21(18):4210–4217. doi: 10.1093/nar/21.18.4210. [DOI] [PMC free article] [PubMed] [Google Scholar]
- Swanson MS, Nakagawa TY, LeVan K, Dreyfuss G. Primary structure of human nuclear ribonucleoprotein particle C proteins: conservation of sequence and domain structures in heterogeneous nu-clear RNA, mRNA, and pre-rRNA-binding proteins. Mol Cell Biol. 1987;7(5):1731–1739. doi: 10.1128/mcb.7.5.1731. [DOI] [PMC free article] [PubMed] [Google Scholar]
- Zahler AM, Lane WS, Stolk JA, Roth MB. SR proteins: a conserved family of pre-mRNA splicing factors. Genes Dev. 1992;6(5):837–847. doi: 10.1101/gad.6.5.837. [DOI] [PubMed] [Google Scholar]
- Berman HM, Battistuz T, Bhat TN, Bluhm WF, Bourne PE, Burkhardt K, Feng Z, Gilliland GL, Iype L, Jain S. et al. The Protein Data Bank. Acta Crystallogr D Biol Crystallogr. 2002;58(Pt6No1):899–907. doi: 10.1107/s0907444902003451. [DOI] [PubMed] [Google Scholar]
- Berman HM, Olson WK, Beveridge DL, Westbrook J, Gelbin A, Demeny T, Hsieh SH, Srinivasan AR, Schneider B. The nucleic acid database. A comprehensive relational database of three-dimensional structures of nucleic acids. Biophys J. 1992;63(3):751–759. doi: 10.1016/S0006-3495(92)81649-1. [DOI] [PMC free article] [PubMed] [Google Scholar]
- Bahadur RP, Zacharias M, Janin J. Dissecting protein-RNA recognition sites. Nucleic Acids Res. 2008;36(8):2705–2716. doi: 10.1093/nar/gkn102. [DOI] [PMC free article] [PubMed] [Google Scholar]
- Allers J, Shamoo Y. Structure-based analysis of protein-RNA interactions using the program ENTANGLE. J Mol Biol. 2001;311(1):75–86. doi: 10.1006/jmbi.2001.4857. [DOI] [PubMed] [Google Scholar]
- Jones S, Daley DT, Luscombe NM, Berman HM, Thornton JM. Protein-RNA interactions: a structural analysis. Nucleic Acids Res. 2001;29(4):943–954. doi: 10.1093/nar/29.4.943. [DOI] [PMC free article] [PubMed] [Google Scholar]
- Treger M, Westhof E. Statistical analysis of atomic contacts at RNA-protein interfaces. J Mol Recognit. 2001;14(4):199–214. doi: 10.1002/jmr.534. [DOI] [PubMed] [Google Scholar]
- Morozova N, Allers J, Myers J, Shamoo Y. Protein-RNA interactions: exploring binding patterns with a three-dimensional superposition analysis of high resolution structures. Bioinformatics. 2006;22(22):2746–2752. doi: 10.1093/bioinformatics/btl470. [DOI] [PubMed] [Google Scholar]
- Ellis JJ, Broom M, Jones S. Protein-RNA interactions: structural analysis and functional classes. Proteins. 2007;66(4):903–911. doi: 10.1002/prot.21211. [DOI] [PubMed] [Google Scholar]
- Kim H, Jeong E, Lee SW, Han K. Computational analysis of hydrogen bonds in protein-RNA complexes for interaction patterns. FEBS Lett. 2003;552(2-3):231–239. doi: 10.1016/s0014-5793(03)00930-x. [DOI] [PubMed] [Google Scholar]
- Towfic F, Caragea C, Dobbs D, Gemperline DC, Feihong W, Honavar V. Structural characterization of RNA-binding sites of proteins: Preliminary results. Bioinformatics and Biomedicine Workshops, 2007 BIBMW 2007 IEEE International Conference on: 2-4 Nov. 2007. 2007. pp. 60–66. 2007.
- Zhou P, Zou J, Tian F, Shang Z. Geometric similarity between protein-RNA interfaces. Journal of Computational Chemistry. 2009;30(16):2738–2751. doi: 10.1002/jcc.21300. [DOI] [PubMed] [Google Scholar]
- Draper DE. Themes in RNA-protein recognition. J Mol Biol. 1999;293(2):255–270. doi: 10.1006/jmbi.1999.2991. [DOI] [PubMed] [Google Scholar]
- Draper DE. Protein-RNA Recognition. Annual Review of Biochemistry. 1995;64(1):593–620. doi: 10.1146/annurev.bi.64.070195.003113. [DOI] [PubMed] [Google Scholar]
- Wang L, Brown S. BindN: a web-based tool for efficient prediction of DNA and RNA binding sites in amino acid sequences. Nucleic acids research. 2006;34(WebServerissue):W243. doi: 10.1093/nar/gkl298. [DOI] [PMC free article] [PubMed] [Google Scholar]
- Tong J, Jiang P, Lu ZH. RISP: a web-based server for prediction of RNA-binding sites in proteins. Comput Methods Programs Biomed. 2008;90(2):148–153. doi: 10.1016/j.cmpb.2007.12.003. [DOI] [PubMed] [Google Scholar]
- Kumar M, Gromiha MM, Raghava GP. Prediction of RNA binding sites in a protein using SVM and PSSM profile. Proteins. 2008;71(1):189–194. doi: 10.1002/prot.21677. [DOI] [PubMed] [Google Scholar]
- Wang Y, Xue Z, Shen G, Xu J. PRINTR: prediction of RNA binding sites in proteins using SVM and profiles. Amino Acids. 2008;35(2):295–302. doi: 10.1007/s00726-007-0634-9. [DOI] [PubMed] [Google Scholar]
- Cheng CW, Su EC, Hwang JK, Sung TY, Hsu WL. Predicting RNA-binding sites of proteins using support vector machines and evolutionary information. BMC Bioinformatics. 2008;9(Suppl12):S6. doi: 10.1186/1471-2105-9-S12-S6. [DOI] [PMC free article] [PubMed] [Google Scholar]
- Spriggs RV, Murakami Y, Nakamura H, Jones S. Protein function annotation from sequence: prediction of residues interacting with RNA. Bioinformatics. 2009;25(12):1492–1497. doi: 10.1093/bioinformatics/btp257. [DOI] [PubMed] [Google Scholar]
- Spriggs RV, Jones S. RNA-binding residues in sequence space: Conservation and interaction patterns. Computational Biology and Chemistry. 2009;33(5):397–403. doi: 10.1016/j.compbiolchem.2009.07.012. [DOI] [PubMed] [Google Scholar]
- Jeong E, Chung IF, Miyano S. A neural network method for identification of RNA-interacting residues in protein. Genome Inform. 2004;15(1):105–116. [PubMed] [Google Scholar]
- Jeong E, Miyano S. A weighted profile based method for protein-RNA interacting residue prediction. Lecture notes in computer science. 2006;3939:123. [Google Scholar]
- Terribilini M, Lee J, Yan C, Jernigan R, Honavar V, Dobbs D. Prediction of RNA binding sites in proteins from amino acid sequence. Rna. 2006;12(8):1450. doi: 10.1261/rna.2197306. [DOI] [PMC free article] [PubMed] [Google Scholar]
- Terribilini M, Sander JD, Lee JH, Zaback P, Jernigan RL, Honavar V, Dobbs D. RNABindR: a server for analyzing and predicting RNA-binding sites in proteins. Nucleic Acids Res. 2007;35(WebServerissue):W578–584. doi: 10.1093/nar/gkm294. [DOI] [PMC free article] [PubMed] [Google Scholar]
- Caragea C, Sinapov J, Honavar V, Dobbs D. Assessing the Performance of Macromolecular Sequence Classifiers. Bioinformatics and Bioengineering, 2007 BIBE 2007 Proceedings of the 7th IEEE International Conference on: 2007. 2007. pp. 320–326.
- McGuffin LJ, Bryson K, Jones DT. The PSIPRED protein structure prediction server. Bioinformatics. 2000;16(4):404–405. doi: 10.1093/bioinformatics/16.4.404. [DOI] [PubMed] [Google Scholar]
- Hsu C-M, Chen C-Y, Hsu C-C, Liu B-J. Efficient Discovery of Structural Motifs from Protein Sequences with Combination of Flexible Intra- and Inter-block Gap Constraints. 2006. pp. 530–539.
- Chen CY, Tsai HK, Hsu CM, May Chen MJ, Hung HG, Huang GT, Li WH. Discovering gapped binding sites of yeast transcription factors. Proc Natl Acad Sci U S A. 2008;105(7):2527–2532. doi: 10.1073/pnas.0712188105. [DOI] [PMC free article] [PubMed] [Google Scholar]
- Hsu CM, Chen CY, Liu BJ. MAGIIC-PRO: detecting functional signatures by efficient discovery of long patterns in protein sequences. Nucleic Acids Res. 2006;34(WebServerissue):W356–361. doi: 10.1093/nar/gkl309. [DOI] [PMC free article] [PubMed] [Google Scholar]
- Su CT, Chen CY, Hsu CM. iPDA: integrated protein disorder analyzer. Nucleic Acids Res. 2007;35(WebServerissue):W465–472. doi: 10.1093/nar/gkm353. [DOI] [PMC free article] [PubMed] [Google Scholar]
- Chien TY, Chang DT, Chen CY, Weng YZ, Hsu CM. E1DS: catalytic site prediction based on 1D signatures of concurrent conservation. Nucleic Acids Res. 2008;36(WebServerissue):W291–296. doi: 10.1093/nar/gkn324. [DOI] [PMC free article] [PubMed] [Google Scholar]
- Hsu CM, Chen CY, Liu BJ, Huang CC, Laio MH, Lin CC, Wu TL. Identification of hot regions in protein-protein interactions by sequential pattern mining. BMC Bioinformatics. 2007;8(Suppl5):S8. doi: 10.1186/1471-2105-8-S5-S8. [DOI] [PMC free article] [PubMed] [Google Scholar]
- Towfic F, Caragea C, Gemperline D, Dobbs D, Honavar V. Struct-NB: Predicting Protein-RNA Binding Sites Using Structural Features. International Journal of Data Mining and Bioinformatics. 2008. [DOI] [PMC free article] [PubMed]
- Soler N, Fourmy D, Yoshizawa S. Structural insight into a molecular switch in tandem winged-helix motifs from elongation factor SelB. J Mol Biol. 2007;370(4):728–741. doi: 10.1016/j.jmb.2007.05.001. [DOI] [PubMed] [Google Scholar]
- Hoang C, Chen J, Vizthum A Caroline, Kandel JM, Hamilton S Christopher, Mueller EG, Ferré-D'Amaré AR. Crystal Structure of Pseudouridine Synthase RluA: Indirect Sequence Readout through Protein-Induced RNA Structure. 2006. pp. 535–545. [DOI] [PubMed]
- Larranaga P, Calvo B, Santana R, Bielza C, Galdiano J, Inza I, Lozano JA, Armananzas R, Santafe G, Perez A. et al. Machine learning in bioinformatics. Brief Bioinform. 2006;7(1):86–112. doi: 10.1093/bib/bbk007. [DOI] [PubMed] [Google Scholar]
- Bhaskar H, Hoyle DC, Singh S. Machine learning in bioinformatics: a brief survey and recommendations for practitioners. Comput Biol Med. 2006;36(10):1104–1125. doi: 10.1016/j.compbiomed.2005.09.002. [DOI] [PubMed] [Google Scholar]
- Altschul SF, Madden TL, Schaffer AA, Zhang J, Zhang Z, Miller W, Lipman DJ. Gapped BLAST and PSI-BLAST: a new generation of protein database search programs. Nucleic Acids Res. 1997;25(17):3389–3402. doi: 10.1093/nar/25.17.3389. [DOI] [PMC free article] [PubMed] [Google Scholar]