

Abstract
Submicroscopic changes in chromosomal DNA copy number dosage are common and have been implicated in many heritable diseases and cancers. Recent high-throughput technologies have a resolution that permits the detection of segmental changes in DNA copy number that span thousands of base pairs in the genome. Genomewide association studies (GWAS) may simultaneously screen for copy number phenotype and single nucleotide polymorphism (SNP) phenotype associations as part of the analytic strategy. However, genomewide array analyses are particularly susceptible to batch effects as the logistics of preparing DNA and processing thousands of arrays often involves multiple laboratories and technicians, or changes over calendar time to the reagents and laboratory equipment. Failure to adjust for batch effects can lead to incorrect inference and requires inefficient post hoc quality control procedures to exclude regions that are associated with batch. Our work extends previous model-based approaches for copy number estimation by explicitly modeling batch and using shrinkage to improve locus-specific estimates of copy number uncertainty. Key features of this approach include the use of biallelic genotype calls from experimental data to estimate batch-specific and locus-specific parameters of background and signal without the requirement of training data. We illustrate these ideas using a study of bipolar disease and a study of chromosome 21 trisomy. The former has batch effects that dominate much of the observed variation in the quantile-normalized intensities, while the latter illustrates the robustness of our approach to a data set in which approximately 27% of the samples have altered copy number. Locus-specific estimates of copy number can be plotted on the copy number scale to investigate mosaicism and guide the choice of appropriate downstream approaches for smoothing the copy number as a function of physical position. The software is open source and implemented in the R package crlmm at Bioconductor (http:www.bioconductor.org).
Keywords: Bioinformatics, Hierarchical models, DNA copy number variations, Single nucleotide polymorphism array
1. INTRODUCTION
Segmental changes in DNA copy number arise through genomic rearrangements that cause insertions or deletions of genomic fragments. Such rearrangements are thought to arise most commonly via nonallelic homologous recombination in regions that contain low copy repeats (Gu and others, 2008), and can occur in the germline during meiosis as well as during mitosis in somatic cells. Many of the genomic rearrangements that affect DNA copy number are likely to be neutral with respect to phenotype. For instance, an extensive list of deletions and amplifications has been catalogued in apparently normal HapMap individuals (Redon and others, 2006, Kidd and others, 2008). However, genomic rearrangements that occur in regions that disrupt gene function or alter the copy number of genes that are dosage sensitive can affect phenotypes. See Lupski for a recent review (Lupski, 2009). Alterations of DNA copy number are implicated in many diseases, including autism spectrum disorders (Autism Genome Project Consortium, 2007, Marshall and others, 2008), bipolar disease (Zhang and others, 2008), autoimmune disorders such as type I diabetes (McKinney and others, 2008), and cancer (Ma and others, 2009, Cappuzzo and others, 2009, Woo and others, 2009). For other heritable diseases such as schizophrenia, the role of recurrent copy number variants in disease remains elusive (Sutrala and others, 2007, Need and others, 2009).
Copy number variants spanning regions of the genome greater than one megabase (Mb) are detectable by cytogenetic techniques such as spectral karyotyping and fluorescence in situ hybridization. However, many changes to DNA copy number are thought to involve smaller segments of the genome that are below the level of resolution attainable by cytogenetic methods. High-throughput genotyping arrays enable the measurement of genotype and copy number across the genome. The resolution for detecting copy number variant in current platforms is on the order of thousands of base pairs and can therefore be used to identify segmental changes that are not detectable by spectral karyotyping (resolution: 5–10 Mb). Screening for alterations in copy number has identified genomic regions known to be involved in disease, such as the neurexins in autism (Autism Genome Project Consortium, 2007), as well as novel targets that suggest a role of less well-understood pathways in disease etiology. High-throughput genotyping platforms provide a useful genomic screen whereby loci exhibiting patterns of variation between normal and disease individuals can be identified and followed. While most genotype calling algorithms are highly concordant for the vast majority of single nucleotide polymorphisms (SNPs), copy number estimation is more sensitive to technological artifacts and differences in the preprocessing and normalization steps.
This paper is organized as follows. Section 2 outlines our motivation for developing a multilevel model to address batch effects and improve estimates of uncertainty. Section 3 defines a theoretical framework for copy number in hybridization-based platforms and the challenges of adapting this model to high-throughput genotyping arrays. Section 4 describes an estimation algorithm that is motivated by many of the fundamental features of standard approaches, including maximum likelihood and empirical Bayes. In Section 5, we illustrate the main innovations of our approach using two experimental data sets and compare our results with software recommended by the array manufacturer. Concluding remarks are provided in Section 6.
2. MOTIVATION
The focus of this paper is the estimation of allele-specific copy number at polymorphic loci and the total copy number at nonpolymorphic loci as well as the corresponding uncertainty. Statistical methods that smooth locus-level estimates, such as segmentation algorithms or hidden Markov models (HMMs), are downstream of the work considered here and stand to benefit from improvements to the locus-level summaries. Additional background regarding our decision to implement a locus-level model for copy number and a more detailed discussion of downstream methods for copy number estimation are reviewed in Section A of the supplementary material (available at Biostatistics online). Figure 1 in Section H of the supplementary material (available at Biostatistics online) illustrates the difficulty of copy number estimation as batch (here, laboratory) and true copy number changes are likely to have very similar effects on the data. In general, our work is motivated by the observation of large batch effects in several genomewide data sets and the need for improved estimates of copy number uncertainty that can be propagated to the downstream algorithms reviewed in Sections A and F of the supplementary material (available at Biostatistics online).
Fig 1.

The European ancestry controls for bipolar disease were run on 29 plates; we excluded 6 plates that had fewer than 20 samples after removing duplicates and samples with low quality (signal to noise ratio less than 5). (a) Scatter plots of the quantile normalized intensities of the A (x-axis) and B (y-axis) alleles for SNP_A-4251622. Highlighted in the scatter plots are the samples from the plates IMAGE and THYME. (b) Boxplots of log2(A) + log2(B) stratified by plate. (c) For each SNP on chromosome 15, we performed an analysis of variance (ANOVA) for the quantile normalized log2(A) + log2(B) intensities by plate. After excluding 5 plates with fewer than 20 samples, the ANOVA provides an F-statistic with 22 and 984 degrees of freedom for each of the 26,074 SNPs on chromosome 15.
2.1. Batch effects
Batch effects that arise from laboratory, temporal, or other experimental variation can be addressed in several ways. One approach is to consider batch effects as part of the quality control step in the analysis of genomewide arrays. For instance, Zhang and others (2008) excluded regions of copy number alteration that were associated with batch in their Genomewide association studies (GWAS) for bipolar disease. This approach is sensible if a relatively small number of loci are affected by batch. In such instances, smoothing the locus-level estimates using a HMM or a segmentation procedure may reduce the impact of batch effects on downstream analyses. An alternative approach is to apply a correction to the signal intensities that effectively gives each batch the same mean signal intensity, as in the GISTIC algorithm (Beroukhim and others, 2007). While GISTIC uses date as a surrogate for batch, one could also estimate batch using principal components analysis applied to the raw intensities (Golden Helix, 2009). Figure 1(a) and (b) illustrate the batch effect at one locus on chromosome 15 among the European ancestry controls in a data set for bipolar disease. The distribution of all F-statistics for chromosome 15 (Figure 1c) demonstrates that batch effects persist after quantile normalization and are not isolated to a small number of loci. The batch effects observed on chromosome 15 were typical of the other autosomes in this data set and intermediate to the relatively small batch effects observed in 270 HapMap samples and the very large batch effects we have observed in studies comprised of more than 5000 individuals (data not shown).
2.2. Shrinkage
Shrinkage of the variance estimates is likely to be useful for several reasons. First, the technology used to estimate the amount of DNA hybridized to the array affects the measured fluorescence of many probes in similar ways. Secondly, many SNPs have a low minor allele frequency or “unobserved” biallelic genotypes that complicate the estimation procedure discussed in Section 4. Third, shrinkage reduces the sensitivity of our approach to extreme values, such as variance estimates near zero. When propagated to HMMs or segmentation algorithms, the shrunken estimates of uncertainty may provide a less ad hoc mechanism for handling outliers and a resolution for detecting copy number alterations that depends both on the density of markers and the precision of the estimates.
3. MODEL
Batch effects appear to be an unavoidable feature of studies involving a large number of arrays, one that copy number estimation algorithms should take into account. As batch can be easily identified (Figure 1), we argue that batch can be successfully modeled. Here, we introduce a model for copy number estimation based loosely on an approach described by Wang and others (2008). Our method differs from Wang and others in several important ways. First, we model batch as a fixed effect. More generally, one can think of batch as a variable selection problem to be inferred at each locus (see Section 6). For the purpose of this paper, we treat batch as known. Secondly, we avoid using training data to estimate model parameters. Instead, we estimate model parameters using an algorithm that relies only on the experimental data (Section 4). Third, we provide prediction regions for loci with low minor allele frequencies and potentially unobserved genotypes. Fourth, we provide a solution for estimating copy number for nonpolymorphic probes in the most recent generation of genotyping platforms. Fifth, we shrink locus-level estimates of the variance and correlation across alleles that are often very noisy though a hierarchical model. Sixth, we propose a correction step that provides less biased estimates of copy number when many subjects have nonnormal copy number. Finally, software for fitting this model to the Affymetrix 5.0 and 6.0 platforms, as well as several Illumina platforms, is publicly available from Bioconductor.
3.1. A multilevel model
Polymorphic loci.
We propose a multilevel model for the locus-level intensities that is motivated by past work with other hybridization-based technologies. In particular, a general framework for modeling the normalized fluorescence intensities in gene expression arrays has been recently described (Wu and Irizarry, 2007) and is discussed in greater detail in Section A of the supplementary material(supplementary material available at Biostatistics online) . We model the observed intensity I for allele k at locus i, sample j, and batch p as follows:
 |
(3.1) |
The average fluorescence arising from optical background and nonspecific hybridization are collectively parametrized by ν and referred to as background. The slope, φ, in model (3.1) provides an estimate of the change in the average intensity at a given locus per each integer increase in the allelic copy number. Both the background and slope are allowed to depend on the SNP i and the batch p. See Figure 1a for an illustration of these parameters in the context of an A versus B intensity scatterplot of a single SNP.
The errors δ and ε in model (3.1) account for array-to-array variation within a batch of the background and slope terms, respectively. These terms are each approximately log normal and assumed to be independent across loci and independent of each other:
Note, however, that the error terms are not independent across alleles. In particular, Figure 1(a) and (b) suggest that the correlation of the A and B intensities is most pronounced for samples with allelic copy numbers greater than 0. The correlation reflects cross-hybridization of the A allele probe to the B allele target sequence (and vice versa). As in Wang and others (2008), we assume that the joint distribution of the log intensities conditional on the allelic copy number is approximately bivariate normal:
 |
(3.2) |
The diagonal elements of Σ are as follows:
| (3.3) |
The correlation of the A and B intensities, ρip, is SNP and batch specific.
At the next level of the model specification, prior distributions are selected for Σ. A commonly used prior is an inverse Wishart. However, we view this prior as too restrictive as a single degree of freedom is required for the variances. As Σ is a 2×2 matrix, we have considerable flexibility for exploring different priors for the standard deviations and correlation. We use independent inverse chi-squared priors with dA and dB degrees of freedom for the background,
| (3.4) |
and slope variances,
| (3.5) |
The terms tA,p2,tB,p2,sA,p2, and sB,p2 in (3.4) and (3.5) correspond to the median variance of the background and slope terms, respectively. Note that these values are the same for all loci and depend only on the batch p. For the correlation structure, we use the prior ρip∼Beta(α,β),whereα and β are estimated empirically and place more mass at typical values. The motivation for an informative prior on the correlation is that cross-hybridization of the A and B alleles gives rise to positive correlations. In our experience, negative correlations (after conditioning on the allelic copy number) are spurious and usually occur when an insufficient number of observations are available to estimate the correlation.
Nonpolymorphic loci.
For nonpolymorphic probes, only one allele is interrogated at each locus. We generically denote this allele as T. Again, we propose a theoretical model for the observed intensity for allele T at locus i, sample j and batch p as a convolution of fluorescence from optical background and nonspecific binding of other probes, νT, and fluorescence arising from specific hybridization of the probe to the target sequence, φT. Explicitly,
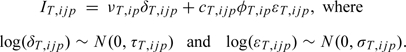 |
(3.6) |
Again, the background and signal parameters are allowed to depend on both the nonpolymorphic locus i and batch p. The error terms corresponding to background and signal account for array to array variation within a batch and are assumed to be log normal, independent across loci, and independent of each other. Inverse chi-squared priors for δT and εT variances complete the specification of the hierarchical model:
Challenges.
There are several challenges to fitting models (3.1) and (3.6). First, the parameters νand φ cannot be reliably estimated from training data because of batch effects. Therefore, νA, νB, νT, φA, φB, φT, cA, cB, and cT are allowed to depend on both the locus and batch and must be estimated from the experimental dataset. Secondly, the error terms δA, δB, δT, εA, εB, and εT that capture within-batch variation of the background and signal intensities across arrays are not Gaussian. In principle, these parameters can be estimated using maximum likelihood or empirical Bayes. However, least squares and method of moments approaches to parameter estimation are well known to be biased, particularly when the variance of these parameters is large. The standard approach is a generalized linear model with an exponential link function, as employed by LaFramboise and others (2007). Such an approach requires an iterative estimation procedure that we view as impractical for platforms that interrogate millions of loci. Thirdly, for polymorphic loci, the covariance matrix is a function of the allelic copy number. Finally, outliers are common and robust-to-outlier approaches are needed. Again, least squares and method of moments are not robust to outliers. Taken together, the size of current genotyping platforms, the inevitability of batch effects in studies involving a large number of arrays, errors that are non-Gaussian, and the need for robustness has led us to develop an ad hoc approach motivated by the fundamental features of the standard approaches.
4. COPY NUMBER ESTIMATION ALGORITHM
We prescribe a general strategy for copy number estimation that (i) develops naive estimates of the allelic copy number that are taken to be known, (ii) uses a linear model to estimate batch- and locus-specific parameters for the background and slope terms, and (iii) updates the naive estimates of allelic copy number. Robust-to-outlier procedures for preprocessing and copy number estimation are emphasized. Several problems remain after steps (i)-(iii), including unobserved genotypes at many polymorphic loci and variance estimates that are based on a small number of observations. We propose solutions to each of these problems that take advantage of the large number of observations available from other loci.
Prior to copy number estimation, all arrays are quantile normalized to a target reference distribution. The normalized intensities are summarized to the level of the locus. For example, the Affymetrix 6.0 platform has 3 and occasionally 4 identical probes for each allele at polymorphic loci and 1 probe for each nonpolymorphic locus. For the polymorphic loci, we quantile normalize the raw intensities and then summarize the normalized values by the median. For the nonpolymorphic probes, the Affymetrix 6.0 platform has only one probe per target sequence and we use the quantile-normalized intensities directly.
4.1. Allele-specific copy number
The parameters for νk,φk,and ck in model (3.1) are unknown for allele k∈{A,B}. As a first step, we genotype all the samples on the array using the crlmm software (Carvalho and others, 2007, Carvalho and others, 2010), obtaining genotype calls of AA, AB, and BB for the polymorphic loci. The genotype calls provide a naive estimate of the allele-specific copy number—an integer value of 0, 1, or 2 for each allele. We denote the naive estimates for the A and B alleles by cA☆ and cB☆, respectively. We use quantile-based estimators, the median and the median absolute deviation (MAD), to obtain robust estimates of the mean ( ) and variance (
 ) on the intensity scale for genotype GT. (The median is typically more robust to outliers than a trimmed mean.) For example,
  is computed as the median of intensities IB,ijp for samples j with genotype AA. Inverse chi-squared priors with degrees of freedom
  ,
,  are used to shrink locus-specific estimates of the variance to the batch-specific median variance,
  . Note that the within-genotype centers are approximately normal regardless of the distribution of I. We (and others) have observed that the relationship of the within-genotype centers is approximately linear with the integer copy number (Huang and others, 2006, Wang and others, 2008). Using the naive estimate of the integer copy number in the design matrix, we use weighted least squares regression to estimate νA and φA:
 |
(4.1) |
The errors mA,ijp are approximately independent multi-Gaussian. We repeat the procedure for the B-allele to obtain batch- and locus-specific estimates of νB and φB. See Figure 2 of the supplementary material (available at Biostatistics online) for an illustration of the linear model. The naive estimates of allele-specific copy number are updated by subtracting the estimated background from the observed intensity and scaling by the slope coefficient. Specifically,
 |
(4.2) |
As discussed in Section 6, the assumption that the median intensity is linear with copy number appears reasonable for a limited range. We have observed departures from linearity for larger copy numbers as the fluorescence becomes more saturated. In practice, we constrain  . The above prescription for copy number estimation is predicated on the assumption that at any given locus the median copy number is 2. We explore the robustness of this approach to misspecification of the initial values for allele-specific copy number in an experimental data set (Section 5) and through simulation in Section D of the supplementary material (available at Biostatistics online).
Fig 2.

Scatterplots of the A and B allele intensities for SNP_A-1969022 on chromosome 21 in the trisomy data set. (a) Our approach for copy number estimation uses naive estimates of allele-specific copy number based on the biallelic genotype calls. A weighted linear regression is fit on the intensity scale to quantile-based estimators of the within-genotype location and scale. Estimates of νA,νB,φA, and φB are locus and batch specific. The ellipses demarcate a 95% confidence region for copy number 2. (b) Prediction regions for copy number 1, 2, and 3. Plotting symbols now denote the trisomy phenotype which is not known by the regression model. Note that the prediction regions are robust to incorrect biallelic genotype calls —here, 26 of the 96 subjects had chromosome 21 trisomy and, therefore, incorrect biallelic genotypes.
4.2. Unobserved genotypes and nonpolymorphic loci
For many polymorphic loci, the minor allele is rare and one or more of the three possible biallelic genotypes are not observed. For SNPs with genotype GT not observed, we impute μAGT and μBGT via regression. For example, to impute μAAA for SNPs with genotype AA unobserved, we regress  on
on  and
and  using a set of SNPs for which all 3 genotypes were observed. With estimates of the coefficients for and , we predict the value of μAAA from the observed and at this locus. We repeat the procedure for the B allele to impute μBAA. For a polymorphic locus with 2 genotypes not observed, we impute the unobserved within-genotype medians via regression again using SNPs with all 3 genotypes observed. The variance terms for the unobserved genotype GT,
  , and
, and  are obtained from the prior . A straightforward extension of our approach is to scale the prior variance by the uncertainty of the imputed values estimated using techniques such as multiple imputation.
For nonpolymorphic loci, the parameters for the background, νT, and the slope, φT, in model (3.6) are difficult to estimate as there are no genotype clusters to guide the estimation procedure. For each nonpolymorphic probe, we assume that the median of the observed intensities across samples in the batch corresponds to normal copy number. The current approach in the R package crlmm (see version number in Section I of the supplemental material available at Biostatistics online) is to impute φT from polymorphic loci in which all 3 genotypes were observed. Briefly, for SNPs with 3 biallelic genotypes observed, we fit a linear model using and  as the explanatory variables and the corresponding slopes,
  and
and  , as the response variables. The coefficients from this model are used to impute the slope parameter for nonpolymorphic loci,
  . Note that the background fluorescence, νT, is determined by the relationship
  . Transforming the nonpolymorphic intensities to the copy number scale is achieved by
  .
.
Contamination.
In many applications, DNA is isolated from a mixture of 2 or more cell types that may have different somatic alterations. As the DNA in the cell populations may differ, noninteger copy numbers are plausible. HMMs that assume integer copy number states are not appropriate. The transformation in (4.2) for polymorphic loci, and the analogous transformation for nonpolymorphic loci, allow one to plot  as a function of the physical position to assess contamination. When contamination is likely to have occurred, a variety of nonparametric segmentation approaches are available that can be used to identify noninteger copy number gain and loss.
4.3. Uncertainty
Estimates of the uncertainty are important for downstream algorithms that smooth estimates of the copy number as a function of the physical position. As mentioned previously, a critical choice governing the suitability of a smoothing algorithm is the presence of a mixture of cell populations that can result in noninteger copy number. In the absence of cell contamination, we advocate an HMM that can be fit directly to bivariate normal scatterplots of the log A and log B intensities. (The approach of fitting a HMM directly to the log A and log B intensities was first described by Korn and others (2008).) When cell contamination is likely, we prefer nonparametric segmentation algorithms that can identify any noninteger shift in copy number. Our focus in this section is improving estimates of the uncertainty for the prediction regions of allele-specific copy number.
Integer copy number.
As HMMs can incorporate locus-specific estimates of the location and scale in the emission probabilities, HMMs for detecting copy number alterations can therefore be applied directly to the bivariate normal scatterplots without first transforming the intensities to the copy number scale (Korn and others, 2008). Conditional on the allelic copy number, the logarithm of the IA and IB intensities is approximately bivariate normal with a mean and covariance that is locus and batch specific, as in model (3.2). Again, our procedure utilizes naive estimates of the allelic copy number from the biallelic genotype calls to provide an estimate of Σ. To illustrate this approach, we describe the estimation of Σ for an SNP with biallelic genotype AA (cA☆ = 2,cB☆ = 0). From (3.3), the diagonal elements of Σip are (Σip)11 = σA,ip2 and (Σip)22 = τB,ip2. The background variance τB,ip2 is estimated as the MAD of the log intensities for the B allele across all subjects with genotype AA at locus i. The signal variance σA,ip2 is estimated as the MAD of the log intensities for the A allele across all subjects with genotype AA at locus i. Implicitly, we assume that the variance of δA is small relative to the variance of εA such that  . The assumption that the variance is constant for cA☆ greater than zero appears reasonable on the log scale. Similarly, an initial estimate for the correlation of the log intensities for the A and B alleles, ρip, is estimated empirically among subjects with genotype AA. The within-genotype empirical estimates for the variance terms and the correlation parameter provide an initial estimate of Σ. These estimates can be very noisy when based on a small number of observations. Therefore, we shrink the initial estimates of Σ using inverse chi-squared priors as described in Section 3. Specifically, shrinkage estimates for the background and signal variances for (cA☆ = 2,cB☆ = 0) are obtained by
 |
The count NGT,ip denotes the number of subjects with genotype GT at locus i in batch p. The degrees of freedom for the priors, dA and dB, can be estimated as described in Lönnstedt and Speed (2001). Median values of the background and signal variance, denoted by t and s, respectively, are estimated across all loci and allowed to depend on the batch. In addition to the variances, we also shrink the empirical estimate of the correlation ρi,p. As motivated in Section 3, we suggest a Beta prior that puts most of the mass on typical values. The resulting covariance matrix,  , can be used to plot prediction regions for any (cA☆ > 0,cB☆ = 0). For instance, see the ellipses for in Figure 1(b). The covariance matrices for (cA☆ = 0,cB☆ > 0), (cA☆ > 0,cB☆ > 0) and (cA☆ = 0,cB☆ = 0) are obtained using a similar procedure. By scaling by a sample-specific estimate of the variance across all loci, the variance estimate can incorporate information on the overall noise of the sample relative to other samples.
4.4. Common copy number variants
Our approach for estimating copy number uses robust estimates of the within-genotype location and scale of the intensities. In particular, we use medians for the location and MADs for the variance to limit the influence of outliers on parameter estimates. However, many regions of the genome appear to contain common variants in apparently normal individuals (McCarroll and others, 2008, Kidd and others, 2008), and many diseases may have regions that are commonly altered. For genomic locations where a large number of subjects harbor a copy number alteration, estimates of ν and φ can be biased. We propose an update for the background and slope parameters that provides additional robustness to regions with a large number of alterations. This procedure does not require a priori knowledge of the genomic locations of the common variants, an important feature as these are often not well characterized or highly variable across different populations.
The general strategy is to estimate the parameters νA,φA,νB,φB,νT, and φT as described previously. Using initial estimates of these parameters, we calculate the posterior probability of belonging to a prediction region corresponding to an aggregate copy number of 0, 1, 2, or 3. Given the total copy number, we assume that any of the integer (cA,cB) combinations are equally likely a priori. At each locus, we tabulate the frequency for which the posterior probability of an amplification or deletion is greater than the posterior probability of normal copy number. If the frequency is uneven for amplifications and deletions, we recompute the within-genotype location and scale parameters after trimming observations from the tail of the distribution that has a greater frequency. See Section 5 for an application.
5. RESULTS
We illustrate our approach for copy number estimation using 2 data sets that were assayed on the Affymetrix 6.0 genotyping platform: a data set containing 26 individuals with chromosome 21 trisomy and 70 apparently healthy controls (referred to as the Chakravarti data set), and a GWAS for bipolar disease (dbGaP accession number phs000017.v3.p1). For the Chakravarti data set, we analyzed the 96 samples as a single batch and assessed the robustness of our estimation procedure to a large fraction of samples with nonbiallelic genotypes. For the bipolar data set, we use chemistry plate as a surrogate for batch and restrict our analysis to the 1094 European ancestry controls that were processed on 29 plates over a 2-month period. For both analyses, we used default settings for the priors as described in Section E of the supplementary material (available at Biostatistics online). A difficulty in comparing our method to the Birdseye and Canary algorithms in the Birdsuite software suggested on the Affymetrix Web site for copy number analysis is that these algorithms do not provide locus-level estimates of copy number. Rather, Birdsuite provides output from a HMM, Birdseye, for the detection of de novo copy number variants and a separate algorithm, Canary, for the detection of common copy number variants (Korn and others, 2008, McCarroll and others, 2008).
5.1. Common copy number variants
We applied our algorithm to the Chakravarti data set to explore the robustness of our approach to the assumption that the typical copy number is 2 at any given locus. As discussed in Section 4, our algorithm uses biallelic genotype calls to develop naive estimates of copy number and parameter estimates for the prediction regions. After 1 iteration of the algorithm, the estimates of copy number are biased toward small values as the trisomy samples skew the within-genotype estimates of location and scale (Figure 3). However, the posterior probability that a trisomy sample has 2 chromosomal copies at a given locus tends to be low, and these samples can be discounted during a second iteration of the algorithm that updates the linear model parameters as described in Section 4.4. Subtle shifts in the prediction regions following the update can be observed for 3 example SNPs in Figure 3. Boxplots of the copy number for all SNPs on chromosome 21 demonstrate the bias reduction (Figure 3d and e). A simulation to assess when the fraction of subjects with altered copy number overwhelms the assumptions of the linear model is included in Section D of the supplementary material (supplementary material available at Biostatistics online). We estimate that the breaking point is approximately 30%, beyond which the copy number estimates for the trisomy subjects begins to approach the noise level for copy number 2.
Fig 3.

(a–c) The ellipses denote prediction regions for copy number 1, 2, and 3 before (dashed lines) and after (solid lines) bias adjustment for 3 SNPs on chromosome 21 in the Chakravarti data set. Boxplots of the copy number estimates for SNPs on chromosome 21 before (d) and after (e) the bias correction for common copy number variant. The bias correction does not use any phenotypic information of the samples, nor does it require a priori specification of regions that are thought to harbor common copy number variants. The circle plotting symbols denote the overall copy number estimate from Birdseye.
While locus-specific copy number estimates are not available from the Birdsuite software, an overall copy number estimate for each chromosome is provided by the Birdseye algorithm for the purpose of assessing mosaicism. The overall chromosome 21 estimates plotted in Figure 3 suggest that both the normal and trisomy samples are mosaic in copy number. The reason for the apparent mosaicism is that the Birdseye HMM (Table 1) is not particularly robust to departures from the assumption that most individuals at a given locus have normal copy number. To more formally compare our approach to the Birdseye HMM, we fit a HMM available in the R package VanillaICE to the polymorphic loci (Scharpf and others, 2008). For both HMMs, we used the default settings for the software versions indicated in Section I of the supplementary material (supplementary material available at Biostatistics online). Assuming that the true copy number is 2 in the normal samples and 3 for the trisomy samples, we calculated the proportion of correct calls for each HMM. Our approach maintains high sensitivity and specificity for detecting alterations despite approximately 27% of the samples having a known copy number alteration. That is, naive estimates of copy number provided by the biallelic genotype calls can be incorrect in a large number of samples, but still provide unbiased estimates of copy number in regions that are commonly variant. In comparison to the Birdsuite calls based on the blended output of the Birdseye HMM and Canary fit to the full marker set (Table 1), our approach has both higher sensitivity in the trisomy subjects (0.955 versus 0.918) and comparable specificity in the normal subjects (0.996 versus 0.991, data not shown). When we fit the HMM to the full marker set, for which the copy number estimates at nonpolymorphic loci remain biased toward 2, the VanillaICE and merged results from Birdseye and Canary again perform comparably in terms of specificity for the normal subjects (0.991 versus 0.996), but the sensitivity for copy number estimates among the trisomy subjects decreases from 0.96 to 0.89, revealing the need for improved univariate prediction regions at the nonpolymorphic loci in future versions of crlmm. As the entire chromosome is assumed to be either copy number 2 or copy number 3, an inherent limitation of this comparison is the lack of a penalty for over-smoothing that would limit the detection of smaller microdeletions and amplifications. The comparable specificities and sensitivities in the analysis with the full set of markers (SNPs + nonpolymorphic markers [NPs]) suggests that the default settings for the two HMMs provide comparable smoothing. A more detailed explanation of the technical considerations for this comparison is provided in Section B of the supplementary material (available at Biostatistics online).
Table 1.
The proportion of integer copy number estimates that agree with the true copy number for chromosome 21 in the trisomy data set computed for 2 HMM implementations.
| Copy number 2 | ||||
| Birdseye / Canary | SNPs + NPs | 0.0042 | 0.9914 | 0.0043 |
| crlmm & VanillaICE | SNPs | 0.0003 | 0.9957 | 0.0041 |
| crlmm & VanillaICE | SNPS + NPs | 0.0004 | 0.9962 | 0.0034 |
| Copy number 3 | ||||
| Birdseye / Canary | SNPs + NPs | 0.0006 | 0.0817 | 0.9177 |
| crlmm & VanillaICE | SNPs | 0.0000 | 0.0454 | 0.9546 |
| crlmm & VanillaICE | SNPs + NPs | 0.0000 | 0.1069 | 0.8931 |
Notes: The true copy number for loci on chromosome 21 is assumed to be 3 for the 26 trisomy samples and 2 for the 70 normal samples. The results from Birdsuite are a merge of the Birdseye HMM and Canary calls. The VanillaICE HMM was fit to the set of polymorphic markers using the adjusted prediction regions described in Section 4.4 (row 2) and has fewer false negatives that Birdsuite for 3-copy loci. The addition of the set of nonpolymorphic markers to the analysis (row 3) results in more false negatives among the trisomy subjects relative to the polymorphic set alone (0.955 versus 0.893). At 2-copy loci (the normal subjects), the specificity was 0.991 for Birdsuite and 0.996 for VanillaICE in both the full (SNPs + NPs) and the SNP-only analysis (data not shown).
5.2. Batch effects
The batch effect for SNPs on chromosome 15 in Figure 1(c) was comparable to the batch effects observed at polymorphic and nonpolymorphic loci on other chromosomes in the European ancestry bipolar controls (data not shown), demonstrating that quantile normalization alone was insufficient for removing the batch effect. Figure 4(a) plots the normalized log intensities for the A and B alleles for SNP_A-4251622, highlighting samples from 2 of the 29 chemistry plates used for the bipolar controls. The corresponding estimates of total copy number from a linear model that ignores the batch effect (here, plate effect) demonstrates that plate explains much of the variability in the copy number estimates (F-statistic 53.93). As much of the variation in the log A versus log B scatterplots is attributable to plate, the ellipses representing our uncertainty of the copy number prediction in Figure 4(a) are inflated. Allowing the parameters νA,νB,νT,φA,φB, and φT to depend on batch, the resulting prediction regions in Figure 4(a) more accurately reflect the uncertainty of the copy number estimates and are more robust to differences across batch (Figure 4b). A comparison with the Birdsuite software on this data is is provided in Section C of the supplementary material (available at Biostatistics online).
Fig 4.

(a) Scatter plots of the quantile normalized intensities for the A (x-axis) and B (y-axis) alleles of SNP_A-4251622 in the bipolar data set. Highlighted in each panel are the samples from plates IMAGE and THYME. Note that much of the variance in the normalized intensities is explained by batch. (b) Boxplots of total copy number before (top) and after adjustment for plate (bottom). A multilevel model that allows the prediction regions to depend on plate improves estimates and removes batch-driven artifacts.
6. DISCUSSION
In this paper, we propose a multilevel model that provides absolute estimates of allele-specific copy number at polymorphic loci and total copy number at nonpolymorphic loci. Our observation that batch effects and copy number changes are often indistinguishable in their effects on the data has led to an estimation procedure that defines batch-specific prediction regions for rare, nonbiallelic genotypes from more commonly observed biallelic genotypes. In particular, biallelic genotype calls of samples in the experimental data set provide naive estimates of allele-specific copy number that are used to derive robust-to-outlier parameters for the background and slope in a linear model fit on the intensity scale. Conditional on the naive estimates of copy number, the log A and log B intensities are correlated due to cross-hybridization of the probes for these alleles. As locus-specific estimates of the covariance are often based on a small number of observations, shrinking these estimates toward typical values provides additional robustness to unusually small or large variance estimates. The copy number estimates obtained from this approach are robust to batch effects and robust to a large proportion of individuals having a copy number alteration. Copy number estimates plotted versus physical position can be used to assess issues such as cell contamination.
Our procedure for locus-level estimation of copy number reduces the impact of batch effects in several ways. First, we quantile normalize the raw intensities for each sample to a target reference distribution. Quantile-normalizing samples to a target distribution ensures that the distribution of intensities is the same across batches and can reduce the occurrence of in silico batch effects incurred by how the samples were grouped by the software. Secondly, we do not rely on external data for training the model or a reference set for estimating ratios. In our experience, external data sets are unlikely to provide useful extrapolations due to (i) batch effects and (ii) latent biological differences between the external samples and the test samples. Third, we fit a multilevel model to the summarized intensities that allows locus-specific parameters for background and signal to depend on batch. Finally, we provide an option to iteratively estimate model parameters and compute copy number such that the bias of the estimated copy number in regions of the genome that are commonly altered is relatively robust to the assumption that the median copy number is 2. This approach does not require prior knowledge of the locations of regions that are commonly altered.
The R package crlmm may not be appropriate for some data sets. For the study of germline traits, our model is most useful when 25 or more samples have been processed together in a batch. Batches with fewer than 25 samples tend to have a large number of SNPs with unobserved biallelic genotypes. For such SNPs, the additional uncertainty from the imputation of the within-genotype moments further reduces the resolution for detecting copy number alterations. For the study of somatic cell diseases such as cancer, copy number alterations in a substantial fraction of the genome are not uncommon. The ability to accurately estimate the absolute copy number in cancer samples will depend to a large degree on an appropriate experimental design, in particular, whether normal controls were processed alongside the cancer samples throughout the experiment. In such a setting, we have demonstrated through simulation that copy number estimates for the test samples can be computed from model parameters that were estimated from only the normal controls with relatively small bias.
Of the models previously proposed in the literature, the models of Wang and others (2008) and Korn and others (2008) are the most similar to ours as both develop bivariate normal prediction regions for altered copy number. The Wang model provides allele-specific estimates of copy number that accounts for the correlation of A and B allele intensities. However, the Wang model is designed for an earlier version of the Affymetrix platform that contained only SNP probes and relies on training data to estimate model parameters. In addition, the Wang model does not address batch effects or explore shrinkage for improving variance estimates. The Korn model is similar to the Wang model with a few important differences. First, Korn and others recommend fitting their software by plate to address batch effects. In our experience, batch effects persist in by plate analyses with Birdsuite. Secondly, Birdsuite does not provide locus-specific estimates of copy number. Rather, Birdsuite houses separate algorithms for calling rare and common copy number variants that each borrow strength from neighboring loci to identify regions of copy number gain or loss. As locus-level estimates are not available, options to explore alternative smoothing algorithms, such as segmentation for samples that are mosaic in copy number, are not available. By contrast, crlmm advocates an approach in which the decision to explore segmentation or HMMs can be evaluated from visualizations of the locus-level summaries. In particular, mixtures of cell populations that give rise to noninteger copy number can be assessed by plotting the locus-level summaries.
Our model can be extended in several ways to improve the prediction regions for biallelic and nonbiallelic genotypes. First, our model assumes that the average intensity increases linearly with allelic dosage. The linearity assumption appears reasonable for many SNPs and can be used to help discriminate between outliers and sparsely populated non-biallelic genotypes. However, the linearity is not apparent for many SNPs and departures from linearity become more pronounced for allelic copy numbers greater than 2. Approaches that allow departures from linearity are a future direction of this work. Secondly, improvements to the univariate prediction regions at nonpolymorphic loci are needed. Again, approaches that relax the assumption of linearity are needed. Thirdly, we currently model batch as a fixed effect. A compromise between a fixed-effect and random-effect model that borrows strength across batch is likely to be very effective, particularly for small batches and SNPs with low minor allele frequencies. Finally, adjusting for sequence characteristics such as GC content and fragment length can be helpful for reducing the variance associated with the probe effect. We will explore methods that adjust for these factors along with batch effects in the future.
Our results provide a strong indication that a model-based approach for estimation of absolute, allele-specific copy number can be effective in large studies with pronounced batch effects, and that borrowing strength across loci can be useful for estimating the variance. Estimates of copy number and the corresponding uncertainty will be useful for downstream assessments of copy number–phenotype association.
SUPPLEMENTARY MATERIAL
Supplementary material is available at http://biostatistics.oxfordjournals.org.
FUNDING
National Institutes of Health (1K99HG005015); CTSA grant to the Johns Hopkins Medical Institutions; and National Heart, Lung, and Blood Institute (5T32HL007024) to R.B.S. National Institutes of Health (R01GM083084) from the National Institute of General Medicine and National Center for Research Resource (5R01RR021967) to R.A.I.
Acknowledgments
The bipolar data set used for the analyses described in this manuscript was obtained from the database of Genotype and Phenotype (dbGaP) at http://www.ncbi.nlm.nih.gov/gap through dbGaP accession number phs000017.v3.p1, and was provided through the Genetic Association Information Network (GAIN). We thank Erin M. Ramos and Lisa J. McNeil from the National Institutes of Health for help navigating dbGap. Conflict of Interest: None declared.
References
- Autism Genome Project Consortium. “Mapping autism risk loci using genetic linkage and chromosomal rearrangements.”. Nature Genetics. 2007;39:319–328. doi: 10.1038/ng1985. [DOI] [PMC free article] [PubMed] [Google Scholar]
- Beroukhim R, Getz G, Nghiemphu L, Barretina J, Hsueh T, Linhart D, Vivanco I, Lee JC, Huang JH, Alexander S others. Assessing the significance of chromosomal aberrations in cancer: Methodology and application to glioma. Proceedings of the National Academy of Sciences of the United States of America. 2007;104:20007–20012. doi: 10.1073/pnas.0710052104. [DOI] [PMC free article] [PubMed] [Google Scholar]
- Cappuzzo F, Marchetti A, Skokan M, Rossi E, Gajapathy S, Felicioni L, Grammastro MD, Sciarrotta MG, Buttitta F, Incarbone M others. Increased MET gene copy number negatively affects survival of surgically resected non-small-cell lung cancer patients. Journal of Clinical Oncology. 2009;27:1667–1674. doi: 10.1200/JCO.2008.19.1635. [DOI] [PMC free article] [PubMed] [Google Scholar]
- Carvalho BS, Louis TA, Irizarry RA. “Quantifying uncertainty in genotype calls.”. Bioinformatics. 2010;26(2):242–249. doi: 10.1093/bioinformatics/btp624. [DOI] [PMC free article] [PubMed] [Google Scholar]
- Carvalho MA, Marsillac SM, Karchin R, Manoukian S, Grist S, Swaby RF, Urmenyi TP, Rondinelli E, Silva R, Gayol L others. Determination of cancer risk associated with germ line BRCA1 missense variants by functional analysis. Cancer Research. 2007;67:1494–1501. doi: 10.1158/0008-5472.CAN-06-3297. [DOI] [PMC free article] [PubMed] [Google Scholar]
- Helix Golden. Copy Number Variation Analysis with SVS 7. Golden Helix Manual for SNP and Variation Suite. 2009 http://www.goldenhelix.com/SNP_Variation/tutorials/cnv/introduction.html. [Google Scholar]
- Gu W, Zhang F, Lupski JR. Mechanisms for human genomic rearrangements. Pathogenetics. 2008;1:4. doi: 10.1186/1755-8417-1-4. [DOI] [PMC free article] [PubMed] [Google Scholar]
- Huang J, Wei W, Chen J, Zhang J, Liu G, Di X, Mei R, Ishikawa S, Aburatani H, Jones KW others. CARAT: a novel method for allelic detection of DNA copy number changes using high density oligonucleotide arrays. BMC Bioinformatics. 2006;7:83. doi: 10.1186/1471-2105-7-83. [DOI] [PMC free article] [PubMed] [Google Scholar]
- Kidd JM, Cooper GM, Donahue WF, Hayden HS, Sampas N, Graves T, Hansen N, Teague B, Alkan C, Antonacci F others. Mapping and sequencing of structural variation from eight human genomes. Nature. 2008;453:56–64. doi: 10.1038/nature06862. [DOI] [PMC free article] [PubMed] [Google Scholar]
- Korn JM, Kuruvilla FG, McCarroll SA, Wysoker A, Nemesh J, Cawley S, Hubbell E, Veitch J, Collins PJ, Darvishi K others. Integrated genotype calling and association analysis of SNPs, common copy number polymorphisms and rare CNVs. Nature Genetics. 2008;40:1253–1260. doi: 10.1038/ng.237. [DOI] [PMC free article] [PubMed] [Google Scholar]
- LaFramboise T, Harrington D, Weir BA. PLASQ: a generalized linear model-based procedure to determine allelic dosage in cancer cells from SNP array data. Biostatistics. 2007;8:323–336. doi: 10.1093/biostatistics/kxl012. [DOI] [PubMed] [Google Scholar]
- Lönnstedt I, Speed T. Replicated microarray data. Statistica Sinica. 2001;12:31. [Google Scholar]
- Lupski JR. Genomic disorders ten years on. Genome Medicine. 2009;1:42. doi: 10.1186/gm42. [DOI] [PMC free article] [PubMed] [Google Scholar]
- Ma O, Cai W-W, Zender L, Dayaram T, Shen J, Herron AJ, Lowe SW, Man T-K, Lau CC, Donehower LA. MMP13, Birc2 (cIAP1), and Birc3 (cIAP2), amplified on chromosome 9, collaborate with p53 deficiency in mouse osteosarcoma progression. Cancer Research. 2009;69:2559–2567. doi: 10.1158/0008-5472.CAN-08-2929. [DOI] [PMC free article] [PubMed] [Google Scholar]
- Marshall CR, Noor A, Vincent JB, Lionel AC, Feuk L, Skaug J, Shago M, Moessner R, Pinto D, Ren Y, et al. Structural variation of chromosomes in autism spectrum disorder. American Journal of Human Genetics. 2008;82:477–488. doi: 10.1016/j.ajhg.2007.12.009. [DOI] [PMC free article] [PubMed] [Google Scholar]
- McCarroll SA, Kuruvilla FG, Korn JM, Cawley S, Nemesh J, Wysoker A, Shapero MH, de Bakker PIW, Maller JB, Kirby A others. Integrated detection and population-genetic analysis of SNPs and copy number variation. Nature Genetics. 2008;40:1166–1174. doi: 10.1038/ng.238. [DOI] [PubMed] [Google Scholar]
- McKinney C, Merriman ME, Chapman PT, Gow PJ, Harrison AA, Highton J, Jones PBB, McLean L, O'Donnell JL, Pokorny V others. Evidence for an influence of chemokine ligand 3-like 1 (CCL3L1) gene copy number on susceptibility to rheumatoid arthritis. Annals of the Rheumatic Diseases. 2008;67:409–413. doi: 10.1136/ard.2007.075028. [DOI] [PubMed] [Google Scholar]
- Need AC, Ge D, Weale ME, Maia J, Feng S, Heinzen EL, Shianna KV, Yoon W, Kasperaviciūte D, Gennarelli M others. A genome-wide investigation of SNPs and CNVs in schizophrenia. PLoS Genetics. 2009;5 doi: 10.1371/journal.pgen.1000373. e1000373. [DOI] [PMC free article] [PubMed] [Google Scholar]
- Redon R, Ishikawa S, Fitch KR, Feuk L, Perry GH, Andrews TD, Fiegler H, Shapero MH, Carson AR, Chen W others. Global variation in copy number in the human genome. Nature. 2006;444:444–454. doi: 10.1038/nature05329. [DOI] [PMC free article] [PubMed] [Google Scholar]
- Scharpf RB, Parmigiani G, Pevsner J, Ruczinski I. Hidden Markov models for the assessment of chromosomal alterations using high-throughput SNP arrays. Annals of Applied Statistics. 2008;2:687–713. doi: 10.1214/07-AOAS155. [DOI] [PMC free article] [PubMed] [Google Scholar]
- Sutrala SR, Goossens D, Williams NM, Heyrman L, Adolfsson R, Norton N, Buckland PR, Del-Favero J. Gene copy number variation in schizophrenia. Schizophrenia Research. 2007;96:93–99. doi: 10.1016/j.schres.2007.07.029. [DOI] [PubMed] [Google Scholar]
- Wang W, Carvalho B, Miller N, Pevsner J, Chakravarti A, Irizarry RA. Estimating genome-wide copy number using allele specific mixture models. Journal of Computational Biology. 2008;15:857–866. doi: 10.1089/cmb.2007.0148. [DOI] [PMC free article] [PubMed] [Google Scholar]
- Woo HG, Park ES, Lee J-S, Lee Y-H, Ishikawa T, Kim YJ, Thorgeirsson SS. Identification of potential driver genes in human liver carcinoma by genomewide screening. Cancer Research. 2009;69:4059–4066. doi: 10.1158/0008-5472.CAN-09-0164. [DOI] [PMC free article] [PubMed] [Google Scholar]
- Wu Z, Irizarry RA. A statistical framework for the analysis of microarray probe-level data. Annals of Applied Statistics. 2007;1:333–357. [Google Scholar]
- Zhang D, Cheng L, Qian Y, Alliey-Rodriguez N, Kelsoe JR, Greenwood T, Nievergelt C, Barrett TB, McKinney R, Schork N others. Singleton deletions throughout the genome increase risk of bipolar disorder. Molecular Psychiatry. 2008;14:376–380. doi: 10.1038/mp.2008.144. [DOI] [PMC free article] [PubMed] [Google Scholar]
Associated Data
This section collects any data citations, data availability statements, or supplementary materials included in this article.