Abstract
An electrospray-assisted laser desorption/ionization source with an infrared OPO laser (IR-ELDI) was constructed and optimized for peptide and protein mass spectrometry analysis. Similar to ELDI with an ultraviolet laser, IR-ELDI generates multiply charged molecules for peptides and proteins measured under ambient sampling conditions. Both samples in the dried state and analyte solutions can be directly measured by IR-ELDI without the presence of a conventional MALDI matrix. However, the analysis of sample solutions is shown to greatly enhance the sensitivity of the mass spectrometry measurement, as a 100-fold sensitivity gain for peptide measurements was measured. The limit of detection of IR-ELDI was determined to be 250 fmol for bradykinin (1.1 kDa), 100 fmol for ubiquitin (8.6 kDa), and 500 fmol for carbonic anhydrase (29 kDa). IR-ELDI is amenable for MS and MSn analysis for proteins up to 80 kDa transferrin. IR-ELDI-MS may be a useful tool for protein sequencing analysis from complex biological matrices, with minimal sample preparation required.
Introduction
The continuous development of ionization methods for mass spectrometry (MS) has expanded the applicability of MS to a wider variety of various organic and biological molecules. Electrospray-assisted laser desorption ionization (ELDI) is a soft ionization method that has demonstrated utility for both small and large molecular weight biological molecules.1, 2 ELDI generates multiply charged molecules under ambient sampling conditions. It combines features of both matrix-assisted laser desorption ionization (MALDI)3, 4 and electrospray ionization (ESI).5 The ionization process of ELDI consists of two separated, discrete steps. In the first step, analyte deposited on a target surface is desorbed by laser irradiation and gaseous analyte particles/ions are generated. In the second step, the laser desorbed particles are ionized by merging with charged solvent droplet produced by ESI.2, 6 Using an ultraviolet (UV) laser with either the laser or ESI off, no ELDI-generated ions are detected,1, 2 which suggests that the atmospheric pressure laser desorption ionization (LD)7, 8 or desorption electrospray ionization (DESI)9, 10 mechanisms are not playing a significant role in the ELDI ionization process.
ELDI operates under ambient conditions for both dry and wet biological samples, and with or without the need for traditional MALDI matrices.2, 6 Since the initial ELDI report,1 similar methods combining ESI and laser desorption steps for peptide and protein analysis have been reported. These methods include (1) matrix-assisted laser desorption electrospray ionization (MALDESI), in which traditional MALDI matrices are mixed with the analytes to aid the desorption process;11 (2) infrared laser-assisted desorption electrospray ionization (IR-LADESI), which uses a 2.94-μm infrared laser to desorb analytes from water-containing samples;12 and (3) laser ablation electrospray ionization (LAESI), which in principle is similar to IR-LADESI.13 Although these methods are referred to by different names, and their experimental conditions are somewhat different, in practice they all share a similar ionization mechanism – laser desorption or ablation of the sample analytes, followed by subsequent ionization by ESI.
ELDI-MS has been used to analyze a wide range of organic and biological samples with little-to-no sample preparation. These samples include the organic active ingredients in drug tablets,14 dye standards, color paintings, different color coatings on compact disks, and even organic polymers.14 ELDI-MS has been used to directly characterize organic compounds separated by thin layer chromatography (TLC) using either reversed phase C18 particles or normal phase silica gel.15
ELDI-MS has been shown to be an effective soft ambient ionization method for large peptides and proteins, ranging from 1 kDa angiotensin peptides, to 29 kDa bovine carbonic anhydrase, to 66 kDa bovine serum albumin (BSA).2 The limit of detection of proteins by ELDI-MS is reported to be 23 ng mm−2 (for carbonic anhydrase).6 ELDI has also been used to directly analyze proteins from complex biological samples, including blood, serum, tears, saliva,16 and whole cow milk.14 ELDI-MS analysis of porcine heart tissue and porcine liver tissue showed hemoglobin α- and β-chains.16 Direct ELDI-MS of bacterial cultures from Vibrio cholerae, Salmonella, and Streptococcus pyogenes detected abundant 6–12 kDa proteins.16
The ELDI process generates multiply charged molecules, which is directly amenable for top-down mass spectrometry and tandem MS (MS/MS) for characterizing protein primary structure and post-translational modifications.6 Tandem MS with ELDI has been used to generate sequence-informative product ions for 2.8 kDa melittin, 5.8 kDa insulin, 8.6 kDa ubiquitin, and carbonic anhydrase (collected up to MS4), using collisionally activated dissociation (CAD),17 electron capture dissociation (ECD),18 electron transfer dissociation (ETD),19 infrared multiphoton dissociation (IRMPD),20 and nozzle-skimmer dissociation (NSD),21 and acquired using quadrupole ion trap, linear ion trap (LTQ), or LTQ-Fourier transform ion cyclotron resonance (LTQ-FT).22
The analyte for ELDI can be either in the dried or wet state, and with or without the presence of traditional MALDI matrices. It is still somewhat controversial which experimental conditions provide the best ELDI-MS sensitivity. Our group and the Shiea group have found that the presence of a matrix is detrimental when analyzing dried solid samples;1, 6, 16 ELDI-MS analysis of dried samples without the use of a matrix seems to provide the best sensitivity.2, 6 On the other hand, carbon powder or traditional MALDI matrices appear to aid the analysis of samples measured directly from solution with laser desorption from a UV laser.2, 23 Muddiman’s group, however, reported that matrices are required for the analysis of dried solid samples using their MALDESI method, with 17 kDa myoglobin as the largest molecule analyzed by MALDESI to date.24
Most of the aforementioned ELDI experiments (and similar techniques) utilized a UV nitrogen laser for analyte desorption. Compared to a UV laser, a mid-infrared laser with wavelengths ranging from 2.7 to 4.0 μm provides potential advantages in the ELDI experiment. No externally added matrix should be needed to aid the laser desorption from sample solutions, as water itself should serve as an effective laser desorption matrix. The O–H stretching mode of water is resonant with the 3 μm output from an mid-infrared laser.25–28 Without the requirement for a formal matrix, the sample preparation step is greatly simplified. ELDI shows potential for tissue imaging, as large biomolecules can be desorbed and ionized intact directly from tissue samples, and laser focusing should in principle provide high spatial resolution;29 the potential spatial displacement of proteins and other biomolecules due to matrix addition during a tissue imaging scanning experiment could be avoided for IR-ELDI. Moreover, radiation from an IR laser may generate a larger amount of neutral analyte particles, which may help to increase the overall sensitivity of ELDI-MS.
Mid-infrared radiation has been tested in LAESI,13, 30 LADESI,12 and MALDESI experiments.31 LAESI was reported to analyze a variety of analytes without sample preparation or pretreatment, including metabolites, lipids, and proteins.13 Although its reported sensitivity for large proteins was not high,13 LAESI has been used to analyze metabolites from fresh tissue.30 IR-LADESI was shown to be effective for the analysis of pharmaceutical products and biological fluids such as blood and urine.12 Carbohydrates, lipids, and proteins up to 17 kDa equine myoglobin were measured using IR-MALDESI.31
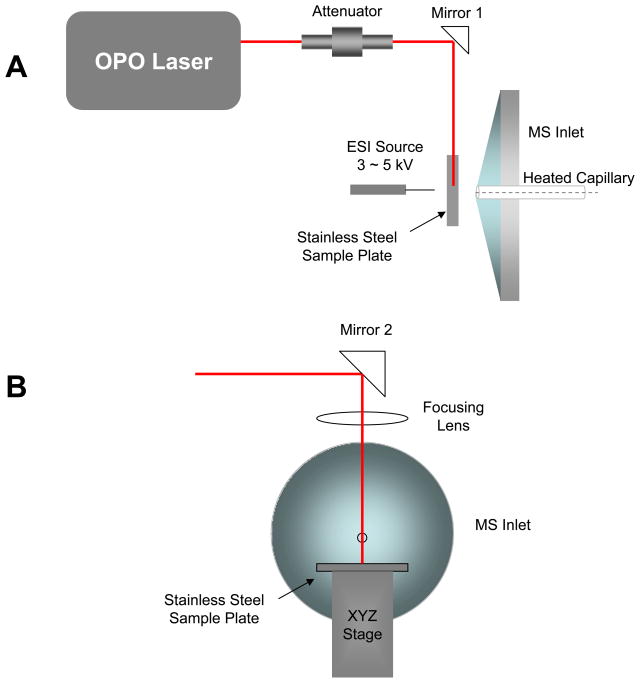
Previous work in our laboratory utilized a UV laser to effect the laser desorption step of the ELDI process.2, 6 In the present report, we describe our efforts to incorporate a tunable mid-IR (2700–3100 nm) optical parametric oscillator (OPO) for the laser desorption step (Figure 1; see Experimental). We show that IR-ELDI is amenable to proteins up to 80 kDa transferrin, and allows tandem MS analysis for proteins up to 29 kDa carbonic anhydrase. More importantly, the combination of IR desorption followed by ESI has significantly enhanced ELDI-MS sensitivity for large peptide and protein analysis, and traditionally employed matrices for UV-MALDI are not required for IR-ELDI.
Figure 1.
Schematic of the IR-ELDI source. (A) Top view. (B) Front view.
Results and discussion
Optimization of the IR-ELDI experimental conditions
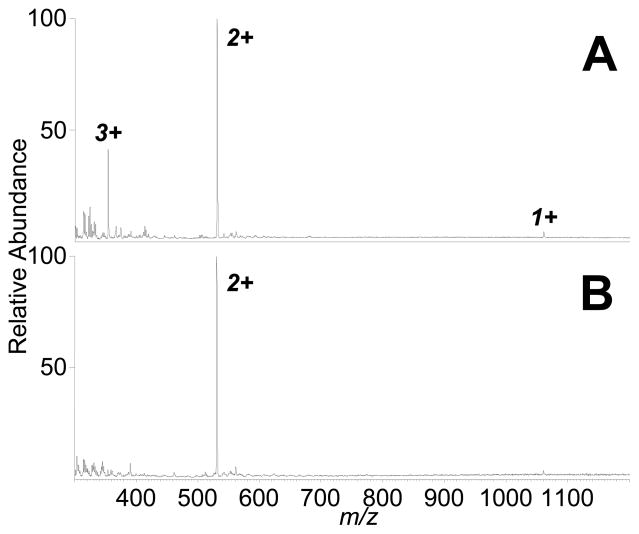
ELDI-MS with a UV laser has demonstrated capabilities for analyzing analytes both from solution (with traditional UV-MALDI matricies) and as dried samples. Our IR-ELDI setup was also tested for this capability. Figure 2 shows the IR-ELDI mass spectra of the peptide bradykinin (MW 1060; 2 μL of 50 μM concentration) acquired under wet (with water as the matrix) and dried conditions. Both mass spectra were acquired by accumulating signal over a 30-sec time period (600 laser shots). Signal levels were fairly constant over the data acquisition period (see Supplemental Figure 1). IR-ELDI-MS analysis of bradykinin from solution showed singly, doubly, and triply charged peptide ions (Figure 2A). For dried sample analysis, bradykinin sample was uniformly dried to a spot area of 13 mm2. Although the target was constantly moved to avoid the depletion of the sample, only a very small amount of sample was consumed during the 30-sec period. Doubly charged and a small amount of singly charged ions were detected from the same amount of dried bradykinin (without MALDI matrix; Figure 2B), as multiply charged protein ions are commonly detected with IR-MALDI.26 Based on the absolute intensity of the 2+-charged peptide ions (m/z 531), the presence of the water molecules with the analyte on the target provided a 100-fold sensitivity gain. This suggests that analyte in the solution phase may be preferable for IR-ELDI-MS analysis.
Figure 2.
IR-ELDI-MS analysis of bradykinin from “wet” (A) and dried (B) sample on-target. (A) From a solution of bradykinin (2 μL of 50 μM), the intensity of the 2+ ion (m/z 531) is 4.9 × 10⁴, while (B) the same amount of dried peptide sample yielded a signal intensity of 4.8 × 10².
For IR-ELDI, light is absorbed through states associated with O-H stretching vibrations, for example, in water. The absorption of the energy at a given fluence will cause a plume of material to rapidly expand outwardly from the sample surface. Whether or not this plume is formed by stress or by thermal forces (phase explosions, etc.) is debatable. However, due to the much lower absorption coefficient of mid-IR absorbing material compared to UV, more laser energy is used and therefore a greater amount of material is ejected.27, 32 Because ELDI “samples” the analyte material into the electrospray for subsequent ionization, larger ablation plumes are preferred and this should result in increased signal intensity.
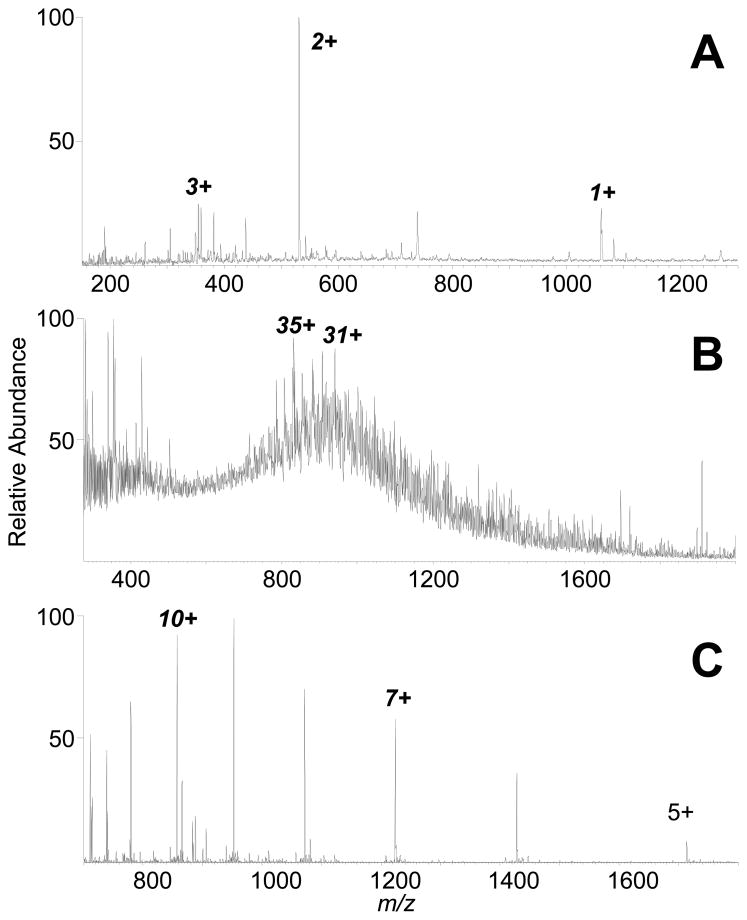
In our previous work with UV-ELDI-MS, we were able to measure a mass spectrum with a signal-to-noise(S/N) of 3 for carbonic anhydrase from 10 pmol dried to a spot area of 13 mm2.6 For our system with the IR-OPO laser, ELDI sensitivity for peptides and proteins is shown to surpass those reported in the earlier ELDI publications, and in other reports of ELDI-similar laser-based atmospheric pressure MS system from other labs. Our best sensitivity achieved with IR-ELDI-MS to date is approximately 250 fmol (0.5 μL of 0.5 μM concentration) of peptide bradykinin (Figure 3A), 500 fmol (0.5 μL of 1 μM concentration) of middle-sized protein carbonic anhydrase (Figure 3B; measured molecular mass of 29,010 ± 2), and 100 fmol (1 μL of 0.1 μM concentration) of ubiquitin (Figure 3C) applied on-target, yielding mass spectra with reasonable S/N. The sensitivity of our IR-ELDI setup is also shown to surpass that of AP-IR-MALDI using water as a matrix, which was reported to analyze 10 pmol of peptide with MW < 2 kDa.33 Thus, from our preliminary experiments, ELDI with an IR laser has improved peptide and protein sensitivity by greater than an order of magnitude.
Figure 3.
IR-ELDI-MS limit of detection for peptides and proteins. ELDI mass spectra from (A) 0.5 μL of 0.5 μM (250 fmol) of bradykinin with S/N 20, (B) 0.5 μL of 1 μM (500 fmol) of carbonic anhydrase with S/N 3, and (C) 1 μL of 0.1 μM (100 fmol) of ubiquitin. (A) and (B) were acquired using an LTQ linear ion trap, while (C) was acquired using anLTQ-OrbiTrap.
IR-ELDI versus atmospheric pressure infrared laser desorption ionization (IR-LDI)
Atmospheric pressure MALDI (AP-MALDI) using a UV laser has been reported with commercially available mass spectrometers, such as ion trap instruments.34 However, AP-MALDI appears to be limited to peptide analysis because the detection of singly charged protein ions requires a high mass-to-charge ratio (m/z) range mass spectrometer.34, 35 AP-MALDI was also shown to have a lower ionization efficiency compared to vacuum-MALDI.35 With the addition of ESI post-ionization of the laser-desorbed neutral molecules to generate multiply charged ions,36 we believe that IR-ELDI is superior to AP-MALDI or IR-LDI for peptide and protein analysis.
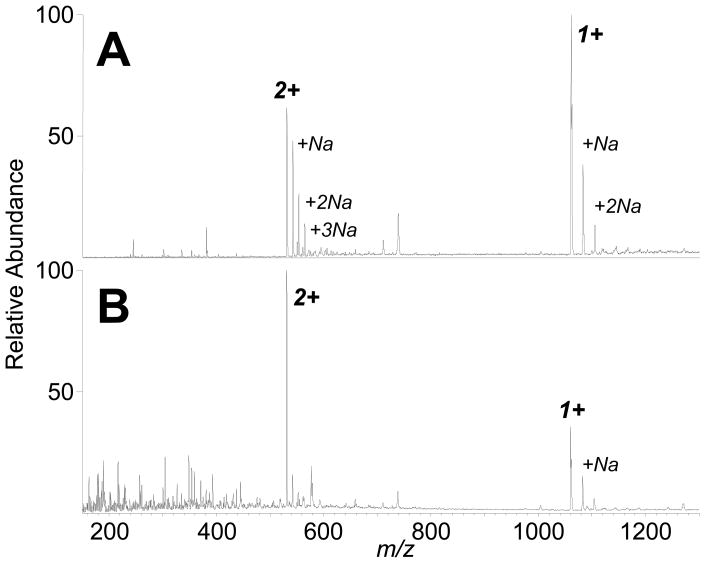
To determine the advantage of the ESI post-ionization step, bradykinin aqueous solutions were analyzed using our ambient ELDI platform, with and without the operation of the ESI sprayer. Figure 4 shows the IR-LDI (i.e., ESI is off) and IR-ELDI mass spectra from 50 pmol of bradykinin collected under similar conditions. Previous studies have shown that IR-MALDI has a lower sensitivity compared to UV-MALDI, as using an IR laser yields a lower ionization efficiency (and IR-MALDI generates many more neutral particles).37 In our experiments, IR-LDI-MS showed both singly- and doubly-charged bradykinin ions (Figure 4A), as IR-MALDI tends to generate more multiply charged ions than does UV-MALDI.38 (It should also be noted that the sample stage in commercial AP-MALDI sources is faced directly in front of the MS inlet only a few millimeters away, i.e., our IR-LDI experiment may not be optimal for best sensitivity.) Besides the 1+ and 2+ bradykinin ions, up to 3 sodium ion adducts to the bradykinin molecules were also detected. (Sodium ions may have originated from contaminants on the stainless steel sample surface and/or other surfaces that the analyte had come into contact, e.g., pipette tips, sample tubes, etc.) In the IR-ELDI experiment, in which the ESI source is operating to post-ionize the neutral bradykinin molecules desorbed by the IR laser, the 2+-charged ion becomes the more abundant species in the mass spectrum, and the intensity of the 2+-charged peak at m/z 531 is 20 times the intensity observed in the IR-LDI mass spectrum (Figure 4B). These data suggest that with the higher IR ablation power for sample desorption, IR-LDI can generate multiply charged ions directly even without the assistance of electrospray. However, in the IR-ELDI experiment, the major component of the signal results from laser desorption of neutral components, followed byelectrospray post-ionization.
Figure 4.
IR-LDI and IR-ELDI mass spectra from 1 μL of 50 μM bradykinin. (A) IR-LDI mass spectrum yields a signal intensity of 1.4 × 10² for the 1+ ion (m/z 1060), and 8.0 × 101 for the 2+ ion (m/z 531). (B) The IR-ELDI spectrum shows asignal intensity of 5.3 × 10² for the 1+ ion, and 1.5 × 10³ for the 2+ ion.
Top-down IR-ELDI-MSn of proteins
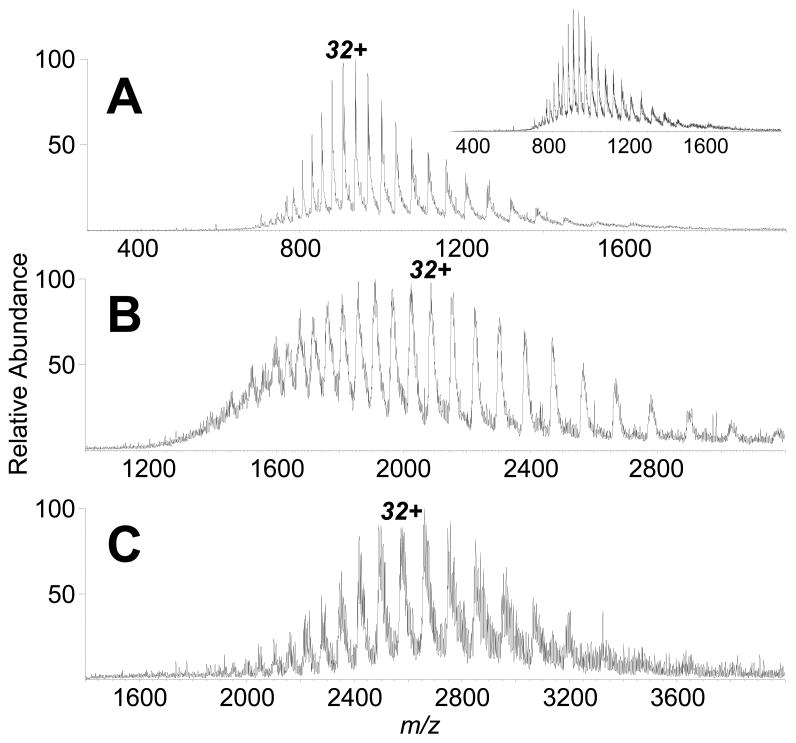
The new IR-ELDI-MS platform has shown to be amenable to a range of standard peptides and proteins, including 1 kDa bradykinin, 5.8 kDa human insulin, 8.6 kDa bovine ubiquitin, 12 kDa equine heart cytochrome c, 17 kDa equine heart myoglobin, 29 kDa bovine carbonic anhydrase, 66 kDa bovine serum albumin (BSA), and up to 80 kDa transferrin (see Supplementary Figure 2 for additional IR-ELDI mass spectra). Figure 5 shows the IR-ELDI mass spectra for carbonic anhydrase, BSA, and transferrin. The mass spectra were acquired directly from protein aqueous solutions, and without the presence of a conventional MALDI matrix. The charge state distribution for each protein is very similar to that observed in a conventional ESI mass spectrum (Figure 5 inset). No fragments from the proteins were detected, consistent for a soft ionization method. The 80 kDa transferrin protein represents the largest protein desorbed/analyzed intact by any laser-based atmospheric pressure MS system.
Figure 5.
IR-ELDI mass spectra from (A) 1 μL of 200 μM bovine carbonic anhydrase, (B) 1 μL of 500 μM bovine serum albumin, and (C) 1 μL of 500 μM transferrin applied on-target. The inset shows an ESI mass spectrum for a solution of 10 μM bovine carbonic anhydrase in 50% acetonitrile and 0.1% formic acid (v/v).
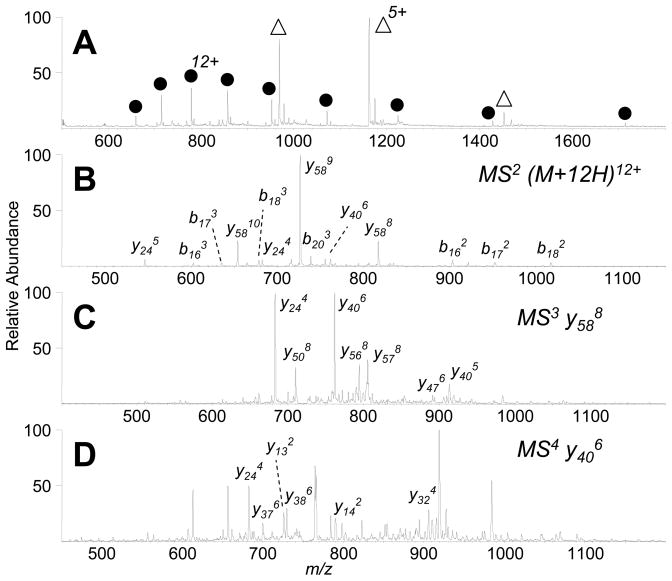
Tandem MS top-down experiments have been shown to be compatible with IR-ELDI for medium-sized proteins, such as ubiquitin (Figure 6) and carbonic anhydrase (Figure 7). Figure 6A shows the IR-ELDI mass spectrum of a mixture of ubiquitin and insulin. CAD tandem MS analysis of 12+-charged ubiquitin showed mostly multiply charged y- and b-product ions from the protein. Among the most abundant product ions are y58, which results from the cleavage of the amide bond N-terminal to Pro-19 (Figure 6B). Further dissociation of the product ions in MS3 and MS4 experiments showed more detailed sequence information for the protein (Figures 6C and 6D).
Figure 6.
IR-ELDI-MS and MSn of bovine ubiquitin. (A) IR-ELDI-MS of a mixture of 2 μL ubiquitin (peaks labeled with ●) and insulin (peaks labeled with △), 100 μM and 300 μM, respectively. (B) MS2 analysis of the 12+ ubiquitin ion (m/z 714). (C) MS3 of y588 ion (m/z 817). (D) MS4 analysis of y406 ion (m/z 761).
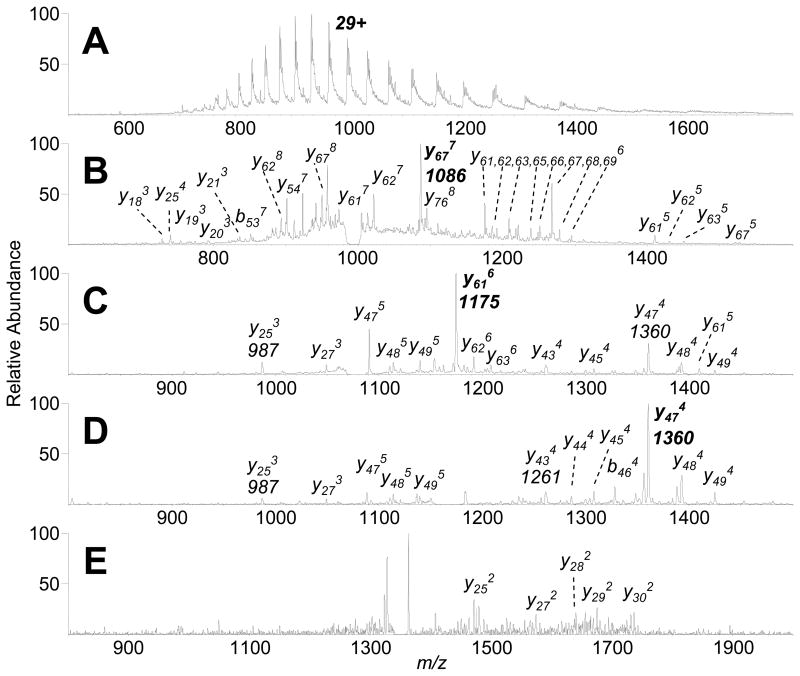
Figure 7.
IR-ELDI-MS and MSn of bovine carbonic anhydrase. (A) IR-ELDI-MS from 2 μL of 500 μM carbonic anhydrase solution. (B) MS2 analysis of the 29+ carbonic anhydrase ion (m/z 1001). (C) MS3 analysis of y677 ion (m/z 1086). (D) MS4 of y616 ion (m/z 1175). (E) MS5 of y474 ion (m/z 1360).
For 29 kDa carbonic anhydrase, the IR-ELDI-MS spectrum shows a multiple charge distribution similar to that measured by UV-ELDI-MS (Figure 7A).6 Tandem mass spectra of carbonic anhydrase were collected up to MS5. MS2 of the 29+-charged intact protein showed mostly multiply charged y-product ions, with y67 and y61 from the cleavage of the N-terminal amide bonds to Pro-193 and Pro-199, respectively, as the most abundant product ions (Figure 7B), consistent with the previously reported ESI-MSn data for carbonic anhydrase.39 MS3 of the 7598 Da y677+ ion shows y-products not observed from CAD of the intact protein, in addition to an abundant y616+ ion (Figure 7C). Fragmenting the 7042 Da y616+ ion showed again mainly y-ions, including an abundant y474+ from cleavage of the Glu-212/Pro-213 amide bond (Figure 7D). Further dissociation of the y474+ ion produced doubly charged y25 to y30 ions (Figure 7E). The higher sensitivity afforded by IR laser desorption allowed more stages of MS/MS to MS5 to be collected for protein sequencing experiments.
These MSn data demonstrate that IR-ELDI generates multiply charged molecules that can be effectively dissociated for top-down proteomic studies. Sequence-informative product ions for protein identification can be generated from large multiply charged protein molecules by the traditionally-employed CAD technique, and potentially by new dissociation methods, such as ECD and ETD, that are also useful for characterizing post-translational modifications.
Experimental
Sample preparation for IR-ELDI-MS
All peptides and proteins, and formic acid (FA) were purchased from Sigma-Aldrich (St. Louis, MO, USA). HPLC-grade acetonitrile (ACN) was from EMD Chemicals (Gibbstown, NJ, USA). All materials were used as received without further purification.
For the ELDI-MS experiments, the ESI solvent was prepared by mixing 1:1 v/v of ACN/deionized (DI) water with 0.2% formic acid, and electrospraying at a flow rate of 1 μL min−1. Peptide and protein samples were prepared by dissolving in DI water, and deposited on the target as a liquid drop (0.5–2 μL). No UV MALDI matrix was added for the IR-ELDI experiments. Most IR-ELDI mass spectra were acquired immediately after analyte solutions were deposited on the sample stage before the sample was dried.
IR-ELDI source and mass spectrometer
The ELDI platform, similar to that previously reported,2, 6 includes a laser to desorb molecules from the samples deposited on a stainless steel target mounted to an x-y-z translational stage, and an ESI source to generate charged solvent droplets (Figure 1). A high voltage supply is used to apply 2–5 kV to the ESI tip to generate a stable electrospray for positive ion mass spectra.
Compared to our UV-ELDI platform, the most significant change is the IR-laser. A tunable OPO laser (Opotek Inc., Carlsbad, CA, USA) was used to generate infrared irradiation. The OPO laser is pumped by a 1064 nm Nd:YAG laser. The tuning range of the laser is 2700–3100 nm, and the peak pulse energy is 2.5 mJ operating at 20 Hz. The laser and the optics were mounted on a 2-ft × 2-ft breadboard supported on a movable cart. Metal coated mirrors and a 40 mm CaF2 focusing lens were used to direct the IR light to the target. A 650 nm diode laser was aligned co-linear to the mid-IR laser output for laser alignment and visualization. The sample stage and the electrospray source were mounted on x-y-z stages as well as the focusing lens for complete control. The IR laser beam was focused to a spot size of 0.4 mm and attenuated to 0.15 mJ per laser pulse, resulting in a laser fluence of 0.12 J cm−2. Most of the mass spectra were acquired using either 2740 nm (strong water vapor absorption line) or 2940 nm (max absorption for bulk liquid water) IR-irradiation. The incident angle of the laser was fixed at 90° to the sample target (Figure 1B).
IR-ELDI mass spectra were acquired using a Thermo LTQ-ETD linear ion trap mass spectrometer or a Thermo LTQ-OrbiTrap XL couple with ETD mass spectrometer (Thermo Fisher Scientific, San Jose, CA, USA). Tandem MS spectra were acquired by fragmenting the isolated precursor ions by CAD using helium as the collision gas.
Conclusions
Our preliminary data demonstrate that IR-ELDI, similar to UV-ELDI, is a soft ionization method for MS measurements of peptides and proteins under ambient sampling conditions, and generates multiply charged molecules. The limit of detection of IR-ELDI-MS is approximately 100 fmol for small polypeptides; this detection limit is currently superior to that demonstrated by similar methods. IR-ELDI-MS is amenable to analytes in either the dried or wet forms, without the addition of a conventional MALDI matrix. However, analytes in solution show a 100-fold enhancement in sensitivity because of water’s strong absorption in the mid-infrared region. Other experimental factors, such as the incident angle of the laser, intensity of the laser, wavelength, and ESI flow rate may also effect the measurement and will be investigated in future experiments. Compared to UV-ELDI, IR-ELDI has better sensitivity for larger proteins. The generation of multiply charged proteins not only extends the mass range of the MS measurement, but also allows ready access to the advantages of tandem mass spectrometry for producing sequence-informative product ions for both bottom-up and top-down mass spectrometry protein identification strategies.40
Further improvement in sensitivity is required before IR-ELDI can be applied for routine MS and MS/MS measurements. However, the technique, as well as related methods, may already contribute to numerous potential applications. In the IR-ELDI process, proteins are desorbed and ionized under ambient conditions, which avoids many inconvenient limitations related to the vacuum sampling required for traditional MALDI, and allows vacuum-sensitive samples, such as tissues or gels (i.e., from 1D-and 2D-gel electrophoresis experiments41), to be examined without adverse effects. Sample preparation by application of a solution containing a MALDI matrix, which may result in the re-distribution of the analytes in the tissue, should not be necessary for IR-ELDI-MS. Interfacing with other sampling devices, such as those offered from microfluidic-based separation methods,42, 43 should be easily addressed by ELDI-MS.
Supplementary Material
Acknowledgments
The W. M. Keck Foundation is acknowledged for the establishment of the UCLA Functional Proteomics Center. The project is supported by the NIH through the SBIR program (grant R43 RR026171 to E.M.).
Footnotes
This paper is part of an <it>Analyst</it> themed issue on Ambient Mass Spectrometry, with guest editors Xinrong Zhang and Zheng Ouyang.
References
- 1.Shiea J, Huang MZ, HSu HJ, Lee CY, Yuan CH, Beech I, Sunner J. Rapid Commun Mass Spectrom. 2005;19:3701–3704. doi: 10.1002/rcm.2243. [DOI] [PubMed] [Google Scholar]
- 2.Peng IX, Shiea J, Ogorzalek Loo RR, Loo JA. Rapid Commun Mass Spectrom. 2007;21:2541–2546. doi: 10.1002/rcm.3154. [DOI] [PubMed] [Google Scholar]
- 3.Karas M, Hillenkamp F. Anal Chem. 1988;60:2299–2301. doi: 10.1021/ac00171a028. [DOI] [PubMed] [Google Scholar]
- 4.Tanaka K, Waki H, Ido Y, Akita S, Yoshida Y, Yoshida T. Rapid Commun Mass Spectrom. 1988;2:151–153. [Google Scholar]
- 5.Fenn JB, Mann M, Meng CK, Wong SF, Whitehouse CM. Science. 1989;246:64–71. doi: 10.1126/science.2675315. [DOI] [PubMed] [Google Scholar]
- 6.Peng IX, Ogorzalek Loo RR, Shiea J, Loo JA. Anal Chem. 2008;80:6995–7003. doi: 10.1021/ac800870c. [DOI] [PubMed] [Google Scholar]
- 7.Conzemius RJ, Capellen JM. Int J Mass Spectrom Ion Proc. 1980;34:197–271. [Google Scholar]
- 8.Kolaitis L, Lubman DM. Anal Chem. 1986;58:2137–2142. [Google Scholar]
- 9.Takats Z, Wiseman JM, Gologan B, Cooks RG. Science. 2004;306:471–473. doi: 10.1126/science.1104404. [DOI] [PubMed] [Google Scholar]
- 10.Wiseman JM, Puolitaival SM, Takats Z, Cooks RG, Caprioli RM. Angew Chem Int Ed. 2005;44:7094–7097. doi: 10.1002/anie.200502362. [DOI] [PubMed] [Google Scholar]
- 11.Sampson JS, Hawkridge AM, Muddiman DC. J Am Soc Mass Spectrom. 2006;17:1712–1716. doi: 10.1016/j.jasms.2006.08.003. [DOI] [PubMed] [Google Scholar]
- 12.Rezenom YH, Dong J, Murray KK. Analyst. 2008;133:226–232. doi: 10.1039/b715146b. [DOI] [PubMed] [Google Scholar]
- 13.Nemes P, Vertes A. Anal Chem. 2007;79:8098–8106. doi: 10.1021/ac071181r. [DOI] [PubMed] [Google Scholar]
- 14.Huang MZ, Hsu HJ, Wu CI, Lin SY, Ma YL, Cheng TL, Shiea J. Rapid Commun Mass Spectrom. 2007;21:1767–1775. doi: 10.1002/rcm.3011. [DOI] [PubMed] [Google Scholar]
- 15.Lin SY, Huang MZ, Chang HC, Shiea J. Anal Chem. 2007;79:8789–8795. doi: 10.1021/ac070590k. [DOI] [PubMed] [Google Scholar]
- 16.Huang MZ, Hsu HJ, Lee LY, Jeng JY, Shiea J. J Proteome Res. 2006;5:1107–1116. doi: 10.1021/pr050442f. [DOI] [PubMed] [Google Scholar]
- 17.Loo JA, Edmonds CG, Smith RD. Science. 1990;248:201–204. doi: 10.1126/science.2326633. [DOI] [PubMed] [Google Scholar]
- 18.Zubarev RA, Horn DM, Fridriksson EK, Kelleher NL, Kruger NA, Lewis MA, Carpenter BK, McLafferty FW. Anal Chem. 2000;72:563–573. doi: 10.1021/ac990811p. [DOI] [PubMed] [Google Scholar]
- 19.Syka JE, Coon JJ, Schroeder MJ, Shabanowitz J, Hunt DF. Proc Natl Acad Sci USA. 2004;101:9528–9533. doi: 10.1073/pnas.0402700101. [DOI] [PMC free article] [PubMed] [Google Scholar]
- 20.Little DP, Speir JP, Senko MW, O’Connor PB, McLafferty FW. Anal Chem. 1994;66:2809–2815. doi: 10.1021/ac00090a004. [DOI] [PubMed] [Google Scholar]
- 21.Loo JA, Edmonds CG, Smith RD. Anal Chem. 1991;63:2488–2499. doi: 10.1021/ac00021a018. [DOI] [PubMed] [Google Scholar]
- 22.Peng IX, Ogorzalek Loo RR, Shiea J, Loo JA. 56th ASMS Conference on Mass Spectrometry and Allied Topics; Denver, CO, USA. 2008. [Google Scholar]
- 23.Shiea J, Yuan CH, Huang MZ, Cheng SC, Ma YL, Tseng WL, Chang HC, Hung WC. Anal Chem. 2008;80:4845–4852. doi: 10.1021/ac702108t. [DOI] [PubMed] [Google Scholar]
- 24.Sampson JS, Hawkridge AM, Muddiman DC. J Am Soc Mass Spectrom. 2008;19:1527–1534. doi: 10.1016/j.jasms.2008.06.013. [DOI] [PMC free article] [PubMed] [Google Scholar]
- 25.Overberg A, Karas M, Bahr U, Kaufmann R, Hillenkamp F. Rapid Commun Mass Spectrom. 1990;4:293–296. [Google Scholar]
- 26.Berkenkamp S, Karas M, Hillenkamp F. Proc Natl Acad Sci USA. 1996;93:7003–7007. doi: 10.1073/pnas.93.14.7003. [DOI] [PMC free article] [PubMed] [Google Scholar]
- 27.Menzel D, Dreisewerd K, Berkenkamp S, Hillenkamp F. Int J Mass Spectrom. 2001;207:73–96. doi: 10.1002/1096-9888(200011)35:11<1320::AID-JMS66>3.0.CO;2-S. [DOI] [PubMed] [Google Scholar]
- 28.Talrose VL, Person MD, Whittal RM, Walls FC, Burlingame AL, Baldwin MA. Rapid Commun Mass Spectrom. 1999;13:2191–2198. doi: 10.1002/(SICI)1097-0231(19991115)13:21<2191::AID-RCM774>3.0.CO;2-I. [DOI] [PubMed] [Google Scholar]
- 29.Wiseman JM, Ifa DR, Song Q, Cooks RG. Angew Chem Int Ed. 2006;45:7188–7192. doi: 10.1002/anie.200602449. [DOI] [PubMed] [Google Scholar]
- 30.Nemes P, Barton AA, Li Y, Vertes A. Anal Chem. 2008;80:4575–4582. doi: 10.1021/ac8004082. [DOI] [PubMed] [Google Scholar]
- 31.Sampson JS, Murray KK, Muddiman DC. J Am Soc Mass Spectrom. 2009;20:667–673. doi: 10.1016/j.jasms.2008.12.003. [DOI] [PMC free article] [PubMed] [Google Scholar]
- 32.Little MW, Laboy J, Murray KK. J Phys Chem C. 2007;111:1412–1416. [Google Scholar]
- 33.Laiko VV, Taranenko NI, Berkout VD, Yakshin MA, Prasad CR, Lee HS, Doroshenko VM. J Am Soc Mass Spectrom. 2002;13:354–361. doi: 10.1016/s1044-0305(02)00341-0. [DOI] [PubMed] [Google Scholar]
- 34.Laiko VV, Moyer SC, Cotter RJ. Anal Chem. 2000;72:5239–5243. doi: 10.1021/ac000530d. [DOI] [PubMed] [Google Scholar]
- 35.Laiko VV, Baldwin MA, Burlingame AL. Anal Chem. 2000;72:652–657. doi: 10.1021/ac990998k. [DOI] [PubMed] [Google Scholar]
- 36.Wu C, Siems WF, Hill HH. Anal Chem. 2000;72:396–403. doi: 10.1021/ac9907235. [DOI] [PubMed] [Google Scholar]
- 37.Dreisewerd K, Berkenkamp S, Leisner A, Rohlfing A, Menzel D. Int J Mass Spectrom. 2003;226:189–209. [Google Scholar]
- 38.Niu S, Zhang W, Chait BT. J Am Soc Mass Spectrom. 1998;9:1–7. doi: 10.1016/S1044-0305(97)00236-5. [DOI] [PubMed] [Google Scholar]
- 39.Loo JA, Ogorzalek Loo RR, Andrews PC. Org Mass Spectrom. 1993;28:1640–1649. [Google Scholar]
- 40.Kelleher NL. Anal Chem. 2004;76:197A–203A. [PubMed] [Google Scholar]
- 41.Ogorzalek Loo RR, Mitchell C, Stevenson TI, Martin SA, Hines WM, Juhasz P, Patterson DH, Peltier JM, Loo JA, Andrews PC. Electrophoresis. 1997;18:382–390. doi: 10.1002/elps.1150180312. [DOI] [PubMed] [Google Scholar]
- 42.Wheeler AR, Moon H, Kim CJ, Loo JA, Garrell RL. Anal Chem. 2004;76:4833–4838. doi: 10.1021/ac0498112. [DOI] [PubMed] [Google Scholar]
- 43.Wheeler AR, Moon H, Bird CA, Loo RR, Kim CJ, Loo JA, Garrell RL. Anal Chem. 2005;77:534–540. doi: 10.1021/ac048754+. [DOI] [PubMed] [Google Scholar]
Associated Data
This section collects any data citations, data availability statements, or supplementary materials included in this article.


