

Abstract
DNA-binding transcriptional regulators interpret the genome's regulatory code by binding to specific sequences to induce or repress gene expression1. Comparative genomics has recently been used to identify potential cis-regulatory sequences within the yeast genome on the basis of phylogenetic conservation2–6, but this information alone does not reveal if or when transcriptional regulators occupy these binding sites. We have constructed an initial map of yeast's transcriptional regulatory code by identifying the sequence elements that are bound by regulators under various conditions and that are conserved among Saccharomyces species. The organization of regulatory elements in promoters and the environment-dependent use of these elements by regulators are discussed. We find that environment-specific use of regulatory elements predicts mechanistic models for the function of a large population of yeast's transcriptional regulators.
We used genome-wide location analysis7–10 to determine the genomic occupancy of 203 DNA-binding transcriptional regulators in rich media conditions and, for 84 of these regulators, in at least 1 of 12 other environmental conditions (Supplementary Table 1, Supplementary Fig. 1; http://web.wi.mit.edu/young/regulatory_code). These 203 proteins are likely to include nearly all of the DNA-binding transcriptional regulators encoded in the yeast genome. Regulators were selected for profiling in an additional environment if they were essential for growth in that environment or if there was other evidence implicating them in the regulation of gene expression in that environment. The genome-wide location data identified 11,000 unique interactions between regulators and promoter regions at high confidence (P ≤ 0.001).
To identify the cis-regulatory sequences that are likely to serve as recognition sites for transcriptional regulators, we merged information from genome-wide location data, phylogenetically conserved sequences, and prior knowledge (Fig. 1a). We used six motif discovery methods11–13 to discover 68,279 DNA sequence motifs for the 147 regulators that bound more than ten probes (Supplementary Methods, Supplementary Fig. 2). From these motifs we derived the most likely specificity for each regulator through clustering and stringent statistical tests. This motif discovery process identified highly significant (P ≤ 0.001) motifs for each of 116 regulators. We determined a single high-confidence motif for 65 of these regulators by using additional criteria including the requirement for conservation across three of four related yeast species. Examples of discovered and rediscovered motifs are depicted in Fig. 1b, and comparisons of the discovered motifs with those described previously are shown in Supplementary Table 2. The discovered motifs provide significantly more information than was previously available; for 21 of the regulators there was no prior specificity information in the literature, and detailed probability matrices had previously been determined for only 17 regulators for which we report motifs14. For Cin5, which showed the largest difference between the computationally derived motif (TTACRTAA) and the previously reported site (TTACTAA; Supplementary Table 2), we found that the motif we report is also the preferred target in vitro (Supplementary Fig. 3). We supplemented the discovered motifs with additional motifs from the literature that also passed conservation tests, and we used this compendium of sequence motifs for 102 regulators (Supplementary Table 3) in all subsequent analysis.
Figure 1.
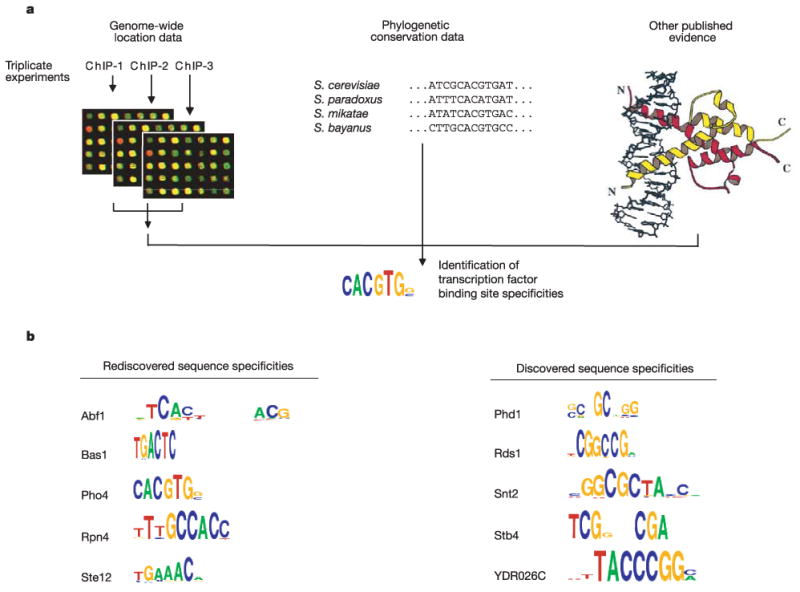
Discovering binding-site specificities for yeast transcriptional regulators. a, Cis-regulatory sequences likely to serve as recognition sites for transcriptional regulators were identified by combining information from genome-wide location data, phylogenetically conserved sequences and previously published evidence, as described in Supplementary Methods. The compendium of regulatory sequence motifs can be found in Supplementary Table 3. b, Selected sequence specificities that were rediscovered and were newly discovered are shown. The total height of the column is proportional to the information content of the position, and the individual letters have a height proportional to the product of their frequency and the information content30.
We constructed an initial version of the transcriptional regulatory code by mapping on the yeast genome sequence the motifs that are bound by regulators at high confidence (P ≤ 0.001) and that are conserved among sensu stricto Saccharomyces species (Fig. 2; http://web.wi.mit.edu/fraenkel/regulatory_map). This map includes 3,353 interactions within 1,296 promoter regions. Maps of regulatory sites encompassing larger numbers of promoters, constructed with lower-confidence information, can also be viewed on the authors' website. Because the information used to construct the map includes binding data from multiple growth environments, the map describes transcriptional regulatory potential within the genome. During growth in any one environment, only subsets of the binding sites identified in the map are occupied by transcriptional regulators, as we describe in more detail below.
Figure 2.

Drafting the yeast transcriptional regulatory map. a, Portions of chromosomes illustrating locations of genes (grey rectangles) and conserved DNA sequences (coloured boxes) bound in vivo by transcriptional regulators. b, Combining binding data and sequence conservation data. The diagram depicts all sequences matching a motif from our compendium (top), all such conserved sequences (middle) and all such conserved sequences bound by a regulator (bottom). c, Regulator binding site distribution. The red line shows the distribution of distances from the start codon of open reading frames to binding sites in the adjacent upstream region. The green line represents a randomized distribution.
Where the functions of specific transcriptional regulators were established previously, the functions of the genes they bind in the regulatory map are highly consistent with this prior information. For example, the amino-acid biosynthetic regulators Gcn4 and Leu3 bind to sites in the promoter of BAP2 (chromosome II), which encodes an amino-acid transporter (Fig. 2a). Six well-studied cell cycle transcriptional regulators bind to the promoter for YHP1 (chromosome IV), which has been implicated in the regulation of the G1 phase of the cell cycle. The regulator of respiration Hap5 binds upstream of COX4 (chromosome VII), which encodes a component of the respiratory electron transport chain. Where regulators with established functions bind to genes of unknown function, these target genes are newly implicated in such functional processes.
The utility of combining regulator binding data and sequence conservation data is illustrated in Fig. 2b. All sequences matching the regulator DNA binding specificities described in this study (Supplementary Table 3) that occur within the 884-base-pair intergenic region upstream of the gene BAP2 are shown in the upper panel. The subset of these sequences that have been conserved in multiple yeast species, and are therefore likely candidates for regulator interactions, is shown in the middle panel of Fig. 2b. The presence of these conserved regulatory sites indicates the potential for regulation through this sequence but does not indicate whether the site is actually bound by a regulator under some growth condition. The incorporation of binding information (Fig. 2b, bottom panel) identifies those conserved sequences that are used by regulators in cells grown under the conditions examined.
The distribution of binding sites for transcriptional regulators reveals constraints on the organization of these sites in yeast promoters (Fig. 2c). Binding sites are not uniformly distributed over the promoter regions but instead show a sharply peaked distribution. Very few sites are located in the region 100 base pairs (bp) upstream of protein-coding sequences. This region typically includes the transcription start site and is bound by the transcription initiation apparatus. The vast majority (74%) of the transcriptional regulator binding sites lie between 100 and 500 bp upstream of the protein-coding sequence, far more than would be expected at random (53%). Regions further than 500 bp upstream contain fewer binding sites than would be expected at random. It seems that yeast transcriptional regulators function at short distances along the linear DNA, a property that reduces the potential for inappropriate activation of nearby genes.
We note that specific arrangements of DNA binding sites occur within promoters, and we suggest that these promoter architectures provide clues to regulatory mechanisms (Fig. 3). For example, the presence of a DNA binding site for a single regulator is the simplest promoter architecture and, as might be expected, we found that sets of genes with this feature are often involved in a common biological function (Supplementary Table 4). A second type of promoter architecture consists of repeats of a particular binding site sequence. Repeated binding sites have been shown to be necessary for stable binding by the regulator Dal80 (ref. 15). This repetitive promoter architecture can also permit a graded transcriptional response, as has been observed for the HIS4 gene16. Several regulators, including Dig1, Mbp1 and Swi6, show a statistically significant preference for repetitive motifs (Supplementary Table 5). A third class of promoter contains binding sites for multiple different regulators. This promoter arrangement implies that the gene might be subject to combinatorial regulation, and we expect that in many cases the various regulators can be used to execute differential responses to varied growth conditions. Indeed, we note that many of the genes in this category encode products that are required for multiple metabolic pathways and are regulated in an environment-specific fashion. In the fourth type of promoter architecture we discuss here, binding sites for specific pairs of regulators occur more frequently within the same promoter regions than would be expected by chance (Supplementary Table 6). This ‘co-occurring’ motif architecture implies that the two regulators interact physically or have related functions at multiple genes.
Figure 3.

Yeast promoter architectures: single regulator architecture, promoter regions that contain one or more copies of the binding site sequence for a single regulator; repetitive motif architecture, promoter regions that contain multiple copies of a binding site sequence of a regulator; multiple regulator architecture, promoter regions that contain one or more copies of the binding site sequences for more than one regulator; co-occurring regulator architecture, promoters that contain binding site sequences for recurrent pairs of regulators. For the purposes of illustration, not all sites are shown and the scale is approximate. Additional information can be found in Supplementary Tables 4–6.
By conducting genome-wide binding experiments for some regulators under multiple cell-growth conditions, we learned that regulator binding to a subset of the regulatory sequences is highly dependent on the environmental conditions of the cell (Supplementary Fig. 4). We observed four common patterns of regulator binding behaviour (Fig. 4, Supplementary Table 7). Prior information about the regulatory mechanisms employed by well-studied regulators in each of the four groups suggests hypotheses to account for the environment-dependent binding behaviour of the other regulators.
Figure 4.

Environment-specific use of the transcriptional regulatory code. Four patterns of genome-wide binding behaviour are depicted on the left, where transcriptional regulators are represented by coloured circles and are placed above and below a set of target genes/promoters. The lines between the regulators and the target genes/promoters represent binding events. Specific examples of the environment-dependent behaviours are depicted on the right. Coloured circles represent regulators and coloured boxes represent their DNA binding sequences within specific promoter regions. We note that regulators might exhibit different behaviours when different pairs of conditions are compared.
‘Condition-invariant’ regulators bind essentially the same set of promoters (within the limitations of noise) in two different growth environments (Fig. 4). Leu3, which is known to regulate genes involved in amino-acid biosynthesis, is among the best studied of the regulators in this group. Binding of Leu3 in vivo has been shown to be necessary but not sufficient for the activation of Leu3-regulated genes17. Rather, regulatory control of these genes requires the association of a leucine metabolic precursor with Leu3 to convert it from a negative to a positive regulator. We note that other zinc cluster type regulators that show ‘condition-invariant’ behaviour are known to be regulated in a similar manner18,19. It is therefore reasonable to propose that the activation or repression functions of some of the other regulators in this class have requirements in addition to DNA binding.
‘Condition-enabled’ regulators do not bind the genome detectably under one condition, but bind a substantial number of promoters with a change in environment. Msn2 is among the best-studied regulators in this class, and the mechanisms involved in Msn2-dependent transcription provide clues to how the other regulators in that class might operate. Msn2 is excluded from the nucleus when cells grow in the absence of stresses but accumulates rapidly in the nucleus when cells are subjected to stress20,21. This condition-enabled behaviour was also observed for the thiamine biosynthetic regulator Thi2, the nitrogen regulator Gat1 and the developmental regulator Rim101. We suggest that many of these transcriptional regulators are regulated by nuclear exclusion or by another mechanism that would cause this extreme version of condition-specific binding.
‘Condition-expanded’ regulators bind to a core set of target promoters under one condition but bind an expanded set of promoters under another condition. Gcn4 is the best-studied of the regulators that fall into this ‘expanded’ class. The levels of Gcn4 are reported to increase sixfold when yeast cells are introduced into media with limiting nutrients22, owing largely to increased nuclear protein stability21,23, and under this condition we find that Gcn4 binds to an expanded set of genes. The probes bound when Gcn4 levels are low contain better matches to the known Gcn4-binding site than probes that are bound exclusively at higher protein concentrations, which is consistent with a simple model for specificity based on intrinsic protein affinity and protein concentration (Supplementary Fig. 5). The expansion of binding sites by many of the regulators in this class might reflect increased levels of the regulator available for DNA binding.
‘Condition-altered’ regulators exhibit an altered preference for the set of promoters bound in two different conditions. Ste12 is the best-studied of the regulators whose binding behaviour falls into this ‘altered’ class. Depending on the interactions with other regulators, the specificity of Ste12 can change and alter its cellular function24. For example, under filamentous growth conditions, Ste12 interacts with Tec1, which has its own DNA-binding specificity25. This condition-altered behaviour was also observed for the transcriptional regulators Aft2, Skn7 and Ume6. We propose that the binding specificity of many of the transcriptional regulators might be altered through interactions with other regulators or through modifications (such as chemical) that are dependent on environment.
Substantial portions of eukaryotic genome sequence are believed to be regulatory2,3,26, but the DNA sequences that actually contribute to regulation of genome expression have been ill-defined. By mapping the DNA sequences bound by specific regulators in various environments, we identify the regulatory potential embedded in the genome and provide a framework for modelling the mechanisms that contribute to global gene expression. We expect that the approaches used here to map regulatory sequences in yeast can also be used to map the sequences that control genome expression in higher eukaryotes.
Methods
Strain information
For each of the 203 regulators, strains were generated in which a repeated Myc-epitope-coding sequence was integrated into the endogenous gene encoding the regulator. Polymerase chain reaction (PCR) constructs containing the Myc-epitope-coding sequence and a selectable marker flanked by regions of homology to either the 5′ or 3′ end of the targeted gene were transformed into the W303 yeast strain Z1256 (refs 8, 9). Genomic integration and expression of the epitope-tagged protein were confirmed by PCR and western blotting, respectively.
Genome-wide location analysis
Genome-wide location analysis was performed as described previously8,9. Bound proteins were crosslinked by formaldehyde to DNA in vivo, followed by cell lysis and sonication to shear DNA. Crosslinked material was immunoprecipitated with an anti-Myc antibody, followed by reversal of the crosslinks to separate DNA from protein. Immunoprecipitated DNA and DNA from an unenriched sample were amplified and differentially fluorescently labelled by ligation-mediated PCR. These samples were hybridized to a microarrray consisting of spotted PCR products representing the intergenic regions of the Saccharomyces cerevisiae genome. Relative intensities of spots were used as the basis for an error model that assigns a probability score (P) to binding interactions. All microarray data are available from ArrayExpress and from the authors' website (http://web.wi.mit.edu/young/regulatory_code).
Growth environments
We profiled all 203 regulators in rich medium. In addition, we profiled 84 regulators in at least one other environmental condition. The list of regulators is given in Supplementary Table 1.
Regulator binding specificity
The putative specificities of regulators were identified by applying a suite of motif discovery programs to the intergenic sequences identified by the binding data. The resulting specificity predictions were filtered for significance with uniform metrics and then clustered to yield representative motifs (Supplementary Fig. 2).
We used six methods to identify the specific sequences bound by regulators: AlignACE11, MEME13, MDscan12, the method in ref. 2 and two additional new methods that incorporate conservation data: MEME_c and CONVERGE. MEME_c uses the existing MEME program without change but applies it to a modified set of sequences in which bases that are not conserved in the sensu stricto Saccharomyces species were replaced with the letter ‘N’. CONVERGE is a novel expectation-maximization (EM)-based algorithm for discovering specificities by using sequence information from multiple genomes. Rather than searching for sites that are identical across the sensu stricto species, as occurs with MEME_c, CONVERGE searches for loci at which all aligned sequences are consistent with the same specificity model. See Supplementary Methods for runtime parameters and additional details for all of these methods.
Each of the programs we used attempts to measure the significance of its results with one or more statistical scores. However, we observed that these programs report results with high scores even when applied to random selections of intergenic regions. To distinguish the true motifs we chose a set of statistical measures that are described in Supplementary Methods and converted these scores into the empirical probability that a motif with a similar score could be found by the same program in randomly selected sequences. To estimate these P values we ran each program 50 times on randomly selected sets of sequences of various sizes. We accepted only those motifs that were judged to be significant by these scores (P ≤ 0.001).
Significant motifs from all programs were pooled and clustered with the use of a k-medoids algorithm. Aligned motifs within each cluster were averaged to produce consensus motifs and filtered according to their conservation. This procedure typically produced several distinct consensus motifs for each regulator. To choose a single specificity for each regulator we compared the results with information in the TRANSFAC27, YPD28 and SCPD29 databases. When no prior information was available we chose the specificity with the most significant statistical score.
Regulatory code
Potential binding sites were included in the map of the regulatory code if they satisfied two criteria. First, a locus had to match the specificity model for a regulator in the S. cerevisiae genome and at least two other sensu stricto Saccharomyces genomes with a score of at least 60% of the maximum possible. Second, the locus had to lie in an intergenic region that also contained a probe bound by the corresponding regulator in any condition (P ≤ 0.001). All analyses of promoter architecture and environment-specific binding were based on this map and can be found in Supplementary Information.
Supplementary Material
Acknowledgments
We thank T. Ideker and S. McCuine for help in selecting regulators to study in environmental conditions; E. Herbolsheimer, G. Bell, R. Latek and F. Lewitter for computational assistance; and E. McReynolds for technical assistance. E.F. is a Whitehead Fellow and was funded in part by Pfizer. D.B.G. was supported by a NIH/NIGMS NRSA award. This work was supported by an NIH grant.
Footnotes
Supplementary Information accompanies the paper on www.nature.com/nature.
Competing interests statement The authors declare competing financial interests: details accompany the paper on www.nature.com/nature.
References
- 1.Jacob F, Monod J. Genetic regulatory mechanisms in the synthesis of proteins. J Mol Biol. 1961;3:318–356. doi: 10.1016/s0022-2836(61)80072-7. [DOI] [PubMed] [Google Scholar]
- 2.Kellis M, Patterson N, Endrizzi M, Birren B, Lander ES. Sequencing and comparison of yeast species to identify genes and regulatory elements. Nature. 2003;423:241–254. doi: 10.1038/nature01644. [DOI] [PubMed] [Google Scholar]
- 3.Cliften P, et al. Finding functional features in Saccharomyces genomes by phylogenetic footprinting. Science. 2003;301:71–76. doi: 10.1126/science.1084337. [DOI] [PubMed] [Google Scholar]
- 4.Pritsker M, Liu YC, Beer MA, Tavazoie S. Whole-genome discovery of transcription factor binding sites by network-level conservation. Genome Res. 2004;14:99–108. doi: 10.1101/gr.1739204. [DOI] [PMC free article] [PubMed] [Google Scholar]
- 5.Wang T, Stormo GD. Combining phylogenetic data with co-regulated genes to identify regulatory motifs. Bioinformatics. 2003;19:2369–2380. doi: 10.1093/bioinformatics/btg329. [DOI] [PubMed] [Google Scholar]
- 6.Blanchette M, Tompa M. FootPrinter: A program designed for phylogenetic footprinting. Nucleic Acids Res. 2003;31:3840–3842. doi: 10.1093/nar/gkg606. [DOI] [PMC free article] [PubMed] [Google Scholar]
- 7.Iyer VR, et al. Genomic binding sites of the yeast cell-cycle transcription factors SBF and MBF. Nature. 2001;409:533–538. doi: 10.1038/35054095. [DOI] [PubMed] [Google Scholar]
- 8.Ren B, et al. Genome-wide location and function of DNA binding proteins. Science. 2000;290:2306–2309. doi: 10.1126/science.290.5500.2306. [DOI] [PubMed] [Google Scholar]
- 9.Lee TI, et al. Transcriptional regulatory networks in Saccharomyces cerevisiae. Science. 2002;298:799–804. doi: 10.1126/science.1075090. [DOI] [PubMed] [Google Scholar]
- 10.Lieb JD, Liu X, Botstein D, Brown PO. Promoter-specific binding of Rap1 revealed by genome–wide maps of protein-DNA association. Nature Genet. 2001;28:327–334. doi: 10.1038/ng569. [DOI] [PubMed] [Google Scholar]
- 11.Roth FP, Hughes JD, Estep PW, Church GM. Finding DNA regulatory motifs within unaligned noncoding sequences clustered by whole-genome mRNA quantitation. Nature Biotechnol. 1998;16:939–945. doi: 10.1038/nbt1098-939. [DOI] [PubMed] [Google Scholar]
- 12.Liu XS, Brutlag DL, Liu JS. An algorithm for finding protein-DNA binding sites with applications to chromatin-immunoprecipitation microarray experiments. Nature Biotechnol. 2002;20:835–839. doi: 10.1038/nbt717. [DOI] [PubMed] [Google Scholar]
- 13.Bailey TL, Elkan C. Proc Int Conf Intell Syst Mol Biol. Vol. 3. AAAI Press; Menlo Park, California: 1995. pp. 21–29. [PubMed] [Google Scholar]
- 14.Knuppel R, Dietze P, Lehnberg W, Frech K, Wingender E. TRANSFAC retrieval program: a network model database of eukaryotic transcription regulating sequences and proteins. J Comput Biol. 1994;1:191–198. doi: 10.1089/cmb.1994.1.191. [DOI] [PubMed] [Google Scholar]
- 15.Cunningham TS, Cooper TG. The Saccharomyces cerevisiae DAL80 repressor protein binds to multiple copies of GATAA-containing sequences (URSGATA) J Bacteriol. 1993;175:5851–5861. doi: 10.1128/jb.175.18.5851-5861.1993. [DOI] [PMC free article] [PubMed] [Google Scholar]
- 16.Donahue TF, Daves RS, Lucchini G, Fink GR. A short nucleotide sequence required for regulation of HIS4 by the general control system of yeast. Cell. 1983;32:89–98. doi: 10.1016/0092-8674(83)90499-3. [DOI] [PubMed] [Google Scholar]
- 17.Kirkpatrick CR, Schimmel P. Detection of leucine-independent DNA site occupancy of the yeast Leu3p transcriptional activator in vivo. Mol Cell Biol. 1995;15:4021–4030. doi: 10.1128/mcb.15.8.4021. [DOI] [PMC free article] [PubMed] [Google Scholar]
- 18.Axelrod JD, Majors J, Brandriss MC. Proline-independent binding of PUT3 transcriptional activator protein detected by footprinting in vivo. Mol Cell Biol. 1991;11:564–567. doi: 10.1128/mcb.11.1.564. [DOI] [PMC free article] [PubMed] [Google Scholar]
- 19.Ma J, Ptashne M. The carboxy-terminal 30 amino acids of GAL4 are recognized by GAL80. Cell. 1987;50:137–142. doi: 10.1016/0092-8674(87)90670-2. [DOI] [PubMed] [Google Scholar]
- 20.Beck T, Hall MN. The TOR signalling pathway controls nuclear localization of nutrient-regulated transcription factors. Nature. 1999;402:689–692. doi: 10.1038/45287. [DOI] [PubMed] [Google Scholar]
- 21.Chi Y, et al. Negative regulation of Gcn4 and Msn2 transcription factors by Srb10 cyclin-dependent kinase. Genes Dev. 2001;15:1078–1092. doi: 10.1101/gad.867501. [DOI] [PMC free article] [PubMed] [Google Scholar]
- 22.Albrecht G, Mosch HU, Hoffmann B, Reusser U, Braus GH. Monitoring the Gcn4 protein-mediated response in the yeast Saccharomyces cerevisiae. J Biol Chem. 1998;273:12696–12702. doi: 10.1074/jbc.273.21.12696. [DOI] [PubMed] [Google Scholar]
- 23.Kornitzer D, Raboy B, Kulka RG, Fink GR. Regulated degradation of the transcription factor Gcn4. EMBO J. 1994;13:6021–6030. doi: 10.1002/j.1460-2075.1994.tb06948.x. [DOI] [PMC free article] [PubMed] [Google Scholar]
- 24.Zeitlinger J, et al. Program-specific distribution of a transcription factor dependent on partner transcription factor and MAPK signaling. Cell. 2003;113:395–404. doi: 10.1016/s0092-8674(03)00301-5. [DOI] [PubMed] [Google Scholar]
- 25.Baur M, Esch RK, Errede B. Cooperative binding interactions required for function of the Ty1 sterile responsive element. Mol Cell Biol. 1997;17:4330–4337. doi: 10.1128/mcb.17.8.4330. [DOI] [PMC free article] [PubMed] [Google Scholar]
- 26.Waterston RH, et al. Initial sequencing and comparative analysis of the mouse genome. Nature. 2002;420:520–562. doi: 10.1038/nature01262. [DOI] [PubMed] [Google Scholar]
- 27.Matys V, et al. TRANSFAC: transcriptional regulation, from patterns to profiles. Nucleic Acids Res. 2003;31:374–378. doi: 10.1093/nar/gkg108. [DOI] [PMC free article] [PubMed] [Google Scholar]
- 28.Hodges PE, McKee AH, Davis BP, Payne WE, Garrels JI. The Yeast Proteome Database (YPD): a model for the organization and presentation of genome-wide functional data. Nucleic Acids Res. 1999;27:69–73. doi: 10.1093/nar/27.1.69. [DOI] [PMC free article] [PubMed] [Google Scholar]
- 29.Zhu J, Zhang MQ. SCPD: a promoter database of the yeast Saccharomyces cerevisiae. Bioinformatics. 1999;15:607–611. doi: 10.1093/bioinformatics/15.7.607. [DOI] [PubMed] [Google Scholar]
- 30.Schneider TD, Stephens RM. Sequence logos: a new way to display consensus sequences. Nucleic Acids Res. 1990;18:6097–6100. doi: 10.1093/nar/18.20.6097. [DOI] [PMC free article] [PubMed] [Google Scholar]
Associated Data
This section collects any data citations, data availability statements, or supplementary materials included in this article.