

Abstract
Mitochondria are organelles that have been primarily known as the ‘power house of the cell’. However, recent advances in the field have revealed that mitochondria are also involved in many other cellular activities like lipid modifications, redox balance, calcium balance and even control cell death. These multifunctional organelles are motile and highly dynamic in shapes and forms; the dynamism is brought about by the mitochondria's ability to undergo fission and fusion with each other. Therefore it is very important to be able to image mitochondrial shape changes to relate to the variety of cellular functions these organelles have to accomplish. The protocols mentioned here will enable researchers to perform steady state and time lapse imaging of mitochondria in live cells by using confocal microscopy. High resolution 3D imaging of mitochondria will not only be helpful in understanding mitochondrial structure in detail but also could be used to analyze their structural relationships with other organelles in the cell. FRAP (fluorescence recovery after photobleaching) studies can be performed to understand mitochondrial dynamics or dynamics of any mitochondrial molecule within the organelle. Microirradiation assay can be performed to study functional continuity between mitochondria. Protocol for measuring mitochondrial potential has also been included in this chapter. In conclusion, the protocols described here will aid the understanding of mitochondrial structure-function relationship.
Mitochondria are double membrane bound organelles harboring their own DNA that have been classically thought to be the power house of the cell. More recent studies of mitochondria in the cellular context have revealed several other contributions of the organelles, including redox homeostasis, lipid modification, calcium homeostasis and cell death processes (Scheffler 2001). The inner membrane of the mitochondria maintains a transmembrane gradient of ions that is known as mitochondrial potential. Measuring mitochondrial potential, which drives mitochondrial ATP synthesis (Nicholls & Budd 2000), can assess mitochondrial function and integrity. Although early studies with isolated mitochondria have elaborately described mitochondrial properties, today's challenge is to understand the widespread roles mitochondria and their interplay with other intracellular organelles. Live cell imaging of mitochondria, more than a decade ago, revealed these organelles are highly dynamic. Since then many researchers have focused on understanding the dynamism of these organelles (Detmer & Chan 2007) as this property might be coupled to how mitochondria perform their many functions inside the cells. Therefore, techniques for imaging mitochondria are continually being improved to help further understand the structure function relationship of these dynamic organelles. Mitochondria, are distributed throughout the cell and exist in different size and forms that range from small granular to highly filamentous shapes. Although lack of mitochondrial dynamism is deleterious to cells, it is not understood how changes in mitochondrial morphology bring about change in mitochondrial function (reviewed in (Detmer & Chan 2007). The dynamics of mitochondrial forms in cells within cells is controlled by specific molecules involved in mitochondrial fission and fusion and also those controlling the cytoskeletal structure, most importantly microtubules (De Vos et al 2005). The steady-state fission-fusion events of mitochondria together with the motility of individual mitochondria pose serious challenges for high-resolution live cell imaging of mitochondria, that has only been recently met with the advent of confocal microscopes with high speed acquisition. This unit describes fluorescence-based confocal imaging approaches to study mitochondrial dynamics and function in live mammalian cells.
General considerations and precautions for imaging mitochondrial function
Live cell imaging of mitochondria can be performed by tagging resident mitochondrial proteins with fluorescent proteins or by adding specific mitochondrial targeting sequences to fluorescent proteins (Okamoto et al 2001). Commercially available dyes can also be used, although with limitations (Chen 1988). Depending on the researcher's interest there are various approaches for imaging mitochondria. For example, high resolution 3D imaging can provide details about mitochondrial structures and their association with organelles like the endoplasmic reticulum. Time lapse imaging techniques allows aspects of mitochondrial dynamics to be studied quantitatively and qualitatively. It can also be used to visualize exchange of molecules, like mitochondrial DNA, between mitochondria undergoing fission and fusion events (Detmer, 2007 #125). The physical and electrical continuity between mitochondria undergoing fission and fusion can also be studied using live cell imaging approaches employing FRAP and microirradiation protocols. Finally, mitochondrial potential can be quantified on a single cell or single mitochondria based on incorporation of specific fluorescent dyes. As mitochondria are an integral part of the cell death signaling machinery their morphology is highly sensitive to the status of cellular health. A great deal of caution, therefore, is required to avoid causing any perturbations to this organelle during imaging. The points discussed below should always be considered when preparing samples for imaging mitochondria in order to optimize imaging conditions and to avoid artifacts.
Sample preparation
-
When working with mitochondrial markers tagged to fluorescent proteins (FP) it is recommended to first make a stable cell line expressing the molecule of interest.
This is because transient expression itself is a stress to cells, which might affect mitochondrial morphology. For example, we have found that the DsRed molecule targeted to the mitochondrial matrix causes mitochondrial fragmentation after 48 hours of transient transfection. For primary cultures where markers cannot be stably expressed, transient expression systems can be used to express molecules at low levels for short period of time. One can also choose to use fluorescent dyes to stain mitochondria for short term experiments.
In case of overexpression systems, transient or stable, precaution has to be taken to ensure that expression of the fluorescent molecule of interest is not altering mitochondrial morphology. This can be done by comparing mitochondrial morphology in the stable line and its parental line. The steps include: a) staining the parental line (that is not expressing the mitochondrial FP) with a fluorescent mitochondrial dye (Mitotracker green etc); b) counting cells according to mitochondrial morphology as fragmented/intermediate/tubular (Karbowski et al 2006); c) counting cells according to mitochondrial morphology as fragmented/intermediate/tubular in the stable line expressing mitochondrial fluorescent protein; d) comparing the distribution of mitochondrial morphology of the parental line to that of the cell population expressing the fluorescent mitochondrial molecule.
The medium used for imaging should always be preincubated in a 37°C incubator with 5 % CO2 for 30-60 minutes.
The pre-incubated medium should be added to the cells in imaging chambers immediately after they have been brought out of the incubator. This should promptly be followed by overlaying with mineral oil, taking care that the oil meniscus is not close to the bottom of the chamber. The purpose of the mineral oil is to prevent CO2 from escaping the medium, which would change the pH of the medium. CO2 independent medium can be used to avoid use of immersion oil. However, it is not recommended for experiments demanding more than one hour. In this time, evaporation of water from the medium would concentrate the components of the medium, which in turn might affect mitochondrial morphology and function.
The stage warmer should be preset 30-45 minutes before commencement of the experiment. A properly calibrated temperature probe is mandatory. The calibration of the temperature probe should be checked by dipping the probe in two different water baths maintained at different temperatures. This ensures that the monitored temperature at the stage is correct. To monitor the stage temperature, the temperature probe should be put at the top of the objective (but not touching it), exactly at the point where the specimen in the stage holder to be imaged will be held during imaging.
Choice of mitochondrial marker
As mitochondria are double membrane bounded organelle one needs to have knowledge about the localization of the molecule/dye of interest in the mitochondria for proper interpretation of imaging results. At the resolution of light microscopy one cannot distinguish between the outer and inner membranes but can distinguish between the (outer/inner) membranes and the matrix. Therefore, the final outcome of experiments might differ with different choices of molecules to image mitochondria.
Although high resolution Z stacks can be acquired by using fluorescent dyes, time lapse imaging for assessment of mitochondrial dynamics could be erroneous when performed with fluorescent dyes. This is because dye addition has the possibility of affecting mitochondrial behaviour. The best and reproducible result is obtained by using fluorescent mitochondrial markers like mitoRFP/mitoGFP/mitoYFP. Use fluorescent molecules with excitation peak at longer wavelengths to avoid the possibility of mitochondrial damage from more energetic shorter wavelengths. Only the stable lines expressing mitochondrial markers can be imaged for very long time periods, even more than 24 hours. By contrast, experiments using fluorescent dyes need to be performed within 30-45 minutes, after which the mitochondria usually fragment in response to the foreign chemical.
For photobleaching experiments, the mitochondrial fluorescent tag should be chosen such that it is bright and photostable under low illumination but photobleaches fast and almost irreversibly. The irreversibility of photo bleaching is very important as the bleached molecule if reverts to its fluorescent state will contribute to the recovery. This would lead to erroneous conclusion about the physical mitochondrial process under investigation. This can be checked by performing the experiment, with exact same configuration as chosen, but in a fixed sample. If the reversion of the bleached molecule is minimum there should be no recovery in the fixed sample.
Basic Protocol 1
High resolution Z stack and time lapse imaging of mitochondria
Z stack across the depth of the cell provides steady state 3D information about mitochondrial morphology while time lapse imaging allows changes in mitochondrial morphology (dynamics) to be studied over time. Figure 1 depicts a representation of a projection of Z stacks of mitochondria in a single cell.
Figure 1.

High resolution image of mitochondria in a stable fibroblast cell line expressing mitoRFP. The image is a projection of Z stacks of mitochondria. 543nm HeNe laser was used for imaging and Z stacks were acquired following Basic Protocol 1. Imaging settings used is mentioned in Table 1. The raw image has been converted into gray scale.
Materials
Stably transfected cells expressing fluorescent tagged molecule of interest. Alternatively, mitochondrial fluorescent dyes of interest.
Labtek or Matek chambers
CO2 incubator at 37°C
Confocal laser scanning microcope, like Zeiss LSM510 or similar, with appropriate laser and filter sets required for imaging.
63 X Plan-Neofluar oil objective with high NA (1.4) is best for imaging mitohcondria in tissue culture cells.
Microscope stage heater and temperature probe
DMEM
Immersion oil
Mineral oil
Plate cells in Labtek/Matek chambers at least 10-16 hours before imaging.
Stain with the chosen dye, if required, as mentioned in support protocol 2.
Prepare sample (as mentioned before).
Preheat the microscope stage to 37°C. Turn on the appropriate laser at least 15 minutes prior to the experiment to give it time to stabilize.
Put a drop of immersion oil on the objective and fix the chamber to be used to the stage holder properly.
-
Choose the appropriate configuration for the fluorophore to be imaged.
To be able to do so one needs prior knowledge of the excitation and emission properties of the fluorophore. Unit 21.5 provides elaborate guidance to such an end. -
Choose a cell to be imaged by using the FAST scan button in minimum zoom.
One can also quickly do so by looking at the eye piece of the microscope with proper filter. Such an attempt, if not accomplished within few seconds, might cause bleaching of the fluorophore or photodamage to the mitochondria. -
Adjust the laser intensity and detector gain according to the brightness of the sample in such a way that the signal from any pixel is not saturated (as checked in the palette in the LSM 510 systems).
For quantitative imaging this is essential but for qualitative purposes some pixels may be allowed to cross the threshold to be able to detect other very faint pixels. This is because the fluorescent signal might not be distributed to all the mitochondria homogenously, especially in certain perturbed conditions where normal mitochondrial morphology is perturbed. Set the scanning parameters including zoom, pixel size, scan speed, scan number for averaging, pinhole, laser intensity, detector gain etc and scan a single section. Table 1 provides value for these parameters for proper imaging of mitochondria of a whole cell. If necessary the parameters can be changed to yield better results.
-
If satisfied with the image check for minimal bleaching,
This is very important for time lapse imaging. With laser power and scanning parameters being fixed, bleaching would depend on- Scanning frequency: As mitochondrial movement per second is below the resolution limit of light microscope (as measured in neurons, (De Vos et al 2003)) imaging speed of 1 frame per second serves the purpose. One can further reduce the speed to 0.2 frames per second or 1 frame every 5 seconds.
- Number of scans: The total number of scans in a time series would depend on the duration of the experiment. For minimal bleaching, it is recommended to give more time between scans when intended to perform a longer time series experiment.
‘The scanning parameters can be altered to reduce bleaching by enhancing scan speed or reducing averaging etc. Doing so will compromise the resolution. Therefore, a degree of trade off between resolution and dynamics of mitochondrial structure has to be considered which will be dependent on the goal of the experiment being performed.Bleaching could arise during acquisition of Z stacks. This can be assessed by performing a time series where the time interval will be same as the scan time of a single Z section. If there is no reduction in signal in this time the parameters are suitable for Z sectioning. If not, the laser intensity and detector gain have to be adjusted according to the brightness of the sample. -
Acquire time series or Z stacks and save images.
For acquiring overlapping Z stacks, the size of the optical slice should be twice than that of the Z interval, while for non-overlapping Z stacks, the optical slice should be close to that of the Z interval. For example, if pinhole size allows light from 1 μm optical slice, the Z interval should be 0.5 μm for overlapping Z stacks and 1 μm for non-overlapping Z stacks. Oversampling might scan the same portion of the image more than once while undersampling might miss scanning portions. This could introduce errors in quantitative measurements like mitochondrial size, especially in case of tubular mitochondria.For long term time series experiments one should be aware of the drift in focus (due to thermal or other fluctuations) in the imaging setup and include autofocussing modules, like Multitime (Zeiss) etc., for correcting the drift.
Table 1. Scanning parameters for acquiring high resolution Z stacks of mitochondria.
| Parameter | Value |
|---|---|
| *Zoom | 2.5-3 |
| Pixel size | 1024×1024 |
| Scan speed | 7 |
| Scan number for averaging | 2 |
| Pinhole | 1 airy unit |
| Laser intensity | 1-20% |
| Detector gain | 600 |
High resolution imaging of mitochondria would limit the investigator to scan one cell at a time, or part of a cell or even individual mitochondria. To image a whole cell the zoom factor (digital magnification) will have to be decided based on the size of the cell. A zoom factor of more than 5 is not recommended as this would cause the image to be pixelated but can be used, if absolutely necessary, with adjusting other parameters.
Support Protocol 1
Imaging mitochondrial morphology alteration
The morphology of the mitochondria are influenced directly and indirectly by many factors. For example, nearly all the agents causing mitochondria dependent cell death have been found to cause mitochondrial fragmentation (Karbowski & Youle 2003). Recent studies are also being focused towards identifying drugs that would directly impact mitochondrial fission-fusion machinery and alter mitochondrial morphology (Cassidy-Stone et al 2008). To image the effect of drugs or other chemicals on mitochondrial morphology/function, include the following steps for modifying acquisition of time series as mentioned in Basic Protocol 1. An example is illustrated in Figure 2 where time lapse images have been acquired immediately after addition of microtubule depolarizing drug, nocodazole (5μg/ml) to investigate the change in mitochondrial morphology after disrupting microtubules. Note the alteration in mitochondrial morphology from time 0 (before addition) to 30 minutes after addition.
Figure 2.

Time series of mitochondria after addition of nocodazole to depolymerize microtubules. Experiment was performed in a fibroblast line stably expressing mitoRFP. Time lapse images were acquired following Basic Protocol 1 and Support Protocol 1. The numbers represent time (in minutes) after addition of nocodazole. 543nm HeNe laser was used. The raw image has been converted into gray scale. Images were acquired by a 63× objective in zoom 2. Pinhole size was 2.5 airy units.
Additional materials
Drug of choice
Prepare sample as in Basic protocol 1 but do not overlay sample with mineral oil.
Acquire 2-5 images of the chosen field.
-
Stop scanning and carefully remove the lid of the chamber.
Carefully aspirate 50% of the medium from the chamber by using pipette.
Add equal volume (as removed) of 2× of the drug (X being the working concentration of the drug) to the chamber.
Put the lid of the chamber back and quickly resume imaging.
-
Carefully overlay with mineral oil.
Care should be taken not to alter the plane of focus during the procedure of addition of drug. If the focus appears to be shifted, one has to quickly reset the focus keeping the last scanned image of the field as standard. The time period between stopping and resuming scanning has to be taken into account during the final analysis of the time series.
Basic Protocol 2
Florescence Recovery After Photobleaching on mitochondria
Fluorescence Recovery After Photobleaching (FRAP) is a powerful biophysical method to understand the dynamics of molecules or structures in live cells. This method involves photobleaching of fluorescent molecules within a certain area of a cell and then monitoring recovery of fluorescence in the bleached zone by movement of molecules/organellar structures from surrounding unbleached zone. For more detailed discussion of the theory of FRAP please see unit 21.1. This experiment involves time lapse imaging as it depends on the kinetics of mitochondria per se or that of a mitochondrial protein. Three types of information related to mitochondrial dynamics can be obtained from FRAP experiments depending on the time scale of recovery:
mobility of the fluorescent molecule – time scale of recovery is in milliseconds; the recovery kinetics is a measure of diffusion of the fluorescent molecule of interest.
mitochondrial continuity: time scale of recovery is from few seconds to 2-3 minutes depending on the area of bleach; this gives a measure of continuity of the mitochondrial compartment where the fluorescent molecule resides.
mitochondrial movement/dynamics (fission-fusion): time scale is between 2-3 minutes to around 1 hour; this recovery is due to the combination of mitochondrial motility and fission-fusion dynamics.
The time scale of the FRAP experiment has to be chosen depending on the investigator's goal. The protocol here uses a microscope with faster scanning speed for the option A. Since the basic protocols are same for all the options they are mentioned under the same heading.
Materials
Cells stably expressing the fluorescent mitochondrial marker.
Confocal laser scanning microcope, like Zeiss LSM510 or similar, with appropriate laser and filter sets required for imaging.
Labtek or Matek chambers
CO2 incubator at 37°C
63 X Plan-Neofluar oil objective with high NA (1.4) is best for imaging mitohcondria in tissue culture cells.
Microscope stage heater and temperature probe
DMEM
Immersion oil
Mineral oil
Repeat step 1 to 7 from Basic Protocol 1.
Set the scanning parameters including mode, zoom, pixel size, scan speed, scan number for averaging, pinhole, laser intensity, detector gain etc. Verify the set of parameters by doing a single scan each time after adjusting a parameter. Table 2 provides FRAP parameters for all the three options. Settings may be altered to improve imaging depending on the system.
-
Define region of interest (ROI): Bleaching would be performed and recovery would be followed in the specified ROI.
Two important criteria about selection of an ROI should be considered.- Size: One should have an expectation regarding the source of recovery of fluorescence (option A, B or C) in the ROI before setting this parameter. The size of the ROI should not be more than 30%-50% of the total signal area, so that the the recovery of fluorescence in a given time from the of the unbleached zone (70%-50%) can be appreciably detected. The time to reach maximal recovery by movement of molecule inside mitochondria (option A,B) or that of mitochondria themselves (option C) would depend on the available unbleached fluorescence, that would contribute to the recovery. The ROI size would be dependent on which option of the FRAP (A, B or C) one chooses to do. For option A the ROI as should be only around 0.5×0.5μm, just enough to cover a small zone on an individual mitochondria (Table 2, Figure 4). For option B/C one can decide to have the ROI spanning 5 to 20 % of the cell either across the cell or locally (Figure 3)
- Placement: For option B/C the ROI should be placed in a region where the mitochondrial population is roughly uniformly distributed. In all the options (A, B and C) the ROI should be placed close to the centre of the area of the total distributed signal. This means close to the centre of the cell for option B/C (Figure 4) and centre of the mitochondrion of interest for option A (Figure 3). This allows for movement of the fluorescence from all directions of the surrounding unbleached zone to the bleached zone. Wrong placement of ROI, for example ROI placed at one side, might introduce errors in analyses and interpretation of the results.
-
Standardize bleaching conditions: Photobleaching is achieved by using maximum power of the of the same laser that is used for scanning. If the fluorescent molecule of choice is RFP then it is recommended to use 458,488 and 514 nm Argon lasers in addition to the less powerful 543 nm HeNe laser. As the RFP excitation with the peak at 543nm also includes these wavelengths, the other lasers will facilitate bleaching. For powerful 543 nm lasers this might not be necessary.
In option B/C bleaching should be as fast and as complete as possible which can be increased by increasing the number of bleaching iterations; for option A where the recovery kinetics is in milliseconds bleaching should be faster and restricted to 20-40% of the initial fluorescence intensity. However, one should consider a trade off between the number of bleaching iteration and bleaching time. Longer than necessary bleaching could damage mitochondria. -
Set the time interval and total imaging time: These parameters would depend on the option chosen, A, B or C.
Scanning in short intervals would necessitate faster scanning. This may be achieved by restricting the scanning area to the zone of interest (Figure 3A). -
Acquire and save the time series to be analyzed when required. The quantitative analysis can be performed according to (Goodwin & Kenworthy 2005). The number of recovery curves required for statistically significant analyses should be between 10-20. The data may be used to calculate half-time of recovery (t1/2), mobile and immobile fractions of the fluorescent molecule (see Unit 21.1), diffusion coefficients (Partikian et al 1998) and also continuity parameters (Karbowski et al 2006). An example of analysis of FRAP data has been provided in Figure 4 and 5. The figures depict analyses of mitochondrial connectivity in each of the two cells; bleaching was performed in the long ROI and the recovery in the small ROIs in each cell is compared to the recovery in the long ROI of the same cell. In cell A, individual ROIs appear to have different recovery kinetics while in cell B, individual ROIs have similar kinetics.
The analysis will include correction for overall photo bleaching that might have occurred during acquisition of the time series and total fluorescence that could contribute to the recovery. As mitochondria usually form small or large networks sharing their contents and continuously rearrange the branching points of the networks, it is very difficult to have a knowledge of the total source of unbleached fluorescence that could contribute to the recovery. Depending on the analysis performed this factor might be considered constant or ignored. For example in option A if the individual mitochondrion appear to form a part of the network then it is recommended not to consider the factor. However, it is recommended that this kind of an analysis be performed on mitochondria near the edge of the cell where there will very few separated mitochondrial elements (Figure 3B). In the example of connectivity analysis provided in Figure 5, the normalization by the total fluorescence has been ignored. In this case the alternative is to consider the total mitochondrial fluorescence as the source of recovery (which may not be the case in reality).FRAP on mitochondria to analyze mitochondrial connectivity (option B) or diffusion of mitochondrial molecule (option A) is complicated by the motility of the organelles. This problem cannot be avoided but some verification has to be done before proceeding for image analyses. Careful examination of the time series images is required for any of the three possible errors that could have been introduced during image acquisition: 1) sudden appearance of one or more motile mitochondria in the ROI considered. 2) mitochondria shifting or moving away thus making the signal in the ROI irrepresentative of the experimental result (for option A). 3) the whole cell of interest moving during acquiring the time series (for option B/C). Any time series having one or more of these errors have to be discarded from the analyses.
Table 2. Scanning parameters for performing FRAP analysis on mitochondria.
| Parameter | Option A | Option B | Option C |
|---|---|---|---|
| Objective | 63× | 63× | 63× |
| Zoom | 1 | 2 | 2-3 |
| Pixel size | 512×80 | 512×512 | 512×512 |
| Scan speed | 9 | 8 | 7-8 |
| Scan number for averaging | 1 | 1 | 1 |
| *Pinhole | Open | Open | Open |
| Laser intensity | 0.5-10% | 0.5-10% | 0.5-10% |
| Detector gain | 600 | 600 | 600 |
| Size of ROI | 0.5×0.5 μm | Variable# | Variable# |
| Time ineterval | 5 msec | 1s | 5mins |
| Bleaching time | 7μs | >1ms<1s | >1ms<1s |
| Bleach iterations | 2 | 5 | 5 |
| Time lapse imaging time | 500ms | 1-5min | 30-1h |
The pinhole should be kept open to be able to collect light from the whole depth of the cell. If the pinhole were narrow then movement of mitochondria in and out of the optical plane would introduce fluctuations in the reading. However, an open pinhole would compromise the resolution to a certain extent. Reduction of laser intensity can sometimes help to avoid out of focus signal, which, however, would depend on organization of mitochondria in the cell of interest.
Refer to the text on ROIs
Figure 4.
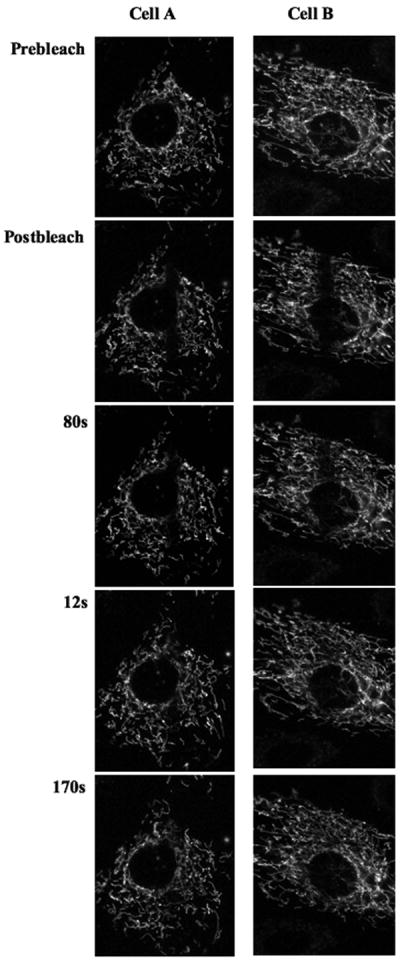
Fluorescence Recovery after Photobleaching on mitochondrial population. Experiment was performed in a fibroblast line stably expressing mitoRFP following Basic Protocol 2. Prebleach and postbleach images depict mitochondria before and after the single bleaching pulse respectively. The numbers represent time after post bleach in seconds. Two cells, A and B, have been shown to compare different recovery kinetics. 543 HeNe laser line was used for imaging and other imaging settings used is mentioned in Table 2.
Figure 3.

Fluorescence Recovery after Photobleaching on single mitochondria. Experiment was performed in a fibroblast line stably expressing mitoRFP following Basic Protocol 2. The time scale of recovery is in milliseconds. The arrow points to the bleached zone. Another mitochondria in the field of view gives an assessment of overall bleaching during the recovery period. High speed laser scanning confocal microscope (Zeiss LSM5 Duo) was used in A while a similar but slower microscope (Zeiss 510) was used in B. Prebleach and postbleach images depict mitochondria before and after the single bleaching pulse respectively. 543nm HeNe laser line was used for imaging and other imaging settings used is mentioned in Table 2.
Figure 5.

Analysis of connectivity by FRAP on mitochondrial population. Images of cell A/B of Figure 4 was analyzed according to (Goodwin & Kenworthy 2005). Different ROIs are color coded corresponding to the associated graph showing recovery kinetics. The signal in the blue ROI was used to subtract the background signal. Signal was bleached in the red ROIs and recovery was monitored in all the ROIs. The analyses here does not include correction for bleaching and is normalized by the initial fluorescence.
Basic Protocol 3
Micro-irradiation assay to assess electrical continuity in mitochondria
Knowledge of mitochondrial biochemistry and energetic properties has been used to design fluorescent dyes (commercially available from Molecular Probes) to stain mitochondria in live cells (Unit 4.4 and Support Protocol 2 covers staining of mitochondria with these dyes). The fluorescent derivatives of certain cationic lipophilic compounds (ex. TMRE) concentrate inside the mitochondria that maintain inner membrane potential. Therefore, uptake of TMRE can be used to quantitatively determine mitochondrial transmembrane potential. TMRE loaded mitochondria are highly sensitive to laser scanning, which is reflected in the spontaneous depolarization that can happen when imaging TMRE loaded mitochondria in cells (Bunting 1992). This phenomenon can be manipulated in a controlled fashion using a high intensity laser to irradiate and thus depolarize TMRE loaded mitochondria, resulting in immediate loss of TMRE from the irradiated mitochondria (Amchenkova et al 1988). Directed irradiation in an ROI can cause controlled depolarization very locally in an individual mitochondrion in a cell. This local depolarization will rapidly spread from the irradiated point to mitochondrial elements in electrically continuity to the irradiated point (Figure 6). Therefore, one can assess the extent of electrical continuity of mitochondria in an individual by microirradiating one point in a mitochondrion and monitoring, by time lapse imaging, the spread of depolarization to other electrically continuous mitochondria.
Figure 6.
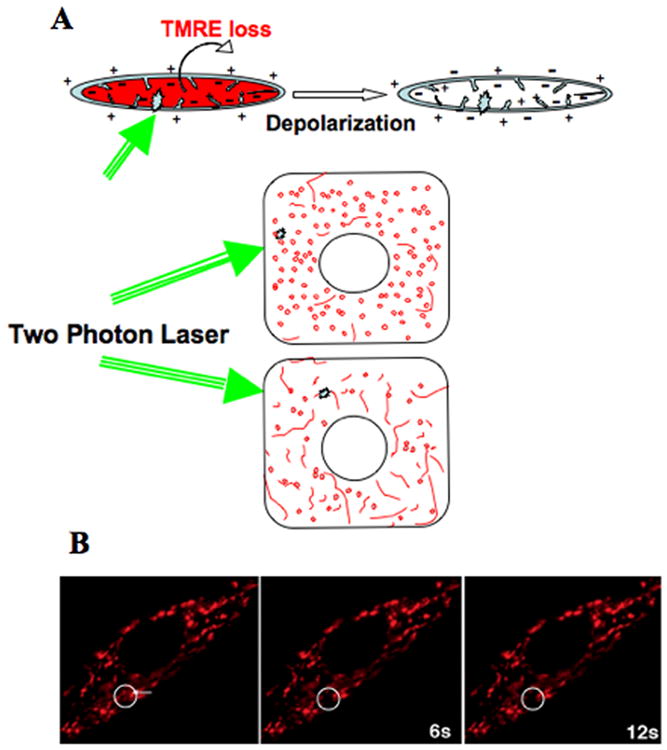
Microirradiation of TMRE loaded mitochondria. A depicts schematic representation of the microirradiation protocol. Mitochondria maintaining transmembrane potential (of charge) incorporates TMRE in the matrix. After being irradiated (green arrows) by the two photon laser locally, loss of TMRE occurs from the whole mitochondria due to depolarization triggered by the laser; as depicted for a single mitochondria in the upper panel and inside a cell in the lower panels. When this experiment is performed in cells, only single mitochondria are targeted for irradiation. B shows images of a microirradiation experiment in a fibroblast where arrow points to the site of irradiation. Images were acquired following Basic Protocol 3. Loss of TMRE signal is seen in the circled area in the time mentioned in seconds.
Materials
LabTek or MaTek chambers
DMEM
TMRE
CO2 incubator at 37°C
Cells expressing any mitochondrial fluorescent protein marker.
Laser scanning confocal microscope with a) 543 laser line and appropriate filter sets for imaging rhodamine and b) 2 photon laser
63 X plan neofluar objective
Power meter (from Coherent)
Microscope stage heater and temperature probe
Mineral oil
Immersion oil
Preheat the microscope stage to at 37°C and turn on 543 HeNe and the 2 photon chameleon laser.
Stain with TMRE as in Support Protocol 2.
Repeat step 1 to 7 from Basic Protocol 1.
Set up imaging settings: The 543nm laser line is used for imaging. To image TMRE use settings for Rhodamine. An open pinhole is used to collect signal from the whole cell. Zoom factor 4 is chosen for high resolution imaging. Scanning speed and averaging can be decided by the investigator to obtain best possible resolution.
Define ROI: To be able to cause microirradiation for assessing electrical continuity one should choose ROI covering only to small area of the mitochondrial population. The ROI should not exceed an area of 1×1μm.
-
Set up microirradiation settings: Chose the 2 photon laser as the bleaching laser for causing microirradiation. Tune the laser to 800 nm. Use 10-20% of the laser power and appropriate filters to cut off longer wavelengths. Number of iterations is set to 5. Optimum imaging speed should be 1frame per second to be able to monitor spread of depolarization.
All parameters, including the objective, should be kept constant for reproducible microiraadiation as each will affect the net power delivered to unit area of the sample. The choice of the microirradiating laser depends on the power of the laser. As the physics behind 2 photon excitement requires the laser to be highly powerful (Piston 1999) this has been used in this protocol. Proper alignment of the 2 photon laser is critical to achieve the required power for microirradiation (details about 2 photon microscopy has been discussed in the relevant laboratory manual (Dickinson 2005)). The power at the rear end of the objective should be optimally around 60mW. Any other laser achieving the power requirement can also be used to microiiradiate. -
Assess damage to the cell and mitochondria: The optimal microirradiation settings should aim at causing mitochondrial depolarization and loss of TMRE within the ROI but not damage the cell or fragment the irradiated mitochondrion. The damage to the cell can be assessed by performing time lapse imaging with the transmitted light/DIC, with the microirradiation setup. This time series has to be examined carefully to confirm that no unwanted formation has occurred at the point of irradiation and the cell has not swelled in the time scale of the experimernt, both of which would indicate cell damage.
Mitochondrial damage can be assessed by performing the microirradiation time lapse experiment on cells expressing mitochondrial fluorescent protein marker. Observing the mitochondria at the irradiated zone carefully, in the microirradiation time series, one should confirm that the mciroirradiation does not fragment the mitochondrion in the time scale of the experiment, which could be indication of damage.
If there is any indication of cellular or mitochondrial damage, the power of microirradiation has to be minimized by reducing the bleaching iterations or the power of the laser.
Acquire the microirradiation time series and save images to be analyze when required.
Support protocol 2
Staining mitochondria in live cells to assess mitochondrial function by imaging
Knowledge of the mitochondrial lipid environment has been used to synthesize fluorescent compounds that stain mitochondria in live cells. This protocol describes staining and imaging of live tissue culture cells using the mitochondrial labels: TMRE, JC-1, mitocotracker green or Picogreen. Mitotracker Green (and Non Acridyl Orange) are such compounds which can be used to measure mitochondrial mass. Therefore, from the same cells stained with both Mitotracker green and TMRE (for mitochondrial potential, see Basic Protocol 3), one can assess mitochondrial potential per unit of mitochondrial mass on a single cell basis or in single mitochondria. Compounds like JC-1 are also taken up by mitochondria by the virtue of their transmembrane potential. This dye when gets enriched in the high potential zones of mitochondria can form aggregates that have altered emission spectrum (Smiley et al 1991). Moreover, mitochondrial DNA can be visualized with the DNA binding dye PicoGreen ((Ashley et al 2005), Figure 7).
Figure 7.

Picogreen staining of mitochondrial DNA.
Additional materials
TMRE/Mitotracker Green/JC-1/Picogreen
DMSO
Petri dishes
Fluorescence microscope with proper filters for Rhodamine and Fluorescein
Plate cells and perform the experimental procedure as required on the cells at least 16 hours after plating.
Incubate required volume of growth medium in the CO2 incubator at 37°C for 1 hour.
-
Thaw an aliquot of the respective dye and make the staining solution by diluting in the pre-incubated medium. Follow Table 3 for working concentrations.
Each dye solution should be maintained as small aliquots in -20°C. Freezing and thawing more than 5-6 times is not recommended. Add the staining solution to the cells and incubate for 15 minutes in 37°C incubator.
Wash cells with pre-incubated medium for 3 times.
-
For double staining of Mitotracker green and TMRE (to assess mitochondrial potential per unit mass), add diluted TMRE solution to cells already stained with Mitotracker green at this point and incubate for 15 more minutes.
The following criteria have to be confirmed:- TMRE loading is below the quenching limits: When mitochondria are overloaded with TMRE a phenomenon of self quenching occurs between TMRE molecules (Ward et al 2000). This reduces the net TMRE signal obtained from mitochondria and thus will produce erroneous results. The concentration of TMRE mentioned here is below quenching limits but one should check this for every experimental set up as mentioned below.
- No FRET occurs between Mitotracker Green and TMRE : Fluorescence Resonance Energy Transfer is a process by which energy is transferred from a donor molecule to an acceptor molecule with an overlapping excitation spectrum with the donor emission spectrum. It has been reported that at certain concentrations FRET occurs from Mitotracker green to TMRE molecules inside the mitochondria (Elmore et al 2004). This will reduce the green signal in the presence of TMRE. Although the protocol involves much lower concentrations of both the dyes than necessary to undergo FRET, it is recommended this is verified in every experimental set up.
Both these caveats can be easily verified by performing time lapse imaging of a double stained sample after adding FCCP as mentioned in Support Protocol 1. Addition of FCCP would cause mitochondrial depolarization and loss of TMRE from the mitochondria. Therefore, if depolarization by FCCP reduces the mitochondrial red signal, the TMRE used is below the quenching level. On the other hand, if depolarization by FCCP increases the intensity of TMRE signal from mitochondria, it is an indication of TMRE loading is beyond the quenching levels. In this case the working TMRE concentration has to be lowered and the test has to be repeated further. If the loss of TMRE signal by FCCP does not enhance the green signal from Mitotracker green then it is an indication of lack of energy transfer between the two fluorescent dyes. If adition of FCCP increases the signal from Mitotracker Green (indicative of FRET) then the working concentrations of the dyes have to be reduced and the test has to be repeated further.In immortalized cells, an alternative for normalizing the mitochondrial mass could be replacing Mitotracker green with stably expressing mitoGFP. This fluorescent molecule has a similar spectrum to that of Mitotracker green and resides in the mitochondrial matrix. For this purpose one needs to transfect mitoGFP in the cell line and select a stable clone that will be expressing mitoGFP equally in all the cells derived from the clone.It is recommended to always include a control for hyperpolarization and depolarization in this analysis. Oligomycin would cause hyperpolarization by reducing mitochondrial ATP synthase activity and the ionophore FCCP would cause depolarization (Nicholls & Ward 2000). As the assessment of mitochondrial potential by this kind of an analysis is done on an comparative scale the samples treated with oligomycin and FCCP would serve to define the uppermost and lowermost limits in the scale of detection. Repeat step 5.
-
Add pre-incubated medium and layer with mineral oil on top of the medium.
Take care that the mineral oil does not touch the bottom of the chamber where cells are coated. -
Choose appropriate parameters for imaging as enlisted in Table 4.
For assessing mitochondrial potential per unit mass the configuration of filters for imaging should be so chosen that restricts bleed through from one channel to the other in cells stained with both Mitotracker green and TMRE. Adjust the laser intensity and detector gain according to the brightness of the sample in such a way so that the signal from any pixel is not saturated. Follow Table 4 for setting imaging parameters depending on whether the aim is to detect total mitochondrial potential per cell or that of individual mitochondria in single cells. Parameters can be altered for better imaging depending on the system. -
Imaging should be performed as soon as possible according to the relevant protocol. Beyond a period of 30-45 minutes the mitochondria might start fragmenting leading to erroneous results.
There could be variations in the sensitivity level according to the cell type and one should make a note of that. Generally, more sensitive cells would allow less time before mitochondria fragment and alter potential as an indication of a death trigger. Therefore everything should be ready before the experiment and one should be quick in finishing all the scans. Save images and analyze images according to convenience. The ratio of TMRE/Mitotracker green would be an assessment of mitochondrial potential in arbitrary units.
Table 3. Working concentration for various mitochondrial fluorescent dyes.
| Fluorescent dye | Working Concentrations |
|---|---|
| TMRE | 25-50nM |
| Mitotrcaker Green | 50-100nM |
| #$Mitotracker red 633 | 250nM |
| *JC-1 | 5nM |
| **PicoGreen | 1:500 dilution |
Although the dye JC-1 can be used for qualitative purposes to assess heterogeneity in mitochondrial potential it does not yield quantitative results and also often causes distortion in mitochondrial morphology. The dye forms particulate structures in solution therefore it is recommended to do a serial dilution after spinning down the solution each time. Otherwise the particulate structure will deposit down on the bottom of the chamber during staining and the cells close to the particulate matter will incorporate more of the dye yielding very erroneous results.
Overstaining results in the incorporation even in the endoplasmic reticulum.
This dye including, some others not mentioned here, are dependent on the mitochondrial potential to variable extents.
Dilution is from a stock bought from Molecuar probes (P7581). Mitochondrial DNA would appear as cytoplasmic dots if optimally stained with this stain as seen in Figure 5. It is always recommended to perform dual staining with another mitochondrial marker or dye as cytoplasmic dots could also be due to mycoplasma infections.
Table 4. Imaging parameters for measuring mitochondrial potential per unit mass.
| Parameter | Individual cell | Individual mitochondria |
|---|---|---|
| Objective | 40× | 63× |
| Zoom | 0.7 | 2-3 |
| Scan speed | 8 | 8 |
| Averaging | 2 | 2 |
| Optical slice | Open | 1μm |
| Z section | -------- | 0.5μm |
| *Laser power | 1-10% | 1-10% |
The TMRE imaging of mitochondria at zoom 2 or 3 should be done very cautiously as high laser power could quickly photodamage TMRE loaded mitochondria (Bunting 1992). Therefore for optimum results scanning laser intensity of the both the lasers should be kept as low as possible.
Commentary
Background information
The name ‘Mitochondria’ is a fusion of the Greek words ‘mito’ meaning filaments and ‘chondro’ meaning grains. The length of each mitochondria can extend from 500 nm to 1mm or more, the average diameter being 500nm (Detmer & Chan 2007). Contributions of electron microscopists aided in the detailed understanding of mitochondrial structure while biochemical analyses of isolated mitochondria identified the organelle as a seat of intermediate metabolism. In this era of live cell imaging mitochondrial biologists are motivated to understand the structure-function relationship of mitochondria in live cells.
Imaging of mitochondria in live yeast and mammalial cells has been made possible by designing vectors expressing fluorescent proteins that are tagged to either resident mitochondrial protein or any particular mitochondrial targeting sequence, targeting the fluorescent protein into any of the three mitochondrial compartments. Detailed strategy to that end in yeast can be found in (Okamoto et al 2001) and mammals in (Rizzuto et al 1996). The latest generation of fluorescent protein variants has been covered in section UNIT 21.5. The targeted fluorescent protein essentially enables the researchers to visualize the behaviour of mitochondria within cells and/or study the behaviour of the particular fluorescently tagged mitochondrial protein.
High resolution live cell imaging of mitochondria aided in understanding the correlation of mitochondrial fragmentation and physiological properties of apoptotic cytochrome C release (Frank et al 2001) or ROS production (Yu et al 2006). The varied mitochondrial morphology in a population of cells can be quantitated from static images as fragmented, intermediate or tubular according to the predominant mitochondrial morphology in an individual cell. However, in some extreme instances when mitochondria could also appear as clumps, it is erroneous to include them in any of the above three categories of mitochondrial moprhology. These clumps could arise from clumping of fragmented mitochondria or collapse of a fused form of mitochondria. Therefore, in these situations it is critical to perform FRAP analysis of any mitochondrial matrix molecule. This assay provides important measurements for mitochondrial continuity that would arise in fused mitochondrial structures. The assay could also be modified in variety of aspects to understand mitochondrial dynamism. The interpretation of the recovery after photobleaching has to be carefully performed where the time scale of recovery is crucial for highly mobile organelles like mitochondria; failing to appreciate this property might yield confusing results. Furthermore, the alteration of recovery kinetics in a FRAP study for mitochondrial connectivity or motility might be contributed by altered diffusing properties of the matrix molecule of interest. This has to be verified by performing FRAPs in individual mitochondria and any statistically significant change has to be included in the analysis of matrix continuity. To capture the complete kinetics of the recovery of matrix molecule special microscopes are required with super fast scanning modules, like LSM5 Duo or Nikon epifluorescence microscope with super fast integration time of the camera and photomultipliers attached to the microscope (Partikian et al 1998). This will allow very fast photobleaching in the order of µs (Fig 4A) that is required for molecules with diffusion coefficient in the order of 2-3 × 10(-7) cm2/s like in mitochondrial matrix. Slower microscopes, with longer bleaching time, will spread the bleaching beyond the bleach box, therefore increasing the recovery time (Fig 4B). This kind of analysis might be used in a comparitive scale but the data should not be used to determine diffusion coefficient.
The microirradiation protocol of TMRE loaded mitochondria was first designed (Amchenkova et al 1988) and similar technique has been also used to study various other organelles (Berns 2007). High laser power has been shown to introduce holes in mitochondria (Khodjakov et al 2004) thus disrupting mitochondrial potential across the inner membrane. Laser induced depolarization of TMRE loaded mitochondria has also been shown to increase localized ROS production (O'Reilly et al 2003). This experiment has to be performed with caution about the cellular damage during the experimentation (as discussed before) and controls have to be included each day of experimentation. When dealing with more than one cell type proper controls have to be included for each cell type under examination. It has to be very well appreciated that in a controlled setup the irradiated cell, behaving normally within the small time span of the experiment, might eventually die. Therefore, long term experimentation may not be performed on such a cell. The microirradiation experiment is important from the mitochondrial bioenergetics point of view as this qualitatively addresses the electrical continuity of the mitochondria at any given time point that might have impact on the total ATP output from the mitochondrial system (Skulachev 2001).
The staining of mitochondria with different commercially available dyes is routinely practiced and the background information may be obtained from Unit 4.4
Post processing of image analysis is a critical step for proper interpretation of imaging data. Although this section does not cover image analysis in details mention may be made of some software that will be helpful for the purpose. Among the proprietory software, Zeiss's own Image examiner can be used to analyse laser scanning confocal images. A free downlodable version is available in Zeiss's website which can be used as a viewer. Volocity and Metamorph can also be used. An open source software called Image J, is very helpful for all basic purposes. Relevant plugins can be included for advanced purposes. One could also include self written macros in the list of Image J pluggins.
Trouble shooting
This section will discuss the problems that might arise while or before imaging mitochondria in particular. The general trouble shooting for imaging per se will not be discussed here. The possible causes to any problem is very crisply mentioned here and are discussed in more detail in the relevant section.
| Problems | Possible causes |
| Z stacks and Time lapse | |
| Fragmented/clumped mitochondria | Cells are not healthy.
|
| Immotile mitochondria |
|
| Projection of Z stacks is blur |
|
| FRAP | |
| No recovery |
|
| Bleached zone is more than the bleach box |
|
| Not enough bleaching |
|
| Poor recovery curve |
|
| Microirradiation | |
| No loss of TMRE after microirradiation | No irradiation due to application of lower laser power
|
| Mitochondria shifting away during imaging Or Mitochondria fragmenting |
|
| Increase in TMRE signal after microirradiation |
|
| Staining for potential | |
| No staining | Mitochondria are absolutely depolarized for cells not being healthy (as mentioned above) |
| Poor resolution |
|
| The oligomycin/FCCP treated samples not producing expected results as controls |
|
| Loss of TMRE while scanning |
|
| Fragmented mitochondria |
|
Anticipated Results
The protocols described in this Unit will help the researcher to understand mitochondrial function by imaging. The precautions mentioned here for imaging mitochondria are very critical to be able to achieve the goal of establishing structure function relationship of mitochondria. By the correct use of imaging parameters and choice of fluorophore the investigator can not only acquire static mitochondrial images but also perform time lapse imaging on mitochondria. Live cell imaging of mitochondria including the FRAP and microirraditaion protocols would allow investigators to study the dynamics of mitochondria in quantitative terms and can also understand dyanamics of individual protein in mitochondria. For example, study of fluorescently tagged intermembrane space protein cytochrome C by live cell imaging, uncovered many important aspects of apoptotic release of this protein into the cytosol (Goldstein et al 2000). Live cell imaging studies of mitochondria imply that imaging of fluorescent tagged versions of mitochondrial proteins have tremendous potential of unraveling many unexplored aspects of mitochondrial physiology and its crosstalk with other cellular compartments.
Time considerations
Generation of stably expressing cell line would take one to two months depending on the cell type. Staining with fluorescent dyes and sample preparation may take from 30 minutes to two hours. Stained sample should be imaged within 45 minutes. Acquiring each Z stacks will take less than one minute; may take little longer for very slow scan speeds. The total time for a time lapse experiment would depend on the kinetics of phenomenon to be observed. To observe mitochondrial dynamism a time lapse of 2-3 minutes should be sufficient. Each FRAP assay will take from less than half a minute to an hour depending on the goal of the experiment. Extent of electrical continuity can be captured within 15 seconds or less.
Literature cited
- Amchenkova AA, Bakeeva LE, Chentsov YS, Skulachev VP, Zorov DB. Coupling membranes as energy-transmitting cables. I. Filamentous mitochondria in fibroblasts and mitochondrial clusters in cardiomyocytes. J Cell Biol. 1988;107:481–95. doi: 10.1083/jcb.107.2.481. [DOI] [PMC free article] [PubMed] [Google Scholar]
- Ashley N, Harris D, Poulton J. Detection of mitochondrial DNA depletion in living human cells using PicoGreen staining. Exp Cell Res. 2005;303:432–46. doi: 10.1016/j.yexcr.2004.10.013. [DOI] [PubMed] [Google Scholar]
- Berns MW. A history of laser scissors (microbeams) Methods Cell Biol. 2007;82:1–58. doi: 10.1016/S0091-679X(06)82001-7. [DOI] [PubMed] [Google Scholar]
- Bunting JR. A test of the singlet oxygen mechanism of cationic dye photosensitization of mitochondrial damage. Photochem Photobiol. 1992;55:81–7. doi: 10.1111/j.1751-1097.1992.tb04212.x. [DOI] [PubMed] [Google Scholar]
- Cassidy-Stone A, Chipuk JE, Ingerman E, Song C, Yoo C, et al. Chemical inhibition of the mitochondrial division dynamin reveals its role in Bax/Bak-dependent mitochondrial outer membrane permeabilization. Dev Cell. 2008;14:193–204. doi: 10.1016/j.devcel.2007.11.019. [DOI] [PMC free article] [PubMed] [Google Scholar]
- Chen LB. Mitochondrial membrane potential in living cells. Annu Rev Cell Biol. 1988;4:155–81. doi: 10.1146/annurev.cb.04.110188.001103. [DOI] [PubMed] [Google Scholar]
- De Vos KJ, Allan VJ, Grierson AJ, Sheetz MP. Mitochondrial function and actin regulate dynamin-related protein 1-dependent mitochondrial fission. Curr Biol. 2005;15:678–83. doi: 10.1016/j.cub.2005.02.064. [DOI] [PubMed] [Google Scholar]
- De Vos KJ, Sable J, Miller KE, Sheetz MP. Expression of phosphatidylinositol (4,5) bisphosphate-specific pleckstrin homology domains alters direction but not the level of axonal transport of mitochondria. Mol Biol Cell. 2003;14:3636–49. doi: 10.1091/mbc.E02-10-0638. [DOI] [PMC free article] [PubMed] [Google Scholar]
- Detmer SA, Chan DC. Functions and dysfunctions of mitochondrial dynamics. Nat Rev Mol Cell Biol. 2007;8:870–9. doi: 10.1038/nrm2275. [DOI] [PubMed] [Google Scholar]
- Dickinson ME. Multiphoton and Multispectral Laser scanning microscopy. In: Goldman RD, Spector DL, editors. live cell imaging: A laboratory manual. Cold Spring Harbor laboratory press; 2005. [Google Scholar]
- Elmore SP, Nishimura Y, Qian T, Herman B, Lemasters JJ. Discrimination of depolarized from polarized mitochondria by confocal fluorescence resonance energy transfer. Arch Biochem Biophys. 2004;422:145–52. doi: 10.1016/j.abb.2003.12.031. [DOI] [PubMed] [Google Scholar]
- Frank S, Gaume B, Bergmann-Leitner ES, Leitner WW, Robert EG, et al. The role of dynamin-related protein 1, a mediator of mitochondrial fission, in apoptosis. Dev Cell. 2001;1:515–25. doi: 10.1016/s1534-5807(01)00055-7. [DOI] [PubMed] [Google Scholar]
- Goldstein JC, Waterhouse NJ, Juin P, Evan GI, Green DR. The coordinate release of cytochrome c during apoptosis is rapid, complete and kinetically invariant. Nat Cell Biol. 2000;2:156–62. doi: 10.1038/35004029. [DOI] [PubMed] [Google Scholar]
- Goodwin JS, Kenworthy AK. Photobleaching approaches to investigate diffusional mobility and trafficking of Ras in living cells. Methods. 2005;37:154–64. doi: 10.1016/j.ymeth.2005.05.013. [DOI] [PubMed] [Google Scholar]
- Karbowski M, Norris KL, Cleland MM, Jeong SY, Youle RJ. Role of Bax and Bak in mitochondrial morphogenesis. Nature. 2006;443:658–62. doi: 10.1038/nature05111. [DOI] [PubMed] [Google Scholar]
- Karbowski M, Youle RJ. Dynamics of mitochondrial morphology in healthy cells and during apoptosis. Cell Death Differ. 2003;10:870–80. doi: 10.1038/sj.cdd.4401260. [DOI] [PubMed] [Google Scholar]
- Khodjakov A, Rieder C, Mannella CA, Kinnally KW. Laser micro-irradiation of mitochondria: is there an amplified mitochondrial death signal in neural cells? Mitochondrion. 2004;3:217–27. doi: 10.1016/j.mito.2003.10.002. [DOI] [PubMed] [Google Scholar]
- Nicholls DG, Budd SL. Mitochondria and neuronal survival. Physiol Rev. 2000;80:315–60. doi: 10.1152/physrev.2000.80.1.315. [DOI] [PubMed] [Google Scholar]
- Nicholls DG, Ward MW. Mitochondrial membrane potential and neuronal glutamate excitotoxicity: mortality and millivolts. Trends Neurosci. 2000;23:166–74. doi: 10.1016/s0166-2236(99)01534-9. [DOI] [PubMed] [Google Scholar]
- O'Reilly CM, Fogarty KE, Drummond RM, Tuft RA, Walsh JV., Jr Quantitative analysis of spontaneous mitochondrial depolarizations. Biophys J. 2003;85:3350–7. doi: 10.1016/S0006-3495(03)74754-7. [DOI] [PMC free article] [PubMed] [Google Scholar]
- Okamoto K, Perlman PS, Butow RA. Targeting of green fluorescent protein to mitochondria. Methods Cell Biol. 2001;65:277–83. doi: 10.1016/s0091-679x(01)65017-9. [DOI] [PubMed] [Google Scholar]
- Partikian A, Olveczky B, Swaminathan R, Li Y, Verkman AS. Rapid diffusion of green fluorescent protein in the mitochondrial matrix. J Cell Biol. 1998;140:821–9. doi: 10.1083/jcb.140.4.821. [DOI] [PMC free article] [PubMed] [Google Scholar]
- Piston DW. Imaging living cells and tissues by two-photon excitation microscopy. Trends Cell Biol. 1999;9:66–9. doi: 10.1016/s0962-8924(98)01432-9. [DOI] [PubMed] [Google Scholar]
- Rizzuto R, Brini M, De Giorgi F, Rossi R, Heim R, et al. Double labelling of subcellular structures with organelle-targeted GFP mutants in vivo. Curr Biol. 1996;6:183–8. doi: 10.1016/s0960-9822(02)00451-7. [DOI] [PubMed] [Google Scholar]
- Scheffler IE. A century of mitochondrial research: achievements and perspectives. Mitochondrion. 2001;1:3–31. doi: 10.1016/s1567-7249(00)00002-7. [DOI] [PubMed] [Google Scholar]
- Skulachev VP. Mitochondrial filaments and clusters as intracellular power-transmitting cables. Trends Biochem Sci. 2001;26:23–9. doi: 10.1016/s0968-0004(00)01735-7. [DOI] [PubMed] [Google Scholar]
- Smiley ST, Reers M, Mottola-Hartshorn C, Lin M, Chen A, et al. Intracellular heterogeneity in mitochondrial membrane potentials revealed by a J-aggregate-forming lipophilic cation JC-1. Proc Natl Acad Sci U S A. 1991;88:3671–5. doi: 10.1073/pnas.88.9.3671. [DOI] [PMC free article] [PubMed] [Google Scholar]
- Ward MW, Rego AC, Frenguelli BG, Nicholls DG. Mitochondrial membrane potential and glutamate excitotoxicity in cultured cerebellar granule cells. J Neurosci. 2000;20:7208–19. doi: 10.1523/JNEUROSCI.20-19-07208.2000. [DOI] [PMC free article] [PubMed] [Google Scholar]
- Yu T, Robotham JL, Yoon Y. Increased production of reactive oxygen species in hyperglycemic conditions requires dynamic change of mitochondrial morphology. Proc Natl Acad Sci U S A. 2006;103:2653–8. doi: 10.1073/pnas.0511154103. [DOI] [PMC free article] [PubMed] [Google Scholar]