

Abstract
Adenosine A2a receptor antagonists reduce symptom severity in Parkinson disease (PD) and animal models. Rodent studies support the hypothesis that A2a antagonists produce this benefit by reducing the inhibitory output of the basal ganglia indirect pathway. One way to test this hypothesis in humans is to quantify regional pharmacodynamic responses with cerebral blood flow (CBF) imaging. That approach has also been proposed as a tool to accelerate pharmaceutical dose finding, but has not yet been applied in humans to drugs in development. We successfully addressed both these aims with a perfusion magnetic resonance imaging (MRI) study of the novel adenosine A2a antagonist SYN115. During a randomized, double-blind, placebo-controlled, crossover study in 21 PD patients on levodopa but no agonists, we acquired pulsed arterial spin labeling MRI at the end of each treatment period. SYN115 produced a highly significant decrease in thalamic CBF, consistent with reduced pallidothalamic inhibition via the indirect pathway. Similar decreases occurred in cortical regions whose activity decreases with increased alertness and externally focused attention, consistent with decreased self-reported sleepiness on SYN115. Remarkably, we also derived quantitative pharmacodynamic parameters from the CBF responses to SYN115. These results suggested that the doses tested were on the low end of the effective dose range, consistent with clinical data reported separately. We conclude that (1) SYN115 enters the brain and exerts dose-dependent regional effects, (2) the most prominent of these effects is consistent with deactivation of the indirect pathway as predicted by preclinical studies; and (3) perfusion MRI can provide rapid, quantitative, clinically relevant dose-finding information for pharmaceutical development.
Introduction
Measuring the sensitivity of a biological system to a drug is of significant interest not only as a topic of basic research, but also as a practical tool for pharmaceutical development, since dose-finding studies in humans are crucially important yet expensive and often take months or years. New approaches to measuring pharmacodynamic response are eagerly sought. One approach has been to image the organ of interest while applying pharmacological stimuli (rather than cognitive tasks or sensory stimuli). Pharmacological challenge imaging is especially relevant for studies of the brain (Herscovitch, 2001; Wise and Tracey, 2006; Lawrence and Mackey, 2008).
Pharmacological challenge imaging was applied very early in preclinical studies of the action of antiparkinsonian drugs (McCulloch and Harper, 1977; McCulloch et al., 1980b), and further studies clarified the neuronal pathways that led to the effects on cerebral blood flow (CBF) or metabolism and their alteration with parkinsonism or anesthestics (McCulloch, 1982; McCulloch et al., 1980a; Crosby et al., 1982; Trugman, 1995). This approach was extended to in vivo neuroimaging in humans (Grasby et al., 1993; Hershey et al., 1998; Black et al., 2005) and other primates (Perlmutter et al., 1993; Black et al., 1997; 2000; 2002a,b; Hershey et al., 2000). Even so, few pharmacological challenge studies produced dose–response information (Grasby et al., 1993; Perlmutter et al., 1993; Black et al., 1997, 2000, 2002a,b; Hershey et al., 2000; Ireland et al., 2005; Kofke et al., 2007; Bruns et al., 2009), and none provided quantitative characterization of a dose–response curve.
For technical reasons, blood oxygenation level-dependent (BOLD)-sensitive functional magnetic resonance imaging (fMRI) is difficult to apply to pharmacological challenge imaging (Iannetti and Wise, 2007), though several labs have performed pharmacological challenge fMRI in nonhuman species or for drugs with a short half-life (Chen et al., 1996, 1997, 2001; Ireland et al., 2005; Borsook et al., 2007; Bruns et al., 2009). Blood-flow MRI does not share the technical limitations of BOLD-sensitive methods, and it builds on the successes of blood-flow positron emission tomography (PET) in producing useful pharmacodynamic results (Herscovitch, 2001; Leslie and James, 2001). Recent studies have demonstrated the validity of applying perfusion MRI in humans to study existing drugs (Borsook et al., 2007; Kofke et al., 2007; MacIntosh et al., 2008; Bruns et al., 2009). However, practical and physiological issues have delayed useful applications; we have not located a published report of human pharmacological challenge perfusion MRI successfully applied to an investigational new drug.
A2a receptor antagonists are being studied eagerly as potential alternative treatments for Parkinson disease (PD) (Fuxe et al., 2007). A2a receptors colocalize on striatopallidal neurons with dopamine D2 and D3 receptors, which inhibit the so-called indirect basal ganglia pathway from striatum to thalamus via globus pallidus pars externa, subthalamic nucleus (STN), and internal pallidum (Strömberg et al., 2000; Torvinen et al., 2005). A2a antagonists produce some of the same biological effects as dopamine D2 and D3 agonists (Tanganelli et al., 2004), yet it is not known whether they also inhibit the indirect pathway, nor which “downstream” cortical and subcortical regions of human brain are most sensitive to A2a antagonism.
We used perfusion MRI to answer these scientific questions and to inform development of a new A2a receptor antagonist, SYN115. This work was presented in part at the annual meetings of the Society for Neuroscience, the American Academy of Neurology, and the Movement Disorders Society (Dickerson et al., 2009; Black et al., 2010a,b).
Materials and Methods
Regulatory approvals, registrations, and patient consent.
This study was approved by the Washington University Human Research Protection Office. Written documentation of informed consent was obtained in advance from each subject. Levodopa and SYN115 were given under U.S. Food and Drug Administration (FDA) Investigational New Drug Application 78,230.
The study was conducted at the Center for Clinical Imaging Research and the NeuroClinical Research Unit of Washington University School of Medicine (St. Louis, MO) and registered at http://clinicaltrials.gov (identifier, NCT00605553).
Study participants.
Twenty-one nondemented, nondepressed adults age 40–75 with mild idiopathic PD [Hoehn and Yahr (1967) stages 1–3], treated with a stable dose of levodopa but no dopamine agonists, participated in the study. Detailed inclusion and exclusion criteria were reported previously (Black et al., 2010c).
Study protocol.
In this crossover study, subjects were randomly assigned to one of two treatment sequences: those assigned to sequence 1 took SYN115 twice daily for a week, waited 1 week (washout period), and then took a matching placebo twice daily for a week; those assigned to sequence 2 participated in the reverse order (Fig. 1a). Subjects and staff were blind to SYN115-placebo sequence assignment. In 14 subjects, each SYN115 dose during the active treatment week was 60 mg, and in 12 subsequent subjects the dose was 20 mg. Five subjects who participated in the 60 mg placebo segment later participated in the 20 mg placebo segment, for a total of 21 distinct subjects.
Figure 1.

Study design (see Materials and Methods, Study Protocol for important details). a, Top, Schematic showing the temporal relationship of each subject's scan days to his or her taking active study drug and placebo. b, Bottom, Schematic showing each subject's participation on each of his or her two scan days. LD, Levodopa.
Subjects were evaluated on the last day of each treatment week (“scan days”) (Fig. 1b). Subjects had abstained from food and all forms of caffeine since the preceding evening. On the morning of the scan day, they did not take their usual antiparkinsonian medications, but they took the last dose of SYN115 or placebo at approximately 6:00 A.M. After arrival at the imaging center, subjects took 200 mg of carbidopa by mouth and then underwent two sets of clinical and MRI assessments, once before and once during an infusion of levodopa.
The intravenous levodopa infusion was dosed so as to rapidly produce and then maintain a steady plasma concentration of 600 ng/ml (Gordon et al., 2007). The infusion was delivered through small-bore light-resistant Luer lock tubing (part 537235PS; Medex) from a model 44 syringe pump (Harvard Apparatus) inside an RF-shielded copper box (Shielding Resources Group). The time-dependent infusion rate was controlled by custom software written in Java (Sun Microsystems) running on a small solid-state laptop computer (Eee PC 2G; Asus) connected to the pump's serial port. The pump was powered through an uninterruptible power supply (battery backup) inside the copper box so that the pump box could be moved with the patient without interrupting the infusion.
All MRI and clinical assessments were repeated while the maintenance levodopa infusion continued, beginning at least 25 min after the levodopa infusion started, i.e., after ∼4× the distribution half-life (t1/2α) of intravenous levodopa (Abraham et al., 2006). Blood samples for measuring plasma levodopa concentrations were taken from an upper extremity vein contralateral to the infusion site after the second assessment battery of each day.
The timing of the clinical and fMRI assessments before and on levodopa was planned to approximately bracket the Tmax of SYN115 (time to maximal plasma concentration) after chronic dosing.
Behavioral state during fMRI scans.
Each assessment battery mentioned above included eight perfusion MRI scans. Each perfusion scan was acquired during a single behavioral task condition: two scans while the subject fixated a central crosshair surrounded by a circular checkerboard pattern reversing at 8 Hz, two scans while the subject performed a two-back letter working memory task, and four control visual fixation scans with the crosshair but no checkerboard. The reversing checkerboard scans were done as a positive control for the arterial spin labeling (ASL) method so that if the study drug showed no activation we could test whether ASL, as implemented in this study, was adequately sensitive to changes in regional CBF (rCBF).
Quantification of plasma concentration of SYN115.
SYN115 plasma concentrations were determined using a validated high-performance liquid chromatography/tandem mass spectrometry (HPLC-MS/MS) assay (Frontage Laboratories). The method used protein precipitation of SYN115 from human plasma followed by HPLC separation and MS/MS detection, with a deuterated internal standard. Electrospray ionization and positive sample mode were used on an API 4000 and 5000 platform. All sample analysis runs used freshly prepared quality control samples. The assay was validated in the concentration range of 10–10,000 ng/ml.
MRI methods.
All MRI data were acquired on the Siemens 3.0T Tim Trio with a matrix head coil. ASL images were acquired with the commercial Siemens pulsed ASL sequence (Wang et al., 2003) with 15 echoplanar readout slices parallel to the bicommissural line, at a center-to-center distance of 6.0 mm, 64 × 64 voxels in plane with dimensions (3.4375 mm)2, a repetition time (TR) of 2.6 s, an echo time (TE) of 13.0 ms, and a flip angle of 90°. An M0 image was followed by 31 tag-control pairs for a total acquisition time for each ASL “scan” of 2.73 min. Brain structure was assessed by averaging two mutually registered sagittal magnetization-prepared rapid-acquisition gradient echo acquisitions with a voxel size of (1.0 mm)3, TR of 2.4 s, TE of 3.08 ms, inversion time of 1000 ms, and flip angle of 8°.
Creation of scaled CBF images.
The 63 frames of the ASL run were rigidly aligned using a validated method (Black et al., 2001) and summed to facilitate later alignment steps. Each frame was smoothed using a Gaussian filter with kernel measuring 7.35 mm [full-width at half-maximum (FWHM)], and CBF was computed in each voxel for each tag-control pair (Wang et al., 2003). The summed within-run-aligned echoplanar images were mutually aligned within each subject and summed, and the resulting image was affine registered to a target image in Talairach and Tournoux space made using validated methods from the structural MR images from these subjects (Black et al., 2004). From this registration, the 31 tag-control-pair CBF images were resampled into atlas space using matrix multiplication to avoid multiple resampling steps and averaged to create a single atlas-registered CBF image for each ASL run. One such image is shown in supplemental Figure 6 (available at www.jneurosci.org as supplemental material).
Only those voxels were analyzed that were represented in every echoplanar image in every subject. The combined volume of these voxels was 1,231 ml (supplemental Fig. 7, available at www.jneurosci.org as supplemental material). Global or whole-brain mean CBF (gCBF) was computed across these voxels so that gCBF was computed from the same brain region in every scan in every subject. However, for a given scan, voxels whose value was <20 or >120 ml · hg−1 · min−1 (i.e., physiologically unreasonable values) were excluded from this mean.
Regional analyses must account for possible changes in gCBF with drug to avoid incorrectly interpreting results (Black et al., 2002b). Thus, all analyses examining regional CBF removed the gCBF effect by scaling all input images multiplicatively so that the global mean CBF for every image was 50 ml · hg−1 · min−1. This conventional approach to blood-flow imaging was prespecified for this study from the outset. Thus, any decreases in regional CBF represent changes beyond that which could be explained by the overall change in whole-brain average, or global, CBF.
Statistical methods.
Our lab's standard approach to pharmacological activation analysis is to perform a voxelwise statistical parametric mapping (SPM) analysis to identify regional changes, using globally scaled CBF images only from placebo and the highest dose of drug (Black et al., 2004). This approach reduces the multiplicity of possible comparisons by assuming that the drug effects of most interest are those that are largest in magnitude (or most consistently present) at the highest dose of drug. Regions identified as having significantly altered rCBF with drug are then examined in images from lower doses.
In this study, we used a two-level, mixed-effects approach to analysis with the goal of identifying only effects likely to be representative of the entire population from which our subjects were sampled (Gläscher and Gitelman, 2008). First, for each subject in the study, changes in rCBF were identified from the 60 mg study arm using SPM8 software (www.fil.ion.ucl.ac.uk/spm/) and a voxelwise general linear model that included factors representing study drug (SYN115 vs placebo), levodopa (before vs during infusion), the drug by levodopa interaction, and task (i.e., behavioral state during the scan: two-back working memory, 8 Hz reversing circular checkerboard, or visual fixation). A statistical parametric image for each subject was generated from the drug contrast and a second one from the drug by levodopa contrast.
Statistical inference for the entire study was done across subjects in a second-level SPM analysis. The contrast images generated for each subject as described in the preceding paragraph were the input data for a voxelwise general linear model that included a covariate for subject age (in years) and factors for subject sex (male, female) and dose of SYN115 in the active capsules (20 or 60 mg). Statistical inference was performed at each voxel with a one-sample t test (i.e., testing across subjects whether the drug contrast subject images are significantly less than or greater than zero).
Multiple-comparisons correction was performed at the cluster level with the false discovery rate set at p = 0.05, according to our prespecified analysis strategy. However, to minimize type II error, we also list in supplemental Table 3 (available at www.jneurosci.org as supplemental material) all peaks with uncorrected p values <0.001. Highlighted entries in this table indicate peaks that would be considered significant by a different statistical criterion, such as single-voxel (magnitude-based) false discovery rate correction. In this data set, the Bonferroni correction would accept as significant all voxels with t > 4.8.
Approximate anatomical locations were provided by the Talairach Daemon client (www.talairach.org) (Lancaster et al., 2000), with corrections by reference to the study-specific MRI template atlas image.
Image sampling and VOI definition.
Local maxima (“peaks”) from significant clusters were selected for additional analysis. Mean rCBF values representing each peak were derived from a 12-mm-diameter spherical VOI centered at the peak. This diameter corresponds to the 10–12 mm resolution (FWHM) of the data as estimated by SPM. These VOIs were masked to include only voxels with t values exceeding the value corresponding to p < 0.001 (uncorrected) and only voxels represented in the final mask (supplemental Fig. 7, available at www.jneurosci.org as supplemental material).
Pharmacodynamic parameter estimation.
We estimated the classic pharmacodynamic parameters Emax (maximal effect) and EC50 (drug concentration in plasma that produces an effect equal to 50% · Emax) using custom software by Bretthorst (1988) that implements a Markov chain Monte Carlo simulation method. The equation is E(C) = E(0) + Emax · Cn / (EC50n + Cn), where n is the Hill coefficient (unitless) that controls the steepness of the sigmoid curve. The independent variable C is the plasma concentration in nanograms per milliliter of SYN115 sampled in the prelevodopa or on-levodopa state in which the corresponding ASL images were obtained. The dependent variable E, effect of drug, was each subject's fractional change in mean rCBF in the VOI centered at the SPM peak, relative to the prelevodopa value from that subject's placebo day (Eli Lilly and Company and NIH Chemical Genomics Center, 2008). Data from the 20 and 60 mg arms were considered together. Prior probabilities are given in supplemental Table 4 (available at www.jneurosci.org as supplemental material). The appropriateness of the pharmacodynamic model to these data was quantified by the probability that it better explained the data than a polynomial with the same number of free parameters.
Results
Every subject who took any dose of study drug or placebo completed every scheduled MRI scan at every assessment session, except for one subject who was discharged from the 20 mg arm of the study on the morning of the first assessment day because of noncompliance. This subject had already participated without error in the 60 mg arm but is not counted in the 12 subjects who completed the 20 mg arm. Thus, for all included subjects, all scheduled CBF scans were included in the analyses, for a total of 832 CBF scans (derived from 52,416 echoplanar image volumes).
Subjects were, on average, 60.8 years old (range, 44–73), had a 5.3 year mean duration of PD symptoms (range, 0.9–10.8), and 12 of the 21 had ever experienced dopa-induced dyskinesias. All were Caucasian and right-handed, and 8 of the 21 were women. Compliance was excellent as assessed by pill counts. The levodopa infusion produced plasma concentrations of 816 ± 168 ng/ml (mean ± SD), and plasma concentrations did not differ significantly between conditions (t test, p > 0.20).
Whole-brain blood-flow effects
SYN115 induced a small dose-dependent decrease in mean global CBF (20 mg, p.o., b.i.d., mean 4%, p < 0.001 by paired t test; 60 mg, p.o., b.i.d., 7%, p < 0.001). As noted in Materials and Methods, this change in gCBF with the drug was removed from the images before proceeding to the analyses described below.
Decreases in rCBF with SYN115
SYN115 induced highly significant decreases in regional CBF. Eight clusters met the predefined criteria for statistical significance after correction for multiple comparisons (Table 1). The first cluster (corrected p < 10−31) had its peak t value in thalamus but also extended into midbrain, precuneus, cuneus, and cerebellum (Fig. 2a,d). Volumes of interest (VOIs) from seven t value local maxima (“peaks”) from this cluster were selected for additional analysis (left and right thalamus, left and right midbrain, precuneus [Brodmann's area (BA) 7, BA 31], and posterior cingulate [BA 30]), as described in Materials and Methods; atlas coordinates for the center of each VOI are given in supplemental Table 3 (available at www.jneurosci.org as supplemental material). Figure 2c highlights the peak voxel from cluster 2. For completeness, supplemental Table 3 (available at www.jneurosci.org as supplemental material) lists every local maximum in the thresholded |t| image that was separated from other maxima by ≥8 mm). To check the specificity of our results, we repeated the analysis using only those CBF scans acquired off levodopa during the visual fixation condition; results were similar (supplemental Fig. 8, available at www.jneurosci.org as supplemental material).
Table 1.
Significant decreases in rCBF on the higher dose of SYN115 compared with placebo
| Cluster | Volume of cluster (in ml) | Peak t value (11 df) | Location of peak t value | Anatomic description of cluster |
|---|---|---|---|---|
| 1 | 51.4 | 19.51 | Right dorsomedial thalamus | Bilateral thalamus, precuneus (BA 7, 23, 31), midbrain, cuneus (BA 7, 18), posterior cingulate (BA 23, 29, 30) |
| 2 | 12.1 | 14.27 | Right anterior cingulate cortex (BA 32) | Bilateral anterior cingulate (BA 32), medial frontal gyrus (BA 9, 11) |
| 3 | 9.7 | 9.59 | Left prefrontal cortex (lateral to BA 32) | Left middle and inferior gyri (BA 8, 9, 45, 46), precentral gyrus (BA 44) |
| 4 | 8.7 | 7.74 | Left middle frontal gyrus (BA 6) | Left middle and precentral gyri (BA 6, 4) |
| 5 | 2.8 | 6.81 | Right postcentral gyrus (BA 2) | Right postcentral gyrus (BA 2) |
| 6 | 2.8 | 6.71 | Left superior parietal lobule (BA 7) | Left superior parietal lobule (BA 7) |
| 15 | 1.4 | 5.45 | Right precentral gyrus (BA 6) | Right precentral and medial frontal gyri (BA 6) |
| 22 | 0.9 | 4.90 | Right medial frontal gyrus (BA 9) | Right medial frontal gyrus (BA 9) |
See supplemental Table 3 (available at www.jneurosci.org as supplemental material) for additional details.
Figure 2.

a, Statistical image (color) representing the |t| values from the contrast (rCBF on SYN115 60 mg, b.i.d.) < (rCBF on placebo), laid over the study-specific MRI template image (grayscale). The right side of the brain is displayed on the right side of the coronal image and the bottom of the axial image. The color t image shows all voxels for which |t| ≥ 4.03 (corresponding to p < 0.001, uncorrected). The orthogonal hairlines in each cross section identify the location of the other two cross sections and cross at the voxel in right thalamus with the highest |t| in the whole image (19.51; 11 df). b, Dose-dependent decrease in rCBF with SYN115 in the right and left thalamus VOIs defined as described in Materials and Methods. c, d, The same image and conventions described in a, with different cross sections chosen to display other peak |t| values. c, Hairlines cross at the peak |t| value from cluster 2. d, Hairlines cross at the local peak that defined VOI 3 from cluster 1 (in precuneus). For coordinates and anatomical descriptions, see Table 1 and supplemental Table 3 (available at www.jneurosci.org as supplemental material).
As mentioned, the most statistically significant decreases in blood flow with 60 mg b.i.d. SYN115 occurred in bilateral thalamus (Fig. 2a). The rCBF changes at these regions were dose responsive (Fig. 2b). The decreases in the right thalamus VOI were even larger in the original images, before removing the whole-brain (mean global) CBF decrease (20 mg, −10.4%; 60 mg, −19.0%).
Dose responsiveness of rCBF decreases
The regions with decreased rCBF were identified using only the images acquired in subjects who took the higher dose of SYN115. Nevertheless, across the 20 VOIs listed in Table 2, the rCBF decreases were consistently greater in magnitude at the higher dose than at the lower dose (before levodopa, 18 of 20 VOIs; after levodopa, 20 of 20 VOIs). We performed secondary SPM analyses to test whether this dose-responsive pattern was an artifact of selecting the VOIs from the higher-dose group only and concluded that it was not (results from an analysis of the five subjects who had data from both doses of active drug are given in supplemental Table 5, available at www.jneurosci.org as supplemental material, and results from a similar analysis across both dose groups are in supplemental Table 6, available at www.jneurosci.org as supplemental material).
Table 2.
Pharmacodynamic parameters calculated from SYN115 blood levels and corresponding rCBF changes
| VOI | Atlas coordinate | Name | SYN115 only |
SYN115 + levodopa |
|||||||||||
|---|---|---|---|---|---|---|---|---|---|---|---|---|---|---|---|
| EC50 | Emax | n | Prob. model | Prob. poly | EC50 | Emax | n | E0 | Prob. model | Prob. poly | |||||
| 1 | 10.5 | −21 | 12 | Right thalamus | 966 | −30 | 0.95 | 0.94 | 0.06 | 917 | −16 | 4.03 | −1.8 | 0.96 | 0.04 |
| 2 | −7.5 | −18 | 12 | Left thalamus | 942 | −29 | 1.07 | 0.92 | 0.08 | 779 | −15 | 7.10 | −1.2 | 1.00 | 0.00 |
| 3 | 13.5 | −66 | 36 | Precuneus, BA 7 | 460 | −13 | 8.47 | 0.96 | 0.04 | 1113 | −17 | 1.85 | −2.6 | 0.96 | 0.04 |
| 4 | 1.5 | −33 | −3 | Midbrain | 202 | −15 | 1.05 | 0.92 | 0.08 | 1344 | −12 | 4.24 | −2.5 | 0.94 | 0.06 |
| 5 | 19.5 | −69 | 18 | Precuneus, BA 31 | 220 | −7 | 2.34 | 0.88 | 0.13 | 495 | −11 | 8.32 | 1.2 | 0.96 | 0.04 |
| 6 | 10.5 | −27 | −15 | Midbrain | 1044 | −32 | 1.78 | 1.00 | 0.00 | 1018 | −21 | 4.31 | 1.9 | 0.98 | 0.02 |
| 7 | −4.5 | −51 | 18 | Posterior cingulate, BA 30 | 208 | −15 | 0.80 | 0.88 | 0.13 | 947 | −7 | 4.11 | −7.1 | 0.98 | 0.02 |
| 8 | −7.5 | 45 | 9 | Anterior cingulate, BA 32 | 717 | −12 | 7.88 | 0.98 | 0.02 | 713 | −15 | 9.79 | 1.0 | 1.00 | 0.00 |
| 9 | 1.5 | 30 | 33 | Medial frontal gyrus, BA 9 | 699 | −8 | 7.45 | 0.92 | 0.08 | 831 | −3 | 1.71 | −6.4 | 0.96 | 0.04 |
| 10 | 10.5 | 45 | −12 | Medial frontal gyrus, BA 11 | 808 | −6 | 1.62 | 0.98 | 0.02 | 939 | −9 | 3.27 | 0.6 | 0.98 | 0.02 |
| 11 | 4.5 | 12 | 33 | Cingulate gyrus, BA 32 | 1449 | −12 | 3.51 | 0.98 | 0.02 | 1525 | −9 | 3.05 | 2.0 | 0.98 | 0.02 |
| 12 | −7.5 | 21 | 39 | Middle frontal gyrus, BA 8 | 825 | −20 | 1.45 | 0.92 | 0.08 | 1031 | −10 | 2.42 | −4.9 | 0.98 | 0.02 |
| 13 | −4.5 | 6 | 51 | Middle frontal gyrus, BA 6 | 1080 | −18 | 2.44 | 0.96 | 0.04 | 874 | −19 | 3.33 | −1.2 | 0.98 | 0.02 |
| 14 | 7.5 | −36 | 60 | Postcentral gyrus, BA 2 | 643 | −14 | 1.13 | 0.90 | 0.10 | 1281 | −25 | 3.89 | 2.2 | 1.00 | 0.00 |
| 15 | −7.5 | −60 | 63 | Superior parietal lobule, BA 7 | 623 | −14 | 2.07 | 0.96 | 0.04 | 829 | −11 | 3.33 | 2.3 | 0.98 | 0.02 |
| 16 | 7.5 | −78 | 12 | Cuneus, BA 17 | 210 | −7 | 1.50 | 0.92 | 0.08 | 465 | −8 | 7.30 | −1.2 | 0.96 | 0.04 |
| 17 | −4.5 | −33 | −9 | Parahippocampal gyrus, BA 36 | 625 | −6 | 6.06 | 0.98 | 0.02 | 664 | −9 | 1.83 | 2.7 | 0.98 | 0.02 |
| 18 | −13.5 | −15 | 63 | Precentral gyrus, BA 6 | 1014 | −17 | 2.92 | 0.96 | 0.04 | 716 | −34 | 2.83 | 9.1 | 1.00 | 0.00 |
| 19 | −13.5 | −9 | −18 | Temporal lobe, BA 20 | 502 | −15 | 2.77 | 0.98 | 0.02 | 1138 | −21 | 3.70 | 1.0 | 1.00 | 0.00 |
| 20 | −16.5 | 15 | 3 | Head of right caudate | 541 | −13 | 3.36 | 0.94 | 0.06 | 984 | −21 | 5.15 | −0.1 | 1.00 | 0.00 |
For details, see Materials and Methods, Pharmacodynamic parameter estimation. LD, Levodopa; Prob. model, probability of full model; Prob. poly, probability of polynomial. For VOIs, numbers are from the penultimate column in supplemental Table 3 (available at www.jneurosci.org as supplemental material); for example, VOI 8 is centered at the peak |t| value in cluster 2.
Quantifying SYN115 potency
The placebo/20 mg/60 mg dose–response plot does not allow estimation of EC50. We exploited the inherent pharmacokinetic variability across subjects to create a group concentration-response curve (Fig. 3) for the rCBF change in each of the VOIs identified in supplemental Table 3 (available at www.jneurosci.org as supplemental material) and Table 2. We summarize here the results from thalamus and midbrain VOIs. In each case, the pharmacodynamic model was the more appropriate model (probability, 92–100%) (Table 2). In the before-levodopa state, the estimated maximum possible SYN115 effect on rCBF (Emax) was a 29–30% decrease in thalamus and a 15–32% decrease in midbrain. Left midbrain (near superior colliculus; EC50 = 202 ng/ml) was more sensitive than thalamus (EC50 = 942–966 ng/ml) and right midbrain (near substantia nigra pars reticulata and pons, 1044 ng/ml). The Hill coefficient n was ∼1 for these VOIs, indicating a gradual increase in signal magnitude as blood concentration rises (Fig. 3, open double-line curve). The model ascribed a small effect on blood flow in these regions to levodopa itself (indicated by the nonzero E0 entries in Table 2). In scans acquired during the levodopa infusion, the rCBF response to SYN115 changed more sharply over a narrower range of SYN115 concentrations (n = 4.03–7.10) (Fig. 3, solid curve), and thus the concentrations actually observed in our study came closer to producing the maximal predicted rCBF response (Emax).
Figure 3.

The pharmacokinetic variability across subjects was exploited to create a population dose–response curve for the rCBF change in the right dorsomedial thalamus VOI. For additional details, see Results, Quantifying SYN115 potency for decreasing rCBF as a function of plasma concentration.
Increases in rCBF with SYN115 and levodopa effects
No statistically significant clusters were found for relative increases in rCBF with SYN115 or for the drug by levodopa interaction. The study was not designed to examine changes in rCBF with levodopa, and an SPM analysis found no significant decreases, but rCBF increased significantly with levodopa in one small cluster with peak values in the right putamen, claustrum, and insula (supplemental Table 8, available at www.jneurosci.org as supplemental material).
Discussion
The A2a antagonist SYN115 substantially decreased CBF in mediodorsal thalamus, midbrain, precuneus, and cingulate cortex. Since direct vascular effects would apply to all regions of the brain, the most likely explanation for the regionally specific CBF effects is that SYN115 crosses the blood–brain barrier and alters neuronal firing. The dose-responsive nature of the rCBF effects strongly suggests that they reflect pharmacological effects of SYN115 in the brain.
Perfusion MRI in pharmaceutical development
The results answer the primary questions posed in the introduction: SYN115 causes pharmacodynamic effects in the brain, and they are greater at the higher dose. The quantitative EC50 estimates (Fig. 3, Table 2) suggest that an even higher dose may be more effective in terms of thalamic CBF response and perhaps also clinically. Confirmation of that hypothesis will require a large clinical study, but in this study a measure of motor speed improved significantly only on the higher dose of SYN115 (Black et al., 2010c).
Kofke et al. (2007) reported CBF effects of remifentanil, an FDA-approved opioid agonist, at three doses in six human brain regions chosen a priori, and similar results were reported in other species (see Introduction). However, to our best knowledge, no previous pharmacological challenge neuroimaging study has calculated quantitative EC50 values.
Physiological interpretation
An important question is which neurons are responsible for these rCBF changes. Numerous studies provide evidence that the metabolic response to stimulation of a neuron occurs primarily at the axon termini (Buzsáki et al., 2007), including a [18F]fluorodeoxyglucose PET study in PD patients whose globus pallidus internal segment electrical activity was measured invasively (Eidelberg et al., 1997). Thus, rCBF changes most likely reflect changes in the firing of afferent neurons. With this principle in mind, Figure 4 shows how the known pharmacology and anatomy of the basal ganglia predict this study's most significant result (supplemental Table 7, available at www.jneurosci.org as supplemental material). These results also accord with an 8–12% increase in thalamic glucose metabolism in untreated PD and the reduction of this increase by antiparkinsonian treatments (Ma et al., 2009).
Figure 4.

Expected effects in the indirect pathway of giving an A2a antagonist. See also Discussion, Physiological interpretation of results, and supplemental Table 7 (available at www.jneurosci.org as supplemental material). GPe, Globus pallidus, pars externa; GPi, globus pallidus, pars interna.
After thalamus, the brain regions most significantly affected by SYN115 were the anterior cingulate (BA 32) and precuneus (BA 7, BA 23, and BA 31) (Fig. 2c,d; supplemental Table 3, available at www.jneurosci.org as supplemental material). The precuneus has several distinctive properties: in the fully awake alert state, it consumes ∼35% more glucose by weight than any other human cortical region (Gusnard et al., 2001), and its metabolism and rCBF decrease markedly in various states of reduced or absent consciousness (e.g., slow-wave sleep, propofol-induced anesthesia, and vegetative states) (Cavanna and Trimble, 2006). This may be relevant since SYN115 at 60 mg p.o. b.i.d. decreased self-reported sleepiness (Campbell et al., 2010). The precuneus and anterior cingulate are also key components of the default-mode network, a network of brain regions with high tonic activity at rest that is significantly attenuated during goal-directed tasks (Raichle et al., 2001). Dopamine D2 and D3 agonists reduced rCBF in these regions (Fig. 5), and a recent report suggested a dopaminergic link between attention and precuneus deactivation (Tomasi et al., 2010). In fact, an fMRI study reported anomalous precuneus and adjacent posterior cingulate responses in PD patients, compared to control subjects, during performance of an executive function task (van Eimeren et al., 2009).
Figure 5.
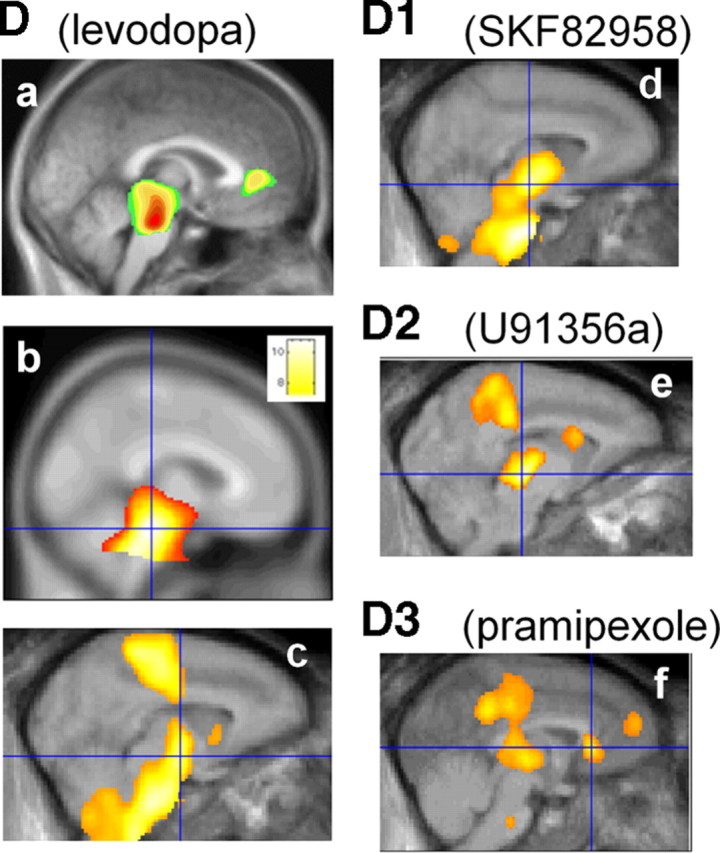
Regional CBF responses to levodopa and to specific dopamine receptor agonists from previous studies. Note the midbrain response in all studies and the thalamus and posterior cingulate responses in the D2 and D3 agonist studies. a, Levodopa/carbidopa in PD and healthy controls (Hershey et al., 1998). b, Levodopa/carbidopa in advanced PD (Black et al., 2005). c, Levodopa/carbidopa in baboon (Hershey et al., 2000). d, Dopamine D1 agonist SKF82958 in baboon (Black et al., 2000). e, Dopamine D2 agonist U91356a in baboon (Black et al., 2002a). f, Dopamine D3 > D2 agonist pramipexole in baboon (Black et al., 2002b). c and d are from additional, unpublished analyses of the data collected for the publications named above.
Comparison with caffeine effects
Most existing data on CBF effects of adenosine blockade come from studies of the nonspecific adenosine receptor antagonist caffeine. Caffeine has complex effects on cerebral metabolism and blood flow, so it is important to consider how, or whether, they inform interpretation of the results with a specific A2a antagonist.
Adenosine increases CBF (Joshi et al., 2002), whereas caffeine decreases CBF by ∼30% (Cameron et al., 1990; Perthen et al., 2008). This CBF decrease is fairly uniform throughout the brain (Mathew et al., 1983; Mathew and Wilson, 1985; Gotoh et al., 2001; Cameron et al., 1990) and unrelated to changes in respiration (Cameron et al., 1990; Mathew et al., 1983). This effect has been detected with ASL (Laurienti et al., 2003; Liu et al., 2004; Bendlin et al., 2007; Perthen et al., 2008). Metabolic studies show that direct vascular effects may produce this CBF decrease, since caffeine actually increased glucose utilization (Grome and Stefanovich, 1986; Schroeder et al., 1989; Nehlig et al., 1994; Gotoh et al., 2001). This uncoupling of CBF from metabolism led to a period of interest in the use of caffeine as a BOLD signal booster, though later work has been less enthusiastic. The uncoupling is likely mediated by adenosine receptors, since another nonspecific antagonist replicated the effect (theophylline) (Grome and Stefanovich, 1986). For these reasons, cerebral metabolism may be more informative than CBF about the effects of caffeine on local neuronal activity. Regional effects of caffeine on cerebral glucose metabolism are strongest and most potent in dopamine-influenced brain regions such as habenula, caudate, ventral tegmental area, amygdala, and medial and lateral thalamus (Nehlig et al., 1994; Nehlig and Boyet, 2000, their Table 2; Gotoh et al., 2001, their Fig. 3).
However, caffeine's effects probably differ substantially from those of specific A2a antagonists. The metabolic increases induced by caffeine appear to be mediated by A1 receptors on neurons, whereas its global effects on blood flow are likely mediated by vascular A2a receptors (Blood et al., 2003; Kochanek et al., 2005). This mechanism is presumably responsible for the modest global decrease in CBF caused by SYN115.
Regional brain effects of specific A2a antagonists
Crucially, A2a receptors also occur on neurons, and selective A2a antagonists exert clinical, electrophysiological, and metabolic effects. Therefore, one also expects regionally specific CBF effects caused by the neuronal actions of the drug, and these must be identified separately from the known direct vascular effects, which are global in nature. We contend that we have accomplished this for the first time in humans in the present study, but data from other species support our results. The A2a antagonist DMPX (3,7-dimethyl-1-propargylxanthine) decreased glucose utilization in the rodent globus pallidus (Nehlig et al., 1994), consistent with the finding that A2a antagonists reduce striatopallidal firing (Strömberg et al., 2000). DMPX also decreased regional blood volume by 6–10% in thalamus, striatum, and olfactory tubercle (Chen et al., 2005).
The rCBF changes shown in Figure 2 are comparable to those seen in 2DG and PET studies of dopamine agonists or levodopa (Fig. 5). The regions of brain most sensitive to D2 and D3 receptor agonists included midbrain, posterior cingulate cortex, prefrontal cortex, striatum, and thalamus (Trugman et al., 1991; Hershey et al., 1998, 2000; Black et al., 2000, 2002b, 2005). This correspondence may be expected given that A2a antagonists are thought to produce antiparkinsonian activity via facilitation of dopamine D2/D3 receptor effects.
Limitations
Crossover trial designs are susceptible to carryover effects. However, carryover effects are very unlikely in this study: on the placebo day, subjects either received no previous SYN115 or discontinued it >20 half-lives earlier.
Although the most significant result, decreased thalamic rCBF, is consistent with inhibition of the indirect pathway, that model does not predict all our results. No significant rCBF increase was detected in the STN, though partial volume effects may have hindered detection of CBF changes in this small nucleus (Borghammer et al., 2009). Furthermore, the classical basal ganglia model does not predict the rCBF decrease observed in cortex. However, neither does it predict the similar cortical rCBF decrease observed with D2 and D3 dopamine agonists (Fig. 5e,f). This observation lends credence to the idea that cortical rCBF responses are more complex than the indirect pathway model alone can predict. After all, most cortical areas receive input from cortical areas including homologous contralateral cortex and local recurrent axons and interneurons (supplemental Table 7, available at www.jneurosci.org as supplemental material). One may even speculate that the cortical rCBF changes found in this study may prove to have predictive value in identifying medications with effects similar to those of dopamine D2 and D3 agonists.
Study participants self-selected for willingness to participate in research and met strict exclusion criteria. Nevertheless, they are clinically typical and had a range of levodopa dosing and comorbid conditions, so these results probably reflect early stage PD generally. The study also excluded patients taking dopamine agonists, but this exclusion strengthens confidence in our interpretation that SYN115 itself is responsible for the pallidothalamic inhibition seen here, rather than a possible interaction of SYN115 with a long-acting D2/D3 agonist.
Finally, we studied patients exposed to SYN115 for 1 week, and single doses or chronic dosing may show additional or different effects. These limitations should be balanced against the strengths of this work, including careful experimental design and a conservative statistical analysis.
Implications
These results suggest hypotheses about how adenosine A2a antagonists may exert antiparkinsonian or alerting effects and identify brain regions to which electrophysiological methods may be directed to test these hypotheses. Additionally, these results demonstrate the potential for pharmacological challenge perfusion imaging to jump-start human dose selection in pharmaceutical development. This study provided dose-finding information quite rapidly compared with a typical clinical trial, and from relatively few subjects.
Footnotes
This work was supported by a Synosia Therapeutics contract to Washington University (K.J.B.), with infrastructure support from the National Institutes of Health (Grants C06 RR020092, UL1 RR024992, P30 NS048056, U54 CA136398-02900209), the American Parkinson Disease Association (APDA) Advanced Research Center for Parkinson Disease at Washington University, and the Greater St. Louis Chapter of the APDA. We gratefully acknowledge the assistance of Mary L. Creech, Wesley Dickerson, Nathan Koller, Alexander Haas, Darain Mitchell, Pat Deppen, Melissa Ammel, and Betsy Thomas (patient assessment, treatment, and record keeping); G. Larry Bretthorst (Bayesian statistical analysis); Abraham Z. Snyder (guidance during development of the image registration scheme); Robert C. McKinstry III (consultation on MRI methods); Scott Love and Mark Nolte (MRI acquisition); Susan Loftin (levodopa concentrations); Chris Resburg (clinical study management); and especially the volunteer study subjects with Parkinson disease.
S.I.B. is an employee of Sponsor. K.J.B. and M.C.C. performed personal consulting for Sponsor, less than $10,000.
References
- Abraham N, Karimi M, Devine C, Black KJ. The human experience with intravenous levodopa. Paper presented at the World Parkinson Congress; February; Washington, DC. 2006. [Google Scholar]
- Bendlin BB, Trouard TP, Ryan L. Caffeine attenuates practice effects in word stem completion as measured by fMRI BOLD signal. Hum Brain Mapp. 2007;28:654–662. doi: 10.1002/hbm.20295. [DOI] [PMC free article] [PubMed] [Google Scholar]
- Black KJ, Gado MH, Perlmutter JS. PET measurement of dopamine D2 receptor-mediated changes in striatopallidal function. J Neurosci. 1997;17:3168–3177. doi: 10.1523/JNEUROSCI.17-09-03168.1997. [DOI] [PMC free article] [PubMed] [Google Scholar]
- Black KJ, Hershey T, Gado MH, Perlmutter JS. Dopamine D1 agonist activates temporal lobe structures in primates. J Neurophysiol. 2000;84:549–557. doi: 10.1152/jn.2000.84.1.549. [DOI] [PubMed] [Google Scholar]
- Black KJ, Snyder AZ, Koller JM, Gado MH, Perlmutter JS. Template images for nonhuman primate neuroimaging: 1. Baboon. NeuroImage. 2001;14:736–743. doi: 10.1006/nimg.2001.0752. [DOI] [PubMed] [Google Scholar]
- Black KJ, Hershey T, Koller JM, Carl JL, Perlmutter JS. Mapping and quantification of dopamine D2 receptor activation. J Neuropsychiatr Clin Neurosci. 2002a;14:118–119. [Google Scholar]
- Black KJ, Hershey T, Koller JM, Videen TO, Mintun MA, Price JL, Perlmutter JS. A possible substrate for dopamine-related changes in mood and behavior: prefrontal and limbic effects of a D3-preferring dopamine agonist. Proc Natl Acad Sci U S A. 2002b;99:17113–17118. doi: 10.1073/pnas.012260599. [DOI] [PMC free article] [PubMed] [Google Scholar]
- Black KJ, Koller JM, Snyder AZ, Perlmutter JS. Atlas template images for nonhuman primate neuroimaging: baboon and macaque. In: Conn PM, editor. Methods in Biological Imaging A. New York: Elsevier; 2004. pp. 91–102. [DOI] [PubMed] [Google Scholar]
- Black KJ, Hershey T, Hartlein JM, Carl JL, Perlmutter JS. Levodopa challenge neuroimaging of levodopa-related mood fluctuations in Parkinson's disease. Neuropsychopharmacology. 2005;30:590–601. doi: 10.1038/sj.npp.1300632. [DOI] [PubMed] [Google Scholar]
- Black KJ, Koller JM, Campbell MC, Bandak SI. Perfusion MRI in Parkinson disease reveals pharmacodynamics of the adenosine A2a antagonist SYN115. Neurology. 2010a;74(Suppl 2):A394. [Google Scholar]
- Black KJ, Koller JM, Campbell MC, Bandak SI. Quantitative measurement of indirect pathway [de]activation and default mode network deactivation by the adenosine A2a antagonist SYN115 in Parkinson's disease. Mov Disord. 2010b;25(Suppl 2):S373–S374. [Google Scholar]
- Black KJ, Campbell MC, Dickerson W, Creech ML, Koller JM, Chung S, Bandak SI. A randomized, double-blind, placebo-controlled cross-over trial of the adenosine 2a antagonist SYN115 in Parkinson disease. Neurology. 2010c;74(Suppl 2):A317. [Google Scholar]
- Blood AB, Hunter CJ, Power GG. Adenosine mediates decreased cerebral metabolic rate and increased cerebral blood flow during acute moderate hypoxia in the near-term fetal sheep. J Physiol. 2003;553:935–945. doi: 10.1113/jphysiol.2003.047928. [DOI] [PMC free article] [PubMed] [Google Scholar]
- Borghammer P, Cumming P, Aanerud J, Gjedde A. Artefactual subcortical hyperperfusion in PET studies normalized to global mean: Lessons from Parkinson's disease. NeuroImage. 2009;45:249–257. doi: 10.1016/j.neuroimage.2008.07.042. [DOI] [PubMed] [Google Scholar]
- Borsook D, Penske G, Aiello-Lammens M, Glicksman M, Gostic J, Sherman S, Korn J, Shaw M, Stewart K, Gostic R, Bazes S, Hargreaves R, Becerra L. CNS response to a thermal stressor in human volunteers and rats may predict the clinical utility of analgesics. Drug Dev Res. 2007;68:23–41. [Google Scholar]
- Bretthorst GL. Bayesian spectrum analysis and parameter estimation. New York: Springer; 1988. [Google Scholar]
- Bruns A, Kunnecke B, Risterucci C, Moreau JL, von Kienlin M. Validation of cerebral blood perfusion imaging as a modality for quantitative pharmacological MRI in rats. Magn Reson Med. 2009;61:1451–1458. doi: 10.1002/mrm.21779. [DOI] [PubMed] [Google Scholar]
- Buzsáki G, Kaila K, Raichle M. Inhibition and brain work. Neuron. 2007;56:771–783. doi: 10.1016/j.neuron.2007.11.008. [DOI] [PMC free article] [PubMed] [Google Scholar]
- Cameron OG, Modell JG, Hariharan M. Caffeine and human cerebral blood flow: a positron emission tomography study. Life Sci. 1990;47:1141–1146. doi: 10.1016/0024-3205(90)90174-p. [DOI] [PubMed] [Google Scholar]
- Campbell MC, Koller JM, Bandak SI, Black KJ. Cognition in Parkinson disease: effects of levodopa and an adenosine A2a antagonist. J Int Neuropsychol Soc. 2010;16(Suppl S1):46. [Google Scholar]
- Cavanna AE, Trimble MR. The precuneus: a review of its functional anatomy and behavioural correlates. Brain. 2006;129:564–583. doi: 10.1093/brain/awl004. [DOI] [PubMed] [Google Scholar]
- Chen Q, Andersen AH, Zhang Z, Ovadia A, Gash DM, Avison MJ. Mapping drug-induced changes in cerebral R2* by multiple gradient recalled echo functional MRI. Magn Reson Imaging. 1996;14:469–476. doi: 10.1016/0730-725x(95)02100-8. [DOI] [PubMed] [Google Scholar]
- Chen YC, Galpern WR, Brownell A-L, Matthews RT, Bogdanov M, Isacson O, Keltner JR, Beal MF, Rosen BR, Jenkins BG. Detection of dopaminergic neurotransmitter activity using pharmacologic MRI: correlation with PET, microdialysis, and behavioral data. Magn Reson Med. 1997;38:389–398. doi: 10.1002/mrm.1910380306. [DOI] [PubMed] [Google Scholar]
- Chen YC, Mandeville JB, Nguyen TV, Talele A, Cavagna F, Jenkins BG. Improved mapping of pharmacologically induced neuronal activation using the IRON technique with superparamagnetic blood pool agents. J Magn Reson Imaging. 2001;14:517–524. doi: 10.1002/jmri.1215. [DOI] [PubMed] [Google Scholar]
- Chen YI, Choi JK, Jenkins BG. Mapping interactions between dopamine and adenosine A2a receptors using pharmacologic MRI. Synapse. 2005;55:80–88. doi: 10.1002/syn.20091. [DOI] [PubMed] [Google Scholar]
- Crosby G, Crane AM, Sokoloff L. Local changes in cerebral glucose utilization during ketamine anesthesia. Anesthesiology. 1982;56:437–443. doi: 10.1097/00000542-198206000-00005. [DOI] [PubMed] [Google Scholar]
- Dickerson W, Bandak SI, Campbell MC, Koller JM, Haas A, Black KJ. The adenosine 2a antagonist SYN115 decreases thalamic rCBF in Parkinson disease. Soc Neurosci Abstr. 2009;35:504–2. [Google Scholar]
- Eidelberg D, Moeller JR, Kazumata K, Antonini A, Sterio D, Dhawan V, Spetsieris P, Alterman R, Kelly PJ, Dogali M, Fazzini E, Beric A. Metabolic correlates of pallidal neuronal activity in Parkinson's disease. Brain. 1997;120:1315–1324. doi: 10.1093/brain/120.8.1315. [DOI] [PubMed] [Google Scholar]
- Eli Lilly and Company, NIH Chemical Genomics Center. Determination of EC50/IC50: models and curve fitting guidelines. 2008. Retrieved September 3, 2009, from http://www.ncgc.nih.gov/guidance/section3.html#determination.
- Fuxe K, Ferre S, Genedani S, Franco R, Agnati LF. Adenosine receptor-dopamine receptor interactions in the basal ganglia and their relevance for brain function. Physiol Behav. 2007;92:210–217. doi: 10.1016/j.physbeh.2007.05.034. [DOI] [PubMed] [Google Scholar]
- Gläscher J, Gitelman D. Contrast weights in flexible factorial design with multiple groups of subjects. 2008. Retrieved May 10, 2010, from https://www.jiscmail.ac.uk/cgi-bin/webadmin?A2=ind0803&L=SPM&P=R16629.
- Gordon M, Markham J, Hartlein JM, Koller JM, Loftin S, Black KJ. Intravenous levodopa administration in humans based on a two-compartment kinetic model. J Neurosci Methods. 2007;159:300–307. doi: 10.1016/j.jneumeth.2006.07.010. [DOI] [PubMed] [Google Scholar]
- Gotoh J, Kuang TY, Nakao Y, Cohen DM, Melzer P, Itoh Y, Pak H, Pettigrew K, Sokoloff L. Regional differences in mechanisms of cerebral circulatory response to neuronal activation. Am J Physiol Heart Circ Physiol. 2001;280:H821–H829. doi: 10.1152/ajpheart.2001.280.2.H821. [DOI] [PubMed] [Google Scholar]
- Grasby PM, Friston KJ, Bench CJ, Cowen PJ, Frith CD, Liddle PF, Frackowiak RS, Dolan RJ. The effect of the dopamine agonist, apomorphine, on regional cerebral blood flow in normal volunteers. Psychol Med. 1993;23:605–612. doi: 10.1017/s0033291700025381. [DOI] [PubMed] [Google Scholar]
- Grome JJ, Stefanovich V. Differential effects of methylxanthines on local cerebral blood flow and glucose utilization in the conscious rat. Naunyn Schmiedebergs Arch Pharmacol. 1986;333:172–177. doi: 10.1007/BF00506522. [DOI] [PubMed] [Google Scholar]
- Gusnard DA, Raichle ME, Raichle ME. Searching for a baseline: functional imaging and the resting human brain. Nat Rev Neurosci. 2001;2:685–694. doi: 10.1038/35094500. [DOI] [PubMed] [Google Scholar]
- Herscovitch P. Can [15O]water be used to evaluate drugs? J Clin Pharmacol. 2001;41:11S–20S. [PubMed] [Google Scholar]
- Hershey T, Black KJ, Stambuk MK, Carl JL, McGee-Minnich LA, Perlmutter JS. Altered thalamic response to levodopa in Parkinson's patients with dopa-induced dyskinesias. Proc Natl Acad Sci U S A. 1998;95:12016–12021. doi: 10.1073/pnas.95.20.12016. [DOI] [PMC free article] [PubMed] [Google Scholar]
- Hershey T, Black KJ, Carl JL, Perlmutter JS. Dopa-induced blood flow responses in non-human primates. Exp Neurol. 2000;166:342–349. doi: 10.1006/exnr.2000.7522. [DOI] [PubMed] [Google Scholar]
- Hoehn MM, Yahr MD. Parkinsonism: onset, progression and mortality. Neurology. 1967;17:427–442. doi: 10.1212/wnl.17.5.427. [DOI] [PubMed] [Google Scholar]
- Iannetti GD, Wise RG. BOLD functional MRI in disease and pharmacological studies: room for improvement? Magn Reson Imaging. 2007;25:978–988. doi: 10.1016/j.mri.2007.03.018. [DOI] [PubMed] [Google Scholar]
- Ireland MD, Lowe AS, Reavill C, James MF, Leslie RA, Williams SC. Mapping the effects of the selective dopamine D2/D3 receptor agonist quinelorane using pharmacological magnetic resonance imaging. Neuroscience. 2005;133:315–326. doi: 10.1016/j.neuroscience.2005.02.018. [DOI] [PubMed] [Google Scholar]
- Joshi S, Duong H, Mangla S, Wang M, Libow AD, Popilskis SJ, Ostapkovich ND, Wang TS, Young WL, Pile-Spellman J. In nonhuman primates intracarotid adenosine, but not sodium nitroprusside, increases cerebral blood flow. Anesth Analg. 2002;94:393–399. doi: 10.1097/00000539-200202000-00031. [DOI] [PubMed] [Google Scholar]
- Kochanek PM, Hendrich KS, Jackson EK, Wisniewski SR, Melick JA, Shore PM, Janesko KL, Zacharia L, Ho C. Characterization of the effects of adenosine receptor agonists on cerebral blood flow in uninjured and traumatically injured rat brain using continuous arterial spin-labeled magnetic resonance imaging. J Cereb Blood Flow Metab. 2005;25:1596–1612. doi: 10.1038/sj.jcbfm.9600154. [DOI] [PubMed] [Google Scholar]
- Kofke WA, Blissitt PA, Rao H, Wang J, Addya K, Detre J. Remifentanil-induced cerebral blood flow effects in normal humans: dose and ApoE genotype. Anesth Analg. 2007;105:167–175. doi: 10.1213/01.ane.0000266490.64814.ff. [DOI] [PubMed] [Google Scholar]
- Lancaster JL, Woldorff MG, Parsons LM, Liotti M, Freitas CS, Rainey L, Kochunov PV, Nickerson D, Mikiten SA, Fox PT. Automated Talairach atlas labels for functional brain mapping. Hum Brain Mapp. 2000;10:120–131. doi: 10.1002/1097-0193(200007)10:3<120::AID-HBM30>3.0.CO;2-8. [DOI] [PMC free article] [PubMed] [Google Scholar]
- Laurienti PJ, Field AS, Burdette JH, Maldjian JA, Yen YF, Moody DM. Relationship between caffeine-induced changes in resting cerebral perfusion and blood oxygenation level-dependent signal. AJNR Am J Neuroradiol. 2003;24:1607–1611. [PMC free article] [PubMed] [Google Scholar]
- Lawrence J, Mackey SC. Role of neuroimaging in analgesic drug development. Drugs R D. 2008;9:323–334. doi: 10.2165/00126839-200809050-00003. [DOI] [PMC free article] [PubMed] [Google Scholar]
- Leslie RA, James MF. Pharmacological magnetic resonance imaging: a new application for functional MRI. Trends Pharmacol Sci. 2001;21:314–318. doi: 10.1016/s0165-6147(00)01507-8. [DOI] [PubMed] [Google Scholar]
- Liu TT, Behzadi Y, Restom K, Uludag K, Lu K, Buracas GT, Dubowitz DJ, Buxton RB. Caffeine alters the temporal dynamics of the visual BOLD response. NeuroImage. 2004;23:1402–1413. doi: 10.1016/j.neuroimage.2004.07.061. [DOI] [PubMed] [Google Scholar]
- Ma Y, Tang C, Moeller JR, Eidelberg D. Abnormal regional brain function in Parkinson's disease: truth or fiction? NeuroImage. 2009;45:260–266. doi: 10.1016/j.neuroimage.2008.09.052. [DOI] [PMC free article] [PubMed] [Google Scholar]
- MacIntosh BJ, Pattinson KT, Gallichan D, Ahmad I, Miller KL, Feinberg DA, Wise RG, Jezzard P. Measuring the effects of remifentanil on cerebral blood flow and arterial arrival time using 3D GRASE MRI with pulsed arterial spin labelling. J Cereb Blood Flow Metab. 2008;28:1514–1522. doi: 10.1038/jcbfm.2008.46. [DOI] [PubMed] [Google Scholar]
- Mathew RJ, Wilson WH. Caffeine induced changes in cerebral circulation. Stroke. 1985;16:814–817. doi: 10.1161/01.str.16.5.814. [DOI] [PubMed] [Google Scholar]
- Mathew RJ, Barr DL, Weinman ML. Caffeine and cerebral blood flow. Br J Psychiatry. 1983;143:604–608. doi: 10.1192/bjp.143.6.604. [DOI] [PubMed] [Google Scholar]
- McCulloch J. Mapping functional alterations in the CNS with [14C]deoxyglucose. In: Iverson LL, Iverson SD, Snyder SH, editors. Handbook of psychopharmacology: new techniques in psychopharmacology. New York: Plenum; 1982. pp. 321–410. [Google Scholar]
- McCulloch J, Harper AM. Cerebral circulation: effect of stimulation and blockade of dopamine receptors. Am J Physiol. 1977;233:H222–H227. doi: 10.1152/ajpheart.1977.233.2.H222. [DOI] [PubMed] [Google Scholar]
- McCulloch J, Savaki HE, McCulloch MC, Sokoloff L. Retina-dependent activation by apomorphine of metabolic activity in the superficial layer of the superior colliculus. Science. 1980a;207:313–315. doi: 10.1126/science.7350662. [DOI] [PubMed] [Google Scholar]
- McCulloch J, Savaki HE, Sokoloff L. Influence of dopaminergic systems on the lateral habenular nucleus of the rat. Brain Res. 1980b;194:117–124. doi: 10.1016/0006-8993(80)91322-0. [DOI] [PubMed] [Google Scholar]
- Nehlig A, Boyet S. Dose-response study of caffeine effects on cerebral functional activity with a specific focus on dependence. Brain Res. 2000;858:71–77. doi: 10.1016/s0006-8993(99)02480-4. [DOI] [PubMed] [Google Scholar]
- Nehlig A, Daval JL, Boyet S. Effects of selective adenosine A1 and A2 receptor agonists and antagonists on local rates of energy metabolism in the rat brain. Eur J Pharmacol. 1994;258:57–66. doi: 10.1016/0014-2999(94)90057-4. [DOI] [PubMed] [Google Scholar]
- Perlmutter JS, Rowe CC, Lich LL. In vivo pharmacological activation of dopaminergic pathways in primates studied with PET. J Cereb Blood Flow Metab. 1993;13:S286. [Google Scholar]
- Perthen JE, Lansing AE, Liau J, Liu TT, Buxton RB. Caffeine-induced uncoupling of cerebral blood flow and oxygen metabolism: a calibrated BOLD fMRI study. NeuroImage. 2008;40:237–247. doi: 10.1016/j.neuroimage.2007.10.049. [DOI] [PMC free article] [PubMed] [Google Scholar]
- Raichle ME, MacLeod AM, Snyder AZ, Powers WJ, Gusnard DA, Shulman GL. A default mode of brain function. Proc Natl Acad Sci U S A. 2001;98:676–682. doi: 10.1073/pnas.98.2.676. [DOI] [PMC free article] [PubMed] [Google Scholar]
- Schroeder H, Boyet S, Nehlig A. Effects of caffeine and doxapram perfusion on local cerebral glucose utilization in conscious rats. Eur J Pharmacol. 1989;167:245–254. doi: 10.1016/0014-2999(89)90585-2. [DOI] [PubMed] [Google Scholar]
- Strömberg I, Popoli P, Muller CE, Ferre S, Fuxe K. Electrophysiological and behavioural evidence for an antagonistic modulatory role of adenosine A2A receptors in dopamine D2 receptor regulation in the rat dopamine-denervated striatum. Eur J Neurosci. 2000;12:4033–4037. doi: 10.1046/j.1460-9568.2000.00288.x. [DOI] [PubMed] [Google Scholar]
- Tanganelli S, Sandager NK, Ferraro L, Antonelli T, Kehr J, Franco R, Ferre S, Agnati LF, Fuxe K, Scheel-Kruger J. Striatal plasticity at the network level. Focus on adenosine A2A and D2 interactions in models of Parkinson's Disease. Parkinsonism Relat Disord. 2004;10:273–280. doi: 10.1016/j.parkreldis.2004.02.015. [DOI] [PubMed] [Google Scholar]
- Tomasi D, Volkow ND, Wang R, Telang F, Wang G-J, Chang L, Ernst T, Fowler JS. Dopamine transporters in striatum correlate with deactivation in the default mode network during visuospatial attention. PLoS ONE. 2010;4:e6102. doi: 10.1371/journal.pone.0006102. [DOI] [PMC free article] [PubMed] [Google Scholar]
- Torvinen M, Marcellino D, Canals M, Agnati LF, Lluis C, Franco R, Fuxe K. Adenosine A2A receptor and dopamine D3 receptor interactions: evidence of functional A2A/D3 heteromeric complexes. Mol Pharmacol. 2005;67:400–407. doi: 10.1124/mol.104.003376. [DOI] [PubMed] [Google Scholar]
- Trugman JM. D1/D2 actions of dopaminergic drugs studied with [14C]-2-deoxyglucose autoradiography. Prog Neuropsychopharmacol Biol Psychiatry. 1995;19:795–810. doi: 10.1016/0278-5846(95)00132-f. [DOI] [PubMed] [Google Scholar]
- Trugman JM, James CL, Wooten GF. D1/D2 dopamine receptor stimulation by L-DOPA. Brain. 1991;114:1429–1440. doi: 10.1093/brain/114.3.1429. [DOI] [PubMed] [Google Scholar]
- van Eimeren T, Monchi O, Ballanger B, Strafella AP. Dysfunction of the default mode network in Parkinson disease: a functional magnetic resonance imaging study. Arch Neurol. 2009;66:877–883. doi: 10.1001/archneurol.2009.97. [DOI] [PMC free article] [PubMed] [Google Scholar]
- Wang J, Licht DJ, Jahng GH, Liu CS, Rubin JT, Haselgrove J, Zimmerman RA, Detre JA. Pediatric perfusion imaging using pulsed arterial spin labeling. J Magn Reson Imaging. 2003;18:404–413. doi: 10.1002/jmri.10372. [DOI] [PubMed] [Google Scholar]
- Wise RG, Tracey I. The role of fMRI in drug discovery. J Magn Reson Imaging. 2006;23:862–876. doi: 10.1002/jmri.20584. [DOI] [PubMed] [Google Scholar]