

Coregistered functional and structural image overlays demonstrate a significant difference in total hemoglobin concentration contrast between malignant tumors and solid benign lesions.
Abstract
Purpose:
To explore the optical and physiologic properties of normal and lesion-bearing breasts by using a combined optical and digital breast tomosynthesis (DBT) imaging system.
Materials and Methods:
Institutional review board approval and patient informed consent were obtained for this HIPAA-compliant study. Combined optical and tomosynthesis imaging analysis was performed in 189 breasts from 125 subjects (mean age, 56 years ± 13 [standard deviation]), including 138 breasts with negative findings and 51 breasts with lesions. Three-dimensional (3D) maps of total hemoglobin concentration (HbT), oxygen saturation (So2), and tissue reduced scattering coefficients were interpreted by using the coregistered DBT images. Paired and unpaired t tests were performed between various tissue types to identify significant differences.
Results:
The estimated average bulk HbT from 138 normal breasts was 19.2 μmol/L. The corresponding mean So2 was 0.73, within the range of values in the literature. A linear correlation (R = 0.57, P < .0001) was found between HbT and the fibroglandular volume fraction derived from the 3D DBT scans. Optical reconstructions of normal breasts revealed structures corresponding to chest-wall muscle, fibroglandular, and adipose tissues in the HbT, So2, and scattering images. In 26 malignant tumors of 0.6–2.5 cm in size, HbT was significantly greater than that in the fibroglandular tissue of the same breast (P = .0062). Solid benign lesions (n = 17) and cysts (n = 8) had significantly lower HbT contrast than did the malignant lesions (P = .025 and P = .0033, respectively).
Conclusion:
The optical and DBT images were structurally consistent. The malignant tumors and benign lesions demonstrated different HbT and scattering contrasts, which can potentially be exploited to reduce the false-positive rate of conventional mammography and unnecessary biopsies.
© RSNA, 2010
Supplemental material: http://radiology.rsna.org/lookup/suppl/doi:10.1148/radiol.10082176/-/DC1
Introduction
Although researchers have devoted tremendous effort to developing alternative breast imaging modalities in recent years (1–3), conventional mammography remains the primary imaging tool for early diagnosis of breast cancer. The well-established image interpretation, general availability, and good image resolution render conventional mammography the obvious choice for radiologists for breast screening. Newer developments in x-ray breast imaging techniques, such as digital mammography (4,5) and three-dimensional (3D) digital breast tomosynthesis (DBT) (6–9), are becoming mature methods. However, the high false-positive rate and the marginal contrast between tumor and dense breast tissue remain major challenges (10). Adding alternative imaging modalities, particularly modalities providing functional assessment of tissues, to structural x-ray imaging could provide improvement for cancer diagnosis. In particular, functional imaging by means of diffuse optical tomography (DOT) has shown great promise in this respect (11–16).
The primary imaging contrasts in DOT are tissue optical absorption and scattering, which are related to tissue physiologic parameters, such as the concentrations of oxygenated hemoglobin (HbO), deoxygenated hemoglobin (HbR), water, and lipids (16). With DOT, near-infrared lasers, either radiofrequency-modulated, continuous-wave or pulsed, are used to probe tissue structure noninvasively (13,17). The concentrations of the tissue chromophores can be subsequently recovered by measuring optical signals at multiple wavelengths and fitting the optical data with the known chromophore absorption spectra (13).
The reconstructed hemoglobin distributions may tightly correlate to tissue status and the presence of disease (18). The percentage of HbO in the blood (the hemoglobin oxygen saturation [So2]) is an indicator of tissue oxygen metabolism (19). However, a key factor that limits the widespread use of DOT is its low spatial resolution caused by the extreme sensitivity to noise (20) in the image reconstruction process. Consequently, most existing stand-alone optical breast imaging systems can produce only low-spatial-resolution images, the interpretation of which is difficult without corresponding structural information.
Inspired by the success of positron emission tomography (PET)/computed tomography (CT) (21), we developed a combined optical and x-ray breast imaging system for noninvasive acquisition of coregistered functional optical and structural x-ray images of the target breast. We hypothesized that, by using the geometry and the tissue structure information from the coregistered x-ray images, the optical reconstruction could be improved and that the resulting functional-structural image overlays may increase screening sensitivity and specificity by allowing the detection of more cancers and the reduction of the number of biopsies of benign lesions, compared with stand-alone conventional mammography.
Our purpose was to explore the optical and physiologic properties of normal and lesion-bearing breasts by using a combined optical and DBT imaging system.
Materials and Methods
The experimental protocols were approved by the institutional review board (Massachusetts General Hospital), and written informed consent was obtained from all subjects. The study was compliant with Health Insurance Portability and Accountability Act guidelines.
Imaging Instrumentation
A photograph of the combined optical and DBT imaging system and probes is shown in Figures E1 and E2 (online). The detailed configuration of the imaging system is described in the study of Fang et al (22). The optical source and detector probes were designed to be easily attached and detached from a standard mammographic or DBT system. In the experiment, the subject’s breast is in direct contact with the transparent source cassette and compression paddle. Inserting and removing the optical probes does not alter the compression and position of the breast.
The DBT unit is a clinical prototype (DS Gen1.5; GE Healthcare, Milwaukee, Wis). It images 15 projections within a 45° swing angle. A maximum-likelihood algorithm (8) was used to synthesize the two-dimensional projections into volumetric x-ray images, which have a voxel size of 0.1 mm in the x- and y-axes and 1 mm in the z-axis. The addition of the optical probe resulted in a magnification factor of 1.07, which was ignored because of the coarse nature of our mesh representation.
Subject Recruitment
In the trial of the combined optical and DBT system, 155 subjects were enrolled between April 2006 and June 2009. Adult female volunteers of any race or ethnic background who were undergoing breast screening or treatment were considered eligible for the study. Subjects who were younger than 35 years old, were pregnant, had open wounds or had undergone a recent breast biopsy (within 3 months), or had conditions that may have impaired their ability to give informed consent were excluded from this study. The age of the participating patients ranged between 35 and 85 years, with a mean age of 56 years and a standard deviation of 13. The body mass index (BMI) of the subjects ranged from 19.1 to 49.7, with a mean BMI of 27.8 and a standard deviation of 5.8. When the subject agreed, the contralateral breast was imaged by using identical procedures.
In Figure 1, we summarize the study population in terms of numbers of subjects and breasts for each patient group. From a total of 292 measured breasts from 155 subjects, we present the results from 189 breasts, including 138 breasts with negative mammographic findings, 26 breasts with malignant lesions, and 25 breasts with benign lesions from a total of 125 subjects. This includes subjects from a prior study of 68 breasts with negative findings from 49 subjects (22). The remaining breast measurements (n = 103) were excluded from this analysis owing to (a) incomplete measurement with either optical imaging or DBT (n = 67) or (b) because lesions were located outside the optical field of view (n = 4), (c) with a diameter less than 0.6 cm (n = 6), and (d) could not be identified by the breast imaging radiologist (D.B.K.) from the DBT image (n = 8), or (e) analysis was incomplete (n = 18). For the 189 included cases, there were 64 bilateral measurements, including 30 subjects with normal breasts, 33 patients with unilateral lesions and contralateral normal breasts, and one patient with bilateral benign lesions. All cases of malignant tumors and solid benign lesions were confirmed by means of histologic findings after the biopsy. The cases of 26 malignant tumors (size range, 0.6–2.5 cm in maximal diameter measured by using mammography or ultrasonography [US]; average size, 1.5 cm) include 20 of invasive ductal carcinomas, three of invasive lobular carcinomas, one of invasive mammary carcinoma, one of invasive tubular carcinoma, and one of ductal carcinoma in situ. For the benign lesions, there were eight cysts (size range, 0.6–2.9 cm; average size, 1.3 cm) and 17 solid benign lesions (size range, 0.7–2.5 cm; average size, 1.3 cm), including 11 fibroadenomas, two fibroepithelial lesions, one sclerosing papilloma, one case of fibrocystic change, one case of atypical ductal hyperplasia, and one hamartomatous lesion. The age ranges for patients with normal breasts (ie, both breasts had negative findings for cancer), malignant tumors, solid benign lesions, and cysts were 35–85 years (mean, 58 years ± 13 [standard deviation]), 35–82 years (mean, 60 years ± 14), 36–67 years (mean, 45 years ± 8), and 46–73 years (mean, 56 years ± 10), respectively.
Figure 1:

Summary of the study population in terms of numbers of subjects and breasts (br.). The numbers along the connecting lines represent numbers of breasts from each patient group.
Experimental Protocols
The optical source and detector probes were attached to the DBT unit. The subject’s breast was positioned and compressed in the mediolateral oblique orientation by the clinical technologist. The optical data acquisition (45 seconds) followed. At completion of the optical measurement, the optical probes were removed from the compression platform while the subject’s breast remained compressed. A DBT scan was then obtained (data acquisition time, 23 seconds).
In all cases, optical measurements with a solid phantom were obtained last for use in calibration.
Data Preprocessing and Image Reconstruction
Processing of the DOT and DBT measurements involved the reconstruction of the 3D DBT images (8), spatial registration between the DBT images and the optical probes, raw optical data calibration, and 3D breast mesh generation from the DBT images (23). More details are included in the study by Fang et al (22).
We implemented a spectrally constrained reconstruction approach (24,25) to recover the hemoglobin concentrations and tissue scattering images directly from multiwavelength measurement (26,27). Derivations of the multispectral reconstruction formulation with simultaneous coupling coefficient estimation are given in Appendix E1 (online).
Bulk Property Analysis
We reconstructed the bulk properties by using both radiofrequency and continuous-wave measurements at two wavelengths: 685 and 830 nm. Because the measurement wavelengths do not cover the absorption peaks for water and lipid, we assumed that water and lipid had known volume fractions of 23% and 58%, respectively, on the basis of values in the literature (14). The reconstruction results are not sensitive to these assumed water and lipid concentrations, on the basis of findings in our prior study (22). The recovered bulk optical properties were compared with the values in the literature (28,29) to assess the performance of the system.
We derived a new metric, 3D fibroglandular volume fraction, to quantitatively measure the density of the breast. The fibroglandular volume fraction, denoted as Fg, is the ratio between the 3D fibroglandular volume Vg and the imaged breast volume Vb, as shown in the following equation:
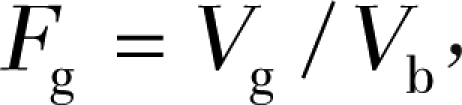 |
where Vg is estimated from 3D segmentations of the fibroglandular regions by using image analysis software (InsightSNAP; Penn Image Computing and Science Lab, University of Pennsylvania, Philadelphia, Pa; CS Department, University of North Carolina, Chapel Hill, NC) (30).
Image Analysis
Building on the estimated bulk properties as homogeneous initial guesses, we used the combined radiofrequency and continuous-wave measurements to reconstruct tomographic distributions of HbO, HbR, scattering amplitude, and scattering power. A region-of-interest (ROI) analysis was performed in all cases of normal breasts and of tumors. To create ROIs for all lesions, a breast imaging radiologist (D.B.K., with 30 years of experience), first identified the location and span of the lesion from the DBT image on the basis of the screening and/or diagnostic mammographic or US findings. The ROIs for normal tissue (fibroglandular tissue, adipose tissue, and muscle) were then drawn on the same image section on which the lesion was located, excluding the lesion regions, by an engineer and data analyst (Q.F.) who was assisted by the breast imaging radiologist and was visually guided by the segmentation generated from the image analysis software (30). For normal breasts, we selected the image section where the fibroglandular tissue had the largest cross section. All ROIs were within the optical sensitivity profile. To reduce the influence from intersubject variations, such as breast size, density, and age, we normalized the optical properties of the fibroglandular tissue, muscle, and lesion regions by using those of the adipose tissue, and used the normalized values to perform the statistical analysis.
Statistical Analysis
For the measurements in the normal breast, we calculated the Pearson product moment correlations between the optical parameters (total hemoglobin concentration [HbT] and So2) and patient age and BMI. The correlations between bilateral breast measurements were also studied to assess the consistency of the measurements. Cases of uncorrelated bilateral measurements were investigated to identify the causes. For simplicity, we ignored the only subject with bilateral solid benign lesions and used the Student t test to assess the significant differences between lesion groups. For the cases of 26 malignant tumors, a single-tailed paired t test (the tail is determined by the signs of the mean differences) was performed between the normalized values of the tumor and the corresponding fibroglandular tissues to identify the significant difference for resolving the optical contrast owing to malignancy. We also performed two-sample t tests between the 138 normal breasts and breasts with malignancies. Similar tests were also performed between any two groups of lesions, from the 17 cases of solid benign lesions, eight cases of cysts, and the 26 cases of malignant tumors. All calculations were performed with software (Matlab, version 7.4; MathWorks, Natick, Mass).
Results
Breast Bulk Properties
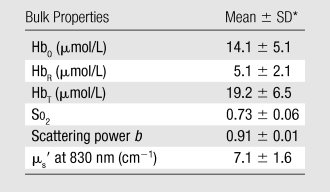
The means and standard deviations of the estimated bulk HbO, HbR, So2, scattering power b, and the reduced scattering coefficients (μs′) at 830 nm for 138 normal breasts are summarized in Table 1.
Table 1.
Bulk Optical Properties from 138 Normal Breasts
Correlations with Age and BMI
A weak correlation (R = −0.29, P = .0006) between age and HbT was found in the normal breasts, where HbT presents higher values for younger women. Similar findings were seen between age and μs′ (R = −0.27, P = .001), as well as between BMI and HbT (R = −0.38, P < .0001).
Correlations between Bilateral Breasts
Comparisons of optical and physiologic properties for the 30 bilateral measurements obtained from subjects with negative findings are shown in scatterplots of the bulk HbT, So2, and μs′ values at 830 nm in Figure 2. Strong correlations were observed between bilateral HbT (R = 0.96, P < .0001), So2 (R = 0.84, P < .0001), and μs′ (R = 0.89, P < .0001) values. The leftmost outlier in the So2 images is a result of low signal level for the 685-nm laser, whereas the other two were likely caused by poor optical coverage caused by the size of the breasts.
Figure 2a:

Graphs show bulk physiologic properties from 30 bilateral breast measurements of (a) HbT (in micromoles per liter), (b) So2, and (c) μs′ at 830 nm (cm−1).
Figure 2b:

Graphs show bulk physiologic properties from 30 bilateral breast measurements of (a) HbT (in micromoles per liter), (b) So2, and (c) μs′ at 830 nm (cm−1).
Figure 2c:

Graphs show bulk physiologic properties from 30 bilateral breast measurements of (a) HbT (in micromoles per liter), (b) So2, and (c) μs′ at 830 nm (cm−1).
Correlations to Breast Density
A moderate correlation (R = 0.57, P < .0001) was observed between Fg and HbT, (ie, a higher fibroglandular volume fraction was associated with a higher HbT value) (Fig 3a). A weak decreasing trend between So2 and Fg was also found in Figure 3b (R = −0.25, P = .003).
Figure 3a:

Graphs show correlation between the breast fibroglandular volume fraction Fg and (a) HbT and (b) So2.
Figure 3b:

Graphs show correlation between the breast fibroglandular volume fraction Fg and (a) HbT and (b) So2.
Representative Breast Image Reconstruction Results
The muscle of the chest wall in the normal breast presents the highest HbT values (Fig 4); the fibroglandular tissue shows a slightly lower HbT value than does the muscle region, but it is approximately 40% greater than the HbT of the background fatty tissue for this case. The higher HbT and scattering values of the muscle and fibroglandular tissue are also consistent with those found in the literature (18), despite the overall decrease caused by compression.
Figure 4a:
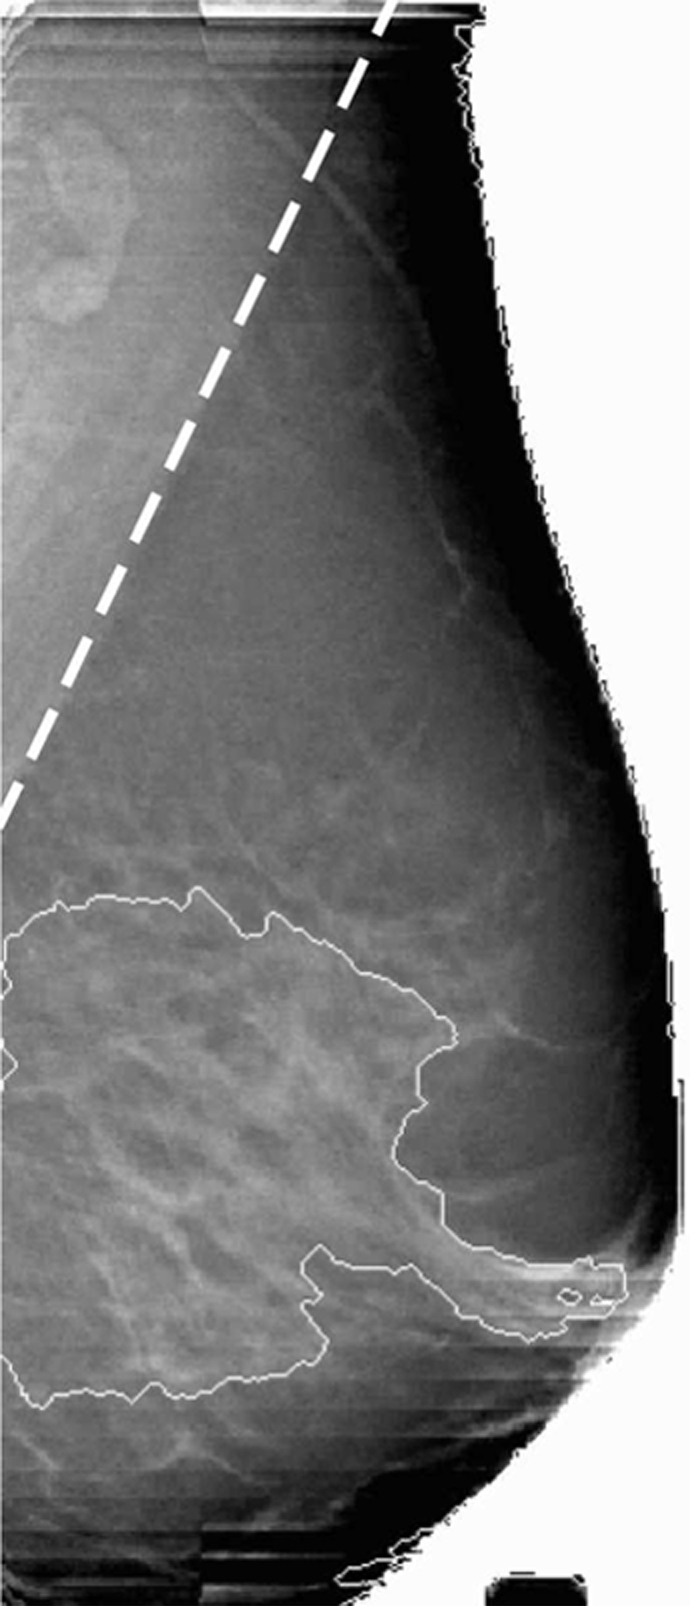
Reconstructed image sections for the right breast in 37-year-old woman. (a) DBT image and (b) HbT (micromoles per liter), (c) So2, and (d) μs′ (cm−1) images at 830 nm. The dashed line in a denotes the boundary of the chest-wall muscle region. The boundary of the fibroglandular tissue is marked by thin solid lines on b–d.
Figure 4b:

Reconstructed image sections for the right breast in 37-year-old woman. (a) DBT image and (b) HbT (micromoles per liter), (c) So2, and (d) μs′ (cm−1) images at 830 nm. The dashed line in a denotes the boundary of the chest-wall muscle region. The boundary of the fibroglandular tissue is marked by thin solid lines on b–d.
Figure 4c:

Reconstructed image sections for the right breast in 37-year-old woman. (a) DBT image and (b) HbT (micromoles per liter), (c) So2, and (d) μs′ (cm−1) images at 830 nm. The dashed line in a denotes the boundary of the chest-wall muscle region. The boundary of the fibroglandular tissue is marked by thin solid lines on b–d.
Figure 4d:

Reconstructed image sections for the right breast in 37-year-old woman. (a) DBT image and (b) HbT (micromoles per liter), (c) So2, and (d) μs′ (cm−1) images at 830 nm. The dashed line in a denotes the boundary of the chest-wall muscle region. The boundary of the fibroglandular tissue is marked by thin solid lines on b–d.
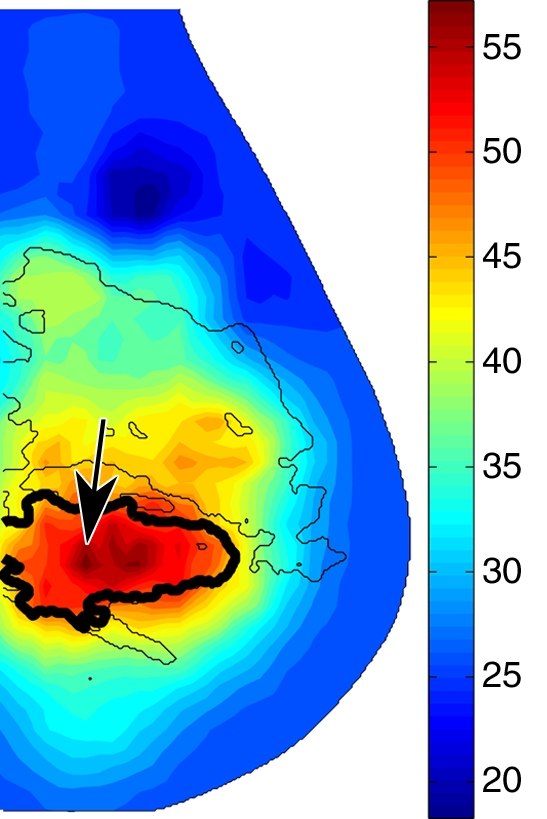
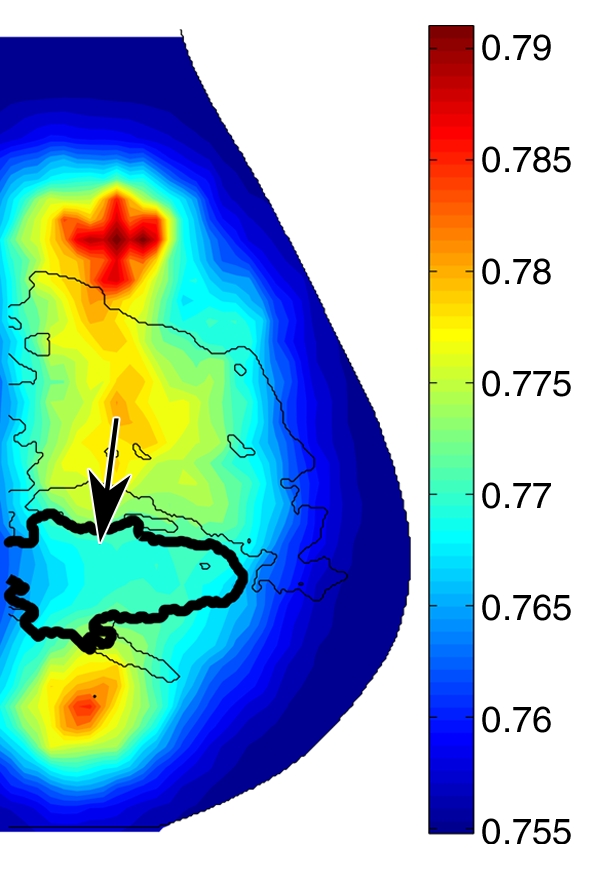
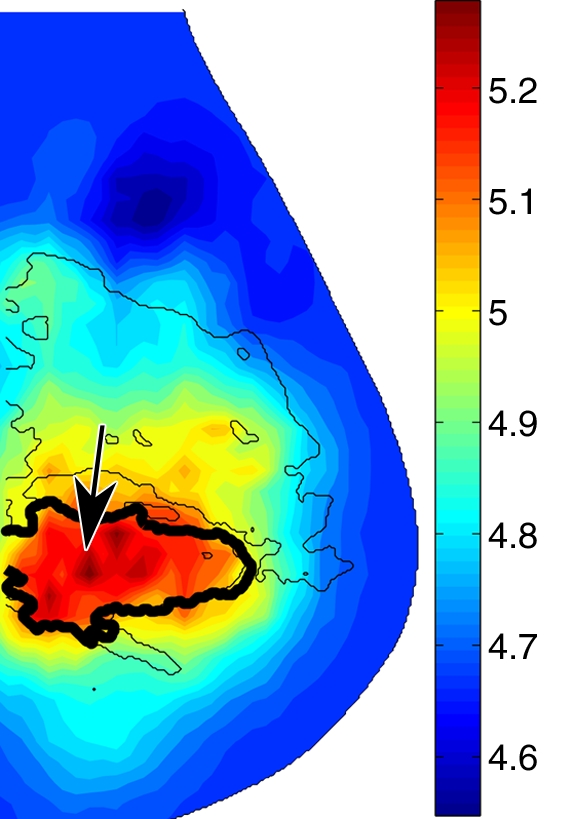
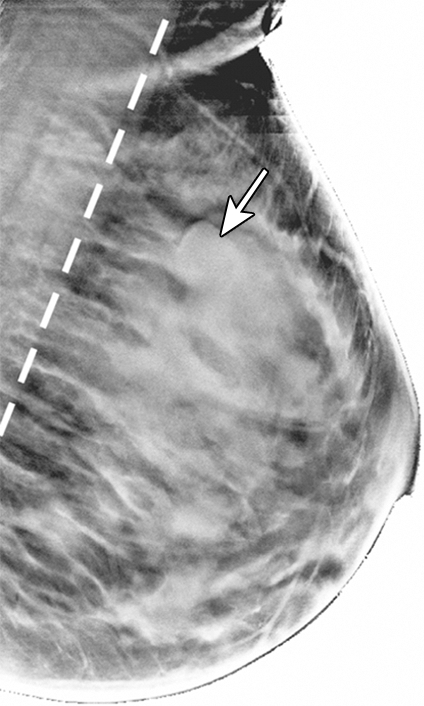
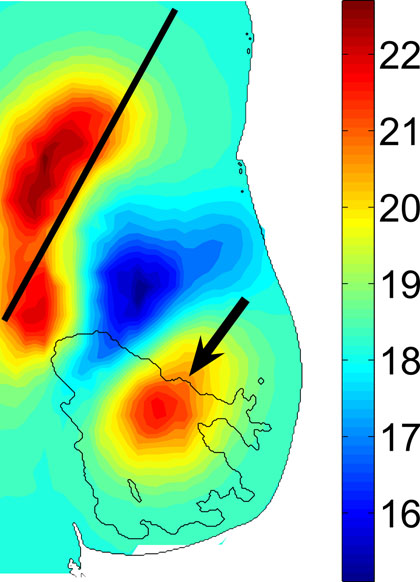
In malignant tumors, a distinct positive optical contrast region bound by the x-ray contour of the tumor was found in the HbT image and the μs′ image (Fig 5). In the So2 image, the tumor region exhibited the lowest So2 value.
Figure 5a:
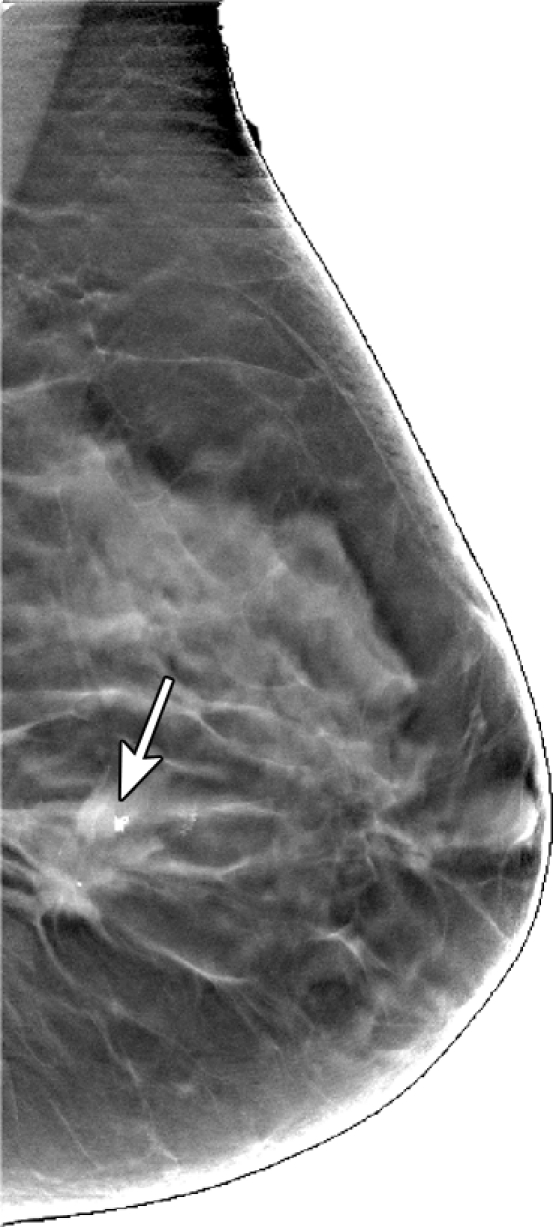
Reconstructed image sections for the right breast in 45-year-old woman. (a) DBT image and (b) HbT (micromoles per liter), (c) So2, and (d) μs′ (cm−1) images at 830 nm. The breast contains a 2.5-cm invasive ductal carcinoma (arrow on a, line with arrow on b-d).
Figure 5b:
Reconstructed image sections for the right breast in 45-year-old woman. (a) DBT image and (b) HbT (micromoles per liter), (c) So2, and (d) μs′ (cm−1) images at 830 nm. The breast contains a 2.5-cm invasive ductal carcinoma (arrow on a, line with arrow on b-d).
Figure 5c:
Reconstructed image sections for the right breast in 45-year-old woman. (a) DBT image and (b) HbT (micromoles per liter), (c) So2, and (d) μs′ (cm−1) images at 830 nm. The breast contains a 2.5-cm invasive ductal carcinoma (arrow on a, line with arrow on b-d).
Figure 5d:
Reconstructed image sections for the right breast in 45-year-old woman. (a) DBT image and (b) HbT (micromoles per liter), (c) So2, and (d) μs′ (cm−1) images at 830 nm. The breast contains a 2.5-cm invasive ductal carcinoma (arrow on a, line with arrow on b-d).
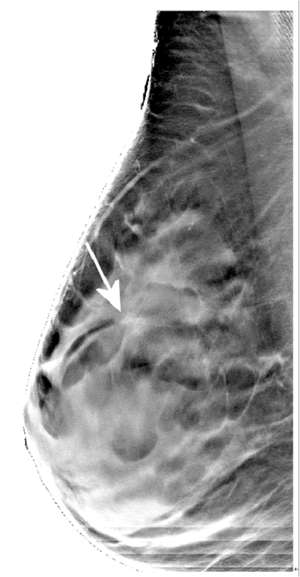
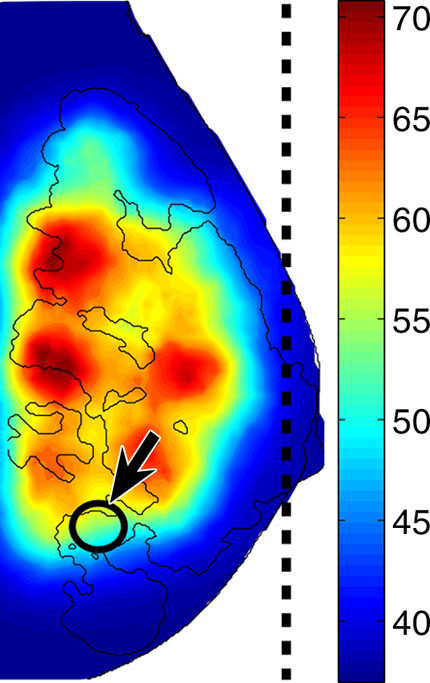
In a fibroadenoma (Fig 6), no contrast between the lesions and the surrounding fibroglandular tissue was observed. Additional examples of malignant and benign lesions are in Figures E3–E7 (online).
Figure 6a:
Reconstructed (a) DBT and (b) HbT images of a 16-mm fibroadenoma (arrow on a and arrow with circle on b) in right breast in 39-year-old woman. Dashed line on a and solid line on b denote the muscle boundary, and dashed line on b denotes the maximum extent of the optical field of view.
Figure 6b:
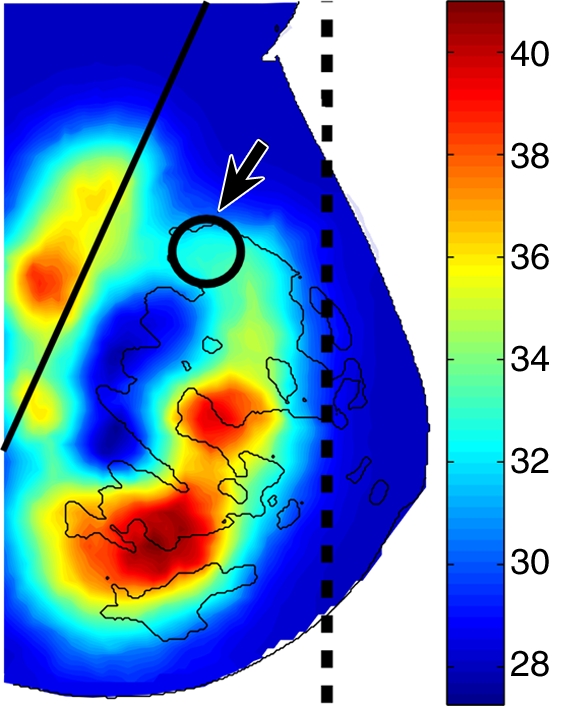
Reconstructed (a) DBT and (b) HbT images of a 16-mm fibroadenoma (arrow on a and arrow with circle on b) in right breast in 39-year-old woman. Dashed line on a and solid line on b denote the muscle boundary, and dashed line on b denotes the maximum extent of the optical field of view.
Optical Contrast of Malignant and Benign Lesions
The mean and standard deviation of the absolute and normalized optical properties of each tissue type are summarized in Table 2. Significant differences in terms of P values between various tissue groups are summarized in Table 3. Two-sample t tests for lesion sizes showed no significant difference between malignant and solid benign lesions (P = .31), malignant tumors, and cysts (P = .54) and between cysts and solid benign lesions (P = .94). Similar tests for patient ages between different groups showed significant differences between patients with malignant tumors and those with solid benign lesions (P < .0005) and between patients with solid benign lesions and those with cysts (P = .016), but not between patients with malignant tumors and those with cysts (P = .37).
Table 2.
Absolute and Normalized Optical Properties for Normal and Tumorous Tissues
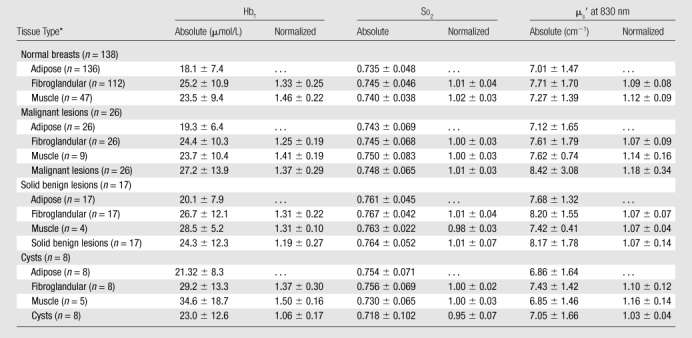
Note.—Data are the means ± standard deviations.
n = Total numbers of breasts.
Table 3.
P Values for Statistical Tests among Different Tissue Types
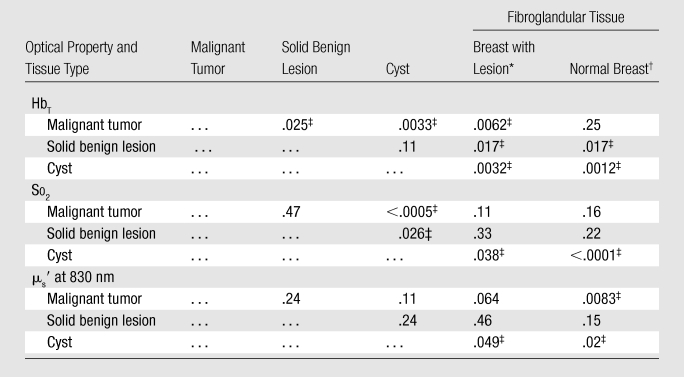
Note. —The values in the cells with ellipses were omitted owing to symmetry of the table.
Paired test.
Unpaired test.
Significant.
Discussion
Our results from the bulk optical properties are generally consistent with data in the literature. We found an increasing trend for the HbT values, with increases in the volume fraction of fibroglandular tissue. In the literature, values for HbT range from 17 μmol/L (28) to 40 μmol/L (29) for noncompressed breasts. The mean HbT value for the current study was 19.2 μmol/L, which is at the lower end of the reported values. The low HbT values likely resulted from the greater mammographic compression (about 13 kPa) applied during our experiment (22,31), with respect to other published studies (14).
Because DBT is not a full 3D imaging method and DBT images generally present anisotropic resolution and certain image artifacts (8), the fibroglandular volume fraction, Fg, may not be anatomically accurate for measuring breast density. Nonetheless, our Fg estimate does show sufficient correlation with optical reconstructions to suggest that it is physiologically meaningful and is more quantitative than the traditional category-based density ratings (32). The correlations between the bilateral breast bulk properties further indicate that our method can be used to identify the expected similarity, given the independent acquisition and processing of the bilateral measurements.
The estimated physiologic properties of the normal breast tissue, particularly the normalized values, are consistent across all cases. The optical contrasts between the normal and cancerous tissue generally agree with published findings derived from a different imaging system (33).
We found that the normalized HbT can be used to differentiate cancerous tumors from solid benign lesions (P = .025), cysts (P = .0033), and fibroglandular tissue of the same breast (P = .0062) in a paired test but not in the normal breasts (P = .25) in an unpaired test. This result is likely caused by large HbT intersubject variations in the general population and may potentially lead to increased false-positive results if diagnosis is based solely on HbT contrast. However, for normalized μs′, the difference for the malignant tumor and fibroglandular tissue in the normal breasts is significant (P = .0083), indicating that, for the limited number of study cases, normalized μs′ is less susceptible to intergroup variations. In our future studies, we will perform multivariate analysis and use multiple optical parameters to improve accuracy.
Cysts and solid benign lesions can be differentiated by using the So2 values (P = .026), but not by using the values for HbT (P = .11) or μs′ (P = .24). In fact, the So2 in the cysts is significantly lower than it is in all other tissue types. The average tumor–adipose tissue contrast ratio in HbT images is 1.4. Solid benign lesions show a lower HbT than does the fibroglandular tissue (P = .017), as do cysts (P = .0012).
The major limitations of the study include the following: (a) the number of malignant tumors and benign lesions is limited, (b) the structural information from the DBT image has not yet been fully exploited in the optical reconstruction, and (c) we traded increased temporal resolution of the optical system for reduced spatial resolution. The high percentage of exclusions in the lesion group resulted from issues in the automation of the optical system control software that were subsequently resolved. Given the limited number of lesions involved in this study, the results reported here are rather preliminary and merely serve as an early indication of the diagnostic potential of the proposed method. Cases with false-positive results can occur if optical images are used by the readers for lesion detection, and cases with false-negative results can occur if a malignant lesion is small and yields HbT values in the normal fibroglandular tissue ranges. More rigorous clinical evaluations, including studies with blinded readers, will be needed. An advanced algorithm by using spatial priors from x-ray images and a high-spatial- and high-temporal-resolution second-generation imaging system are currently under development to overcome these limitations. The improved spatial resolution in the newer system may help to enhance the contrast of the lesions and make it possible to image small lesions that the current system is not able to depict. Further work to optimally fuse the structural and functional information from both modalities will enable us to test whether improvements in sensitivity and specificity result from the fusion compared with conventional structural imaging alone.
To summarize, we tested our combined x-ray and DOT breast imaging system in a clinical setting with both normal and lesion-bearing breasts. We were able to recover diagnostic, relevant physiologic images, interpret the results with coregistered functional and structural image overlays, and demonstrate a significant difference in HbT among malignant tumors, solid benign lesions, and cysts and significant differences in So2 between solid benign lesions and cysts. The identified functional contrast of malignant tumors from the additional optical measurement has the potential of enhancing breast cancer diagnosis and deserves further exploration.
Analogous to PET/CT (21), this system demonstrated an incremental information-fusion approach that could lead to a lower barrier for acceptance by radiologists and help provide better patient care. By presenting the spatially coregistered x-ray and optical images, a radiologist is able to map the suspicious findings from the mammogram to the corresponding optical images and seek confirmation by using the functional characteristics. The demonstrated discrimination of malignant and benign lesions motivates further advancement of this technology and a rigorous assessment of its sensitivity and specificity to identify its diagnostic advantages over stand-alone conventional mammography. For instance, in this study, we used only the coregistered tomosynthesis images for modeling breast geometry and interpreting the optical reconstruction results. We will expand our efforts in using tissue segments and incorporating this information as spatial priors (34–36) to constrain the image and bulk property reconstructions. We expect that a more accurate representation of the breast functional map can be achieved by using these additional constraints. Furthermore, high-spatiotemporal-resolution optical images can be obtained with hardware advancements.
Advances in Knowledge.
Optical images of malignant tumors of 0.6–2.5 cm were spatially coincident with the tumor locations in x-ray images.
The total hemoglobin concentration contrast between malignant tumors and adipose tissue was significantly greater than that for solid benign lesions (n = 17, P = .025) and cysts (n = 8, P = .0033); the scattering coefficient contrast of adipose tissue for malignant tumors was significantly higher than the contrast of fibroglandular tissue in normal breasts (n = 138, P = .0083).
The oxygen saturation in cysts was significantly lower than that in malignant tumors (P < .0005) and solid benign lesions (P = .026), as well as in fibroglandular tissue (P < .0001).
Implication for Patient Care.
Dual-modality breast imaging by using coregistered functional optical and structural x-ray images may provide additional differentiation of malignant from benign lesions and has the potential to help reduce the unnecessary biopsies resulting from stand-alone conventional mammography.
Supplementary Material
Acknowledgments
The authors thank Jayne Cormier, Dianne Scourletis, and Donna Burgess at Avon Foundation Comprehensive Breast Evaluation Center, Massachusetts General Hospital, Boston, Mass, for helping with the experiments and the tomosynthesis image reconstruction. We also thank GE Medical Systems for provision of the DBT clinical prototype.
Received December 8, 2008; revision requested January 7, 2009; final revision received February 4, 2010; accepted March 15; final version accepted August 5.
From the 2007 RSNA Annual Meeting.
Funding: This research was supported by the National Institutes of Health (grants R01-CA97305, P41-RR14075, and U54-CA105480 [NTROI]).
Supported by USARMY BRMC grant DAMD17-98-8309 and the Gordon Center for Subsurface Sensing and Imaging Systems under the Engineering Research Centers Program of the National Science Foundation (award EEC-9986821). D.B.K. supported in part by funds from GE Healthcare and Massachusetts General Hospital.
D.B.K. has the patent on tomosynthesis of the breast.
Abbreviations:
- BMI
- body mass index
- DBT
- digital breast tomosynthesis
- DOT
- diffuse optical tomography
- HbO
- oxygenated hemoglobin
- HbR
- deoxygenated hemoglobin
- HbT
- total hemoglobin concentration
- μs′
- reduced scattering coefficient
- ROI
- region of interest
- So2
- oxygen saturation
- 3D
- three-dimensional
References
- 1.Morris EA. Breast cancer imaging with MRI. Radiol Clin North Am 2002;40(3):443–466 [DOI] [PubMed] [Google Scholar]
- 2.Poplack SP, Wells WA, Paulsen KD. Four alternative imaging modalities. In: Paulsen KD, Meaney PM, Gilman LC, eds. Alternative breast imaging: four model-based approaches. New York, NY: Springer Science+Business Media, 2005; 1–25 [Google Scholar]
- 3.Görres GW, Steinert HC, von Schulthess GK. PET and functional anatomic fusion imaging in lung and breast cancers. Cancer J 2004;10(4):251–261 [DOI] [PubMed] [Google Scholar]
- 4.James JJ. The current status of digital mammography. Clin Radiol 2004;59(1):1–10 [DOI] [PubMed] [Google Scholar]
- 5.Pisano ED, Gatsonis C, Hendrick E, et al. Diagnostic performance of digital versus film mammography for breast-cancer screening. N Engl J Med 2005;353(17):1773–1783 [DOI] [PubMed] [Google Scholar]
- 6.Grant DG. Tomosynthesis: a three-dimensional radiographic imaging technique. IEEE Trans Biomed Eng 1972;19(1):20–28 [DOI] [PubMed] [Google Scholar]
- 7.Niklason LT, Christian BT, Niklason LE, et al. Digital tomosynthesis in breast imaging. Radiology 1997;205(2):399–406 [DOI] [PubMed] [Google Scholar]
- 8.Wu T, Zhang J, Moore R, et al. Digital tomosynthesis mammography using a parallel maximum-likelihood reconstruction method. In: Yaffe MJ, Flynn MJ, eds. Proceedings of SPIE: medical imaging 2004—physics of medical imaging. Vol 5368. Bellingham, Wash: The International Society for Optical Engineering, 2004; 1–11 [Google Scholar]
- 9.Rafferty EA, Kopans DB, Wu T, Moore RH. Tomosynthesis: a new tool for breast cancer detection [abstr]. Breast Cancer Res Treat 2005;94(suppl):S2 [Google Scholar]
- 10.Feig SA, D’Orsi CJ, Hendrick RE, et al. American College of Radiology guidelines for breast cancer screening. AJR Am J Roentgenol 1998;171(1):29–33 [DOI] [PubMed] [Google Scholar]
- 11.Hebden JC, Arridge SR, Delpy DT. Optical imaging in medicine. I. Experimental techniques. Phys Med Biol 1997;42(5):825–840 [DOI] [PubMed] [Google Scholar]
- 12.Tromberg BJ, Shah N, Lanning R, et al. Non-invasive in vivo characterization of breast tumors using photon migration spectroscopy. Neoplasia 2000;2(1-2):26–40 [DOI] [PMC free article] [PubMed] [Google Scholar]
- 13.Boas DA, Brooks DH, Miller EL, et al. Imaging the body with diffuse optical tomography. IEEE Signal Process Mag 2001;18(6):57–75 [Google Scholar]
- 14.Durduran T, Choe R, Culver JP, et al. Bulk optical properties of healthy female breast tissue. Phys Med Biol 2002;47(16):2847–2861 [DOI] [PubMed] [Google Scholar]
- 15.Poplack SP, Paulsen KD, Hartov A, et al. Electromagnetic breast imaging: average tissue property values in women with negative clinical findings. Radiology 2004;231(2):571–580 [DOI] [PubMed] [Google Scholar]
- 16.Gibson AP, Hebden JC, Arridge SR. Recent advances in diffuse optical imaging. Phys Med Biol 2005;50(4):R1–R43 [DOI] [PubMed] [Google Scholar]
- 17.Arridge SR, Hebden JC. Optical imaging in medicine. II. Modelling and reconstruction. Phys Med Biol 1997;42(5):841–853 [DOI] [PubMed] [Google Scholar]
- 18.Peters VG, Wyman DR, Patterson MS, Frank GL. Optical properties of normal and diseased human breast tissues in the visible and near infrared. Phys Med Biol 1990;35(9):1317–1334 [DOI] [PubMed] [Google Scholar]
- 19.Intes X, Djeziri S, Ichalalene Z, et al. Time-domain optical mammography SoftScan: initial results. Acad Radiol 2005;12(8):934–947 [DOI] [PubMed] [Google Scholar]
- 20.Arridge SR. Optical tomography in medical imaging. Inverse Probl 1999;15(2):R41–R93 [Google Scholar]
- 21.Schöder H, Gönen M. Screening for cancer with PET and PET/CT: potential and limitations. J Nucl Med 2007;48(suppl 1):4S–18S [PubMed] [Google Scholar]
- 22.Fang Q, Carp SA, Selb J, et al. Combined optical imaging and mammography of the healthy breast: optical contrast derived from breast structure and compression. IEEE Trans Med Imaging 2009;28(1):30–42 [DOI] [PMC free article] [PubMed] [Google Scholar]
- 23.Boas D, Gaudette T, Arridge S. Simultaneous imaging and optode calibration with diffuse optical tomography. Opt Express 2001;8(5):263–270 [DOI] [PubMed] [Google Scholar]
- 24.Li A, Zhang Q, Culver JP, Miller EL, Boas DA. Reconstructing chromosphere concentration images directly by continuous-wave diffuse optical tomography. Opt Lett 2004;29(3):256–258 [DOI] [PubMed] [Google Scholar]
- 25.Srinivasan S, Pogue BW, Jiang S, Dehghani H, Paulsen KD. Spectrally constrained chromophore and scattering near-infrared tomography provides quantitative and robust reconstruction. Appl Opt 2005;44(10):1858–1869 [DOI] [PubMed] [Google Scholar]
- 26.Fang Q, Meaney PM, Paulsen KD. Microwave image reconstruction of tissue property dispersion characteristics utilizing multiple frequency information. IEEE Trans Microw Theory Tech 2004;52(8):1866–1875 [Google Scholar]
- 27.Yalavarthy PK, Dehghani H, Pogue BW, Paulsen KD. Critical computational aspects of near infrared circular tomographic imaging: analysis of measurement number, mesh resolution and reconstruction basis. Opt Express 2006;14(13):6113–6127 [DOI] [PubMed] [Google Scholar]
- 28.Srinivasan S, Pogue BW, Jiang S, et al. In vivo hemoglobin and water concentrations, oxygen saturation, and scattering estimates from near-infrared breast tomography using spectral reconstruction. Acad Radiol 2006;13(2):195–202 [DOI] [PubMed] [Google Scholar]
- 29.Cerussi AE, Berger AJ, Bevilacqua F, et al. Sources of absorption and scattering contrast for near-infrared optical mammography. Acad Radiol 2001;8(3):211–218 [DOI] [PubMed] [Google Scholar]
- 30.Yushkevich PA, Piven J, Hazlett HC, et al. User-guided 3D active contour segmentation of anatomical structures: significantly improved efficiency and reliability. Neuroimage 2006;31(3):1116–1128 [DOI] [PubMed] [Google Scholar]
- 31.Carp SA, Kauffman T, Fang Q, et al. Compression-induced changes in the physiological state of the breast as observed through frequency domain photon migration measurements. J Biomed Opt 2006;11(6):064016. [DOI] [PubMed] [Google Scholar]
- 32.American College of Radiology American College of Radiology (ACR) Breast Imaging Reporting and Data System Atlas. Reston, Va: American College of Radiology, 2003 [Google Scholar]
- 33.Poplack SP, Tosteson TD, Wells WA, et al. Electromagnetic breast imaging: results of a pilot study in women with abnormal mammograms. Radiology 2007;243(2):350–359 [DOI] [PubMed] [Google Scholar]
- 34.Li A, Miller EL, Kilmer ME, et al. Tomographic optical breast imaging guided by three-dimensional mammography. Appl Opt 2003;42(25):5181–5190 [DOI] [PubMed] [Google Scholar]
- 35.Dehghani H, Carpenter CM, Yalavarthy PK, Pogue BW, Culver JP. Structural a priori information in near-infrared optical tomography. In: Azar FS, ed. Proceedings of SPIE: medical imaging 2007—multimodal biomedical imaging II. Vol 6431 Bellingham, Wash: The International Society for Optical Engineering, 2007; 1–5 [Google Scholar]
- 36.Guven M, Yazici B, Intes X, Chance B. Diffuse optical tomography with a priori anatomical information. Phys Med Biol 2005;50(12):2837–2858 [DOI] [PubMed] [Google Scholar]
Associated Data
This section collects any data citations, data availability statements, or supplementary materials included in this article.