

SUMMARY
Background
Endoplasmic reticulum (ER) Ca2+ depletion, previously shown to signal pathologic stress responses, has more recently been found also to trigger homeostatic physiologic processes such as differentiation. In keratinocytes and epidermis, terminal differentiation and barrier repair require physiologic apoptosis and differentiation, as evidenced by protein synthesis, caspase 14 expression, lipid secretion, and stratum corneum (SC) formation.
Objectives
To investigate the role of Ca2+ depletion induced ER stress in Keratinocytes differentiation and barrier repair in vivo and in cell culture.
Methods
The SERCA2 Ca2+ pump inhibitor Thapsigargin (TG) is used to deplete ER Calcium both in cultured Keratinocytes and in mice. Levels of the ER stress factor XBP1, loricrin, Caspase 14, lipid synthesis and intracellular Ca2+ are compared after both TG treatment and barrier abrogation.
Results
We show here that these components of terminal differentiation and barrier repair are signaled by physiologic ER stress, via release of Stratum Granulosum (SG) ER Ca2+ stores. We first find that keratinocyte and epidermal ER Ca2+ depletion activate the ER-stress-induced transcription factor XBP1. Next, we demonstrate that external barrier perturbation results in both intracellular Ca2+ emptying and XBP1 activation. Finally, we show that TG treatment of intact skin does not perturb the permeability barrier, yet stimulates and mimics the physiologic processes of barrier recovery. This report is the first to quantify and localize ER Ca2+ loss after barrier perturbation and show that homeostatic processes that restore barrier function in vivo can be reproduced solely by releasing ER Ca2+, via induction of physiologic ER stress.
Keywords: Calcium, Endoplasmic Reticulum, XBP1, Epidermal Permeability Barrier
INTRODUCTION
The Endoplasmic Reticulum (ER) responds to perturbations in its luminal environment by initiating ER stress responses. Although the ER stress response was originally described as a compensatory response to pathological perturbations, more recently it has become clear that this response also participates in normal cellular differentiation. The unfolded protein response (UPR), one component of the ER stress response, has been shown to mediate differentiation in pancreas 1 and plasma cells 2(and reviewed in 3) via activation of the inositol-requiring 1 (IRE-1) sensor, which in turn generates the active (spliced) form of the transcription factor XBP1.
Keratinocytes and epidermis form a unique model to study ER stress, particularly ER stress due to ER Ca2+ depletion. Profound ER Ca2+ depletion, caused by a variety of mutations in the ER Ca2+ ATPase ATP2A2 (protein SERCA2), leads to Darier’s disease, a skin condition characterized by defective keratinocyte differentiation, abnormal keratinocyte apoptosis, and impaired cell-to-cell adhesion known as acantholysis (4–6. When SERCA2 is inactivated in mice, altered differentiation leads to development of squamous cell carcinomas in these animals’ skin 7. Conversely, mild or physiologic ER stress seems to enhance differentiation, particularly differentiation characteristic of later, terminal differentiation 8,9. Proteins associated with the ER XBP1-mediated stress pathway also are seen in the differentiated upper layers of normal epidermis, but not in hyperplastic benign (psoriasis) or malignant (squamous cell carcinoma) epidermis 9, and activated XBP1 is upregulated after UVB treatment of keratinocyte HaCaT cells 10.
We therefore hypothesized that mild, physiologic ER stress responses might drive normal keratinocyte differentiation, especially the terminal differentiation seen in the upper epidermis in response to barrier perturbation. Specifically, we examined whether decreases in ER Ca2+ concentrations, known to induce ER stress in keratinocytes 9 might mediate well-defined aspects of terminal differentiation seen after barrier perturbation in the uppermost viable layer of the epidermis, the Stratum Granulosum (SG).
Ca2+ is known to modulate both keratinocyte and epidermal differentiation. Experimental manipulation of Ca2+ in the upper epidermis regulates both the expression of specific epidermal differentiation proteins 11,12, and lipid secretion from cells of the outer SG 13–15, leading to epidermal barrier recovery. Acute barrier perturbation, either by physical removal of the SC or by solvent extraction of lipids, sets in motion a rapid sequence of events which together lead to epidermal barrier restoration and repair (reviewed in 16 and 17. Within 15–30 minutes, most preformed lamellar body contents are secreted from the SG into the spaces between the outer SG and SC. Concurrently, caspase 14, which directs terminal differentiation (physiological apoptosis), is expressed and activated in the outermost SG 18. These SG cells then lose their organelles and plasma membranes (transitional cells) and form anucleate cells bounded by cornified envelopes (SC). These processes, along with permeability barrier homeostasis, are modulated by experimental interventions that change epidermal Ca2+ 13–15,19.
Although initial experiments implicated extracellular Ca2+ fluxes in responses to barrier perturbation 11,12, more recent experimental evidence suggests that intracellular Ca2+ stores also play a pivotal role in terminal differentiation. Genetically modified mice in which capacitive Ca2+ entry is impaired by deleting the store-operated Ca2+ permeable channel Trpv6 display abnormal epidermal Ca2+ gradients 20. Moreover, in a recent study we found that the vast majority of the Ca2+ in the SG is found in intracellular stores rather than in extracellular spaces 21. In the current study, we investigated whether ER stress mechanisms, activated by ER Ca2+ loss, underlie epidermal permeability barrier homeostasis. This report is the first to show that barrier repair processes in vivo can be reproduced simply by depleting ER Ca2+. While profound loss of ER Ca2+ results in a pathologic skin condition known as Darier’s disease, physiologic ER Ca2+ release, resulting in ER stress, seems to underlie barrier homeostasis.
RESULTS
Keratinocyte and Epidermal ER Ca2+ Depletion Activate the ER-stress-induced Transcription factor XBP1
While TG is a specific inhibitor of the ER Ca2+ ATPase, high concentrations of this agent can have non-specific or toxic effects (Sorin et al 1997). In order to assess the effects of specifically depleting the ER Ca2+ stores, we first determined the concentrations of TG needed to deplete the keratinocyte ER Ca2+ pool. We found a long-lasting, concentration dependent ER Ca2+ depletion after TG treatment, at low concentrations of 10–100 nM (Figure 1A and B). We next assessed whether keratinocyte ER Ca2+ depletion using these TG concentrations activates the ER protein XBP1. ER stress results in elevated levels of XBP1 and XBP1 activation by alternative splicing (Yoshida et al, 2001; Hirota et al, 2006). Active XBP1 was upregulated, in a dose-dependent manner, when cultured human keratinocytes were exposed to 10 and 50 nM TG (Figure 2).
Figure 1. 10–100 nM TG depletes keratinocyte ER Ca2+ stores.

Primary normal human keratinocytes were transfected with the ER-targeted Ca2+ sensor D1ER (see Methods). 24 hours after transfection, cells were treated with 100 nM or 10 nM thapsigargin for one hour. The cells then were washed, and incubated in media for an additional 24 hours. A. Dual channel fluorescence measurements demonstrate a long-lasting decrease in the average FRET ratio in TG treated cells, compared to control. Data are presented as the mean +/− SD. N=10–15 cells in each group; B. The FRET ratio is converted into average [Ca2+] (µM), demonstrating a TG concentration-dependent decrease in ER Ca2+. Calibration of the Ca2+ sensitivity range of the probe and conversion of the FRET ratio into Ca2+ concentrations was performed following the protocol in Palmer et al 2004. Insert: Fluorescence from the D1ER localizes to a peri-nuclear area and spares the nucleus, consistent with localization to the ER.
Figure 2. Pharmacological depletion of ER calcium in vitro activates XBP1.

Normal human keratinocytes were treated with 10 or 50 nM TG. A. Cells were collected 2 hours after treatment, and Xbp1 mRNA levels were measured using QPCR. n=3 separate experiments. Data are presented as the mean +/− SD. *= p< 0.05.
Since XBP1 was activated when ER Ca2+ stores were depleted in cultured human keratinocytes, we next tested whether XPB1 also is upregulated by ER Ca2+ depletion in epidermis. We found a dose dependent upregulation of the active form of XBP1 following topical TG applications to mouse flank skin (Figure 3). Double tailed t-test demonstrated statistically significant differences between the TG treated samples vs. control and untreated samples (p<0.003 for 50 and 100 nM TG). To confirm that upregulation of XBP1 after TG application was due specifically to ER Ca2+ release, as opposed to a non-specific injury response to barrier perturbation, we monitored barrier homeostasis using transepidermal water loss, a sensitive indicator of barrier injury. Epidermal permeability barrier homeostasis, as measured with TEWL, did not differ in untreated animals vs. animals treated with vehicle or TG (data not shown).
Figure 3. Pharmacologically depleting the ER Ca2+ Store in vivo activates XBP1.

Normal hairless mice were treated with 10nM, 50nM or 100nM TG in vehicle (70% propylene glycol and 30% ethanol mixture) or vehicle alone. While no significant difference in the Xbp1 active levels is observed among the untreated, vehicle treated and 10 nM TG treated samples, 50 and 100 nM TG treatment resulted in a dose dependent increase in Xbp1 active levels. N= 3 separate experiments. Data are presented as the mean +/− SD. *= p <0.003.
External Epidermal Permeability Barrier Perturbation Results in Both Intracellular Ca2+ Emptying and XBP1 Activation
We next used a minimally invasive imaging approach, 21, and also see Materials and Methods), to quantify Ca2+ depletion from intracellular stores following barrier abrogation. We measured the fluorescence lifetime changes of the calcium sensitive dye Calcium Green 5N 21 to quantify SG intracellular Ca2+ in ex vivo skin before and after barrier perturbation. A clear difference in calcium levels is observed between the intra and extracellular calcium levels in the SC (Figure 4A), while the extracellular space falls below the microscope resolution in the granular layer (Figure 4B). Using this approach we previously showed that most Ca2+ in the epidermis, especially in the SS and SG, is localized intracellularly 21. Consistent with this previous report, prior to acute barrier disruption, we found long lifetime decays, indicative of high intracellular Ca2+ concentrations, within SG keratinocytes (Figure 4 B). As reported previously in 21, the Ca2+ concentrations measured, >20 µM, suggest that this signal derives primarily from intracellular stores such as the ER.
Figure 4. SG intracellular Ca2+ is depleted after barrier perturbation.

Samples were stained with CG5N and calcium concentrations were calculated from the lifetime data (see Methods) and displayed in pseudo-color. The color scale is indicated in the bottom left panel. Images from the SC and SG only are presented in order to visualize the morphology of these cell layers. (A) SC of unperturbed sample. Extracellular spaces are clearly visible in the SC, and clear difference in calcium concentration between the extracellular (black arrows) and intracellular compartments (white arrows) is detected in the SC of unperturbed skin samples, with the extracellular Ca2+ concentration ranging from 1–5 µM and the intracellular Ca2+ concentration ranging from 5–20 µM. (B and C) SG of unperturbed and tape stripped sample respectively. The extracellular space is below the resolution of the microscope in the SG and the fluorescence signal comes almost exclusively from the intracellular compartment. The nuclei of the SG cells are indicated by white arrows. Average intracellular Ca2+ concentration in the SG is higher than in the SC, > 20 µM, consistent with effective Ca2+ sequestration into the viable SG ER. This intracellular Ca2+ is lost (average concentration 0–5 µM) after the epidermal barrier is perturbed by removing the SC via tape-stripping. (D) Quantitative average calcium distribution in different epidermal strata in unperturbed epidermis. (E) Quantitative average calcium distribution in different epidermal strata of barrier perturbed (tape-stripped) epidermis. SS= stratum spinosum; SB= stratum basale.
Next, we quantified changes in intracellular Ca2+ concentrations after epidermal permeability barrier abrogation (Figure 4C) by tape stripping (note that most of the SC is removed after tape stripping). The lifetime measured in the SG of tape stripped epidermis (Figure 4 C) became dramatically shorter than in unperturbed skin (Figure 4B), indicating a precipitous drop in Ca2+ concentration after acute barrier abrogation, from >20 µM to <1.5 µM. We previously showed that the intracellular space occupies 98% of the volume in normal SS and SG epidermis 21. Consistent with this finding, most of the Ca2+ lost from the SG was derived from the intracellular stores. These results quantify the dramatic loss of SG Ca2+ seen after barrier perturbation, and further localize this loss to intracellular Ca2+ stores such as the ER.
The distributions of calcium concentrations at different epidermal strata before and after tape stripping are shown in Figure 4 D and E respectively.
We next assessed whether epidermal permeability barrier abrogation leads to ER stress, by measuring activated XBP1 after barrier abrogation. Consistent with our hypothesis, active XBP1 mRNA was upregulated in mouse epidermis by both chemical (acetone lipid extraction) and mechanical (tape stripping) barrier abrogation (Figure 5). Statistical analysis with a double tailed Students t-test showed significant differences between XBP1 levels from unperturbed vs. perturbed samples (p<0.0001). Taken together, the experiments detailed above suggest that epidermal permeability barrier homeostasis is mediated by ER stress, induced by changes in SG ER Ca2+.
Figure 5. XBP1 is activated by barrier perturbation.
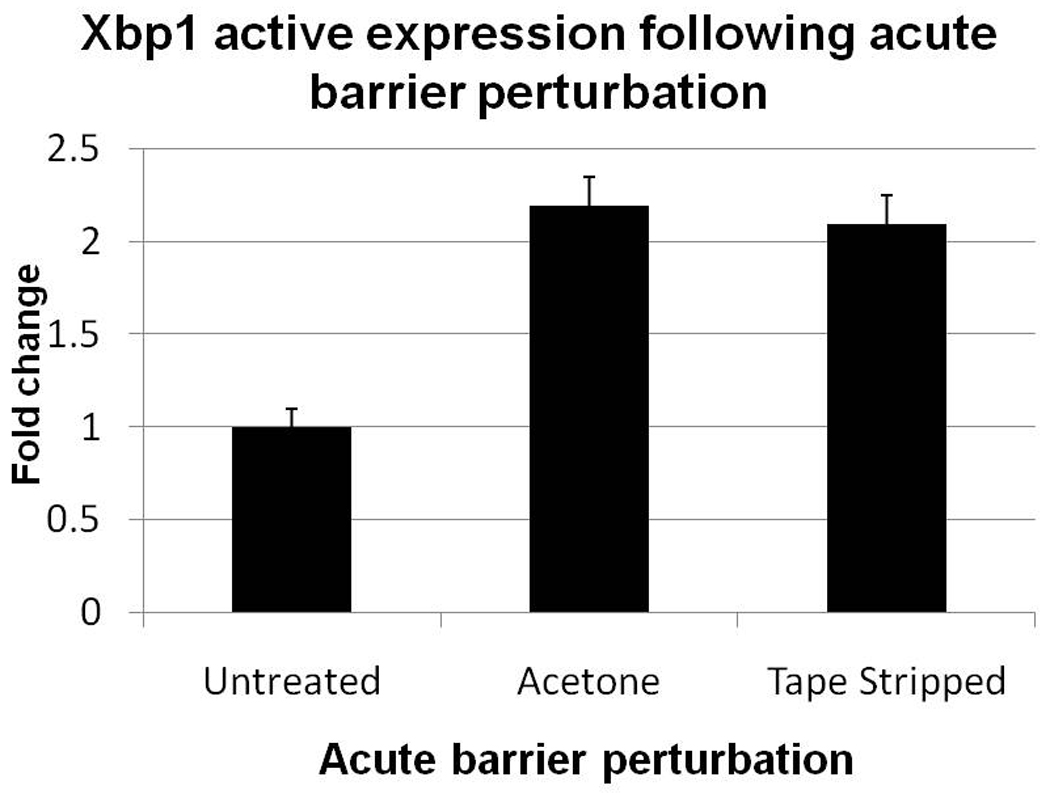
Normal hairless mouse were treated with acetone or tape-stripping. Epidermis was collected 2 hours after treatment. Levels of activated ER stress protein Xbp1 mRNA were analyzed using QPCR (see Methods). Results are from two separate experiments, with 2–3 mice in each group for each experiment. Both tape-stripping and acetone treatment significantly increased XBP1 expression (p< 0.0001). No statistically significant differences were seen in the Xbp1 response between acetone and tape-stripping. Data are presented as the mean +/− SD.
TG Treatment of Intact Skin does not Perturb the Permeability Barrier, yet Stimulates and Mimics the Physiologic Processes of Barrier Recovery
To test whether the epidermis senses barrier perturbation and initiates barrier homeostatic mechanisms via ER Ca2+ depletion and stress, we tested whether depleting ER Ca2+ stores, without perturbing the epidermal barrier, would nevertheless stimulate and mimic the physiologic processes of barrier recovery and terminal differentiation.
Barrier recovery and terminal differentiation consist of simultaneous, parallel processes. Epidermal Ca2+ has been shown to coordinately regulate both lamellar body secretion and terminal differentiation (i.e. cornified envelope formation, loss of cellular organelles, and synthesis of differentiation-specific proteins) 22–24. In addition, epidermal terminal differentiation also is directed by activation of caspase 14, a cysteinyl aspartate-specific proteinase (reviewed in 25). To determine which processes are controlled specifically by ER Ca2+ emptying, we treated normal hairless mice with a single topical application of a low concentration (100 nM) of TG, applied to unperturbed flank skin. By two hours after application, we found that TG treatment increased both epidermal caspase 14 expression and activation (Figure 6A and 6B) and loricrin expression (Figure 7), consistent with enhanced differentiation. As noted above, epidermal permeability barrier homeostasis, as measured by the kinetics of transepidermal water loss (TEWL), did not differ in untreated animals vs. those treated with vehicle vs. those treated with TG.
Figure 6. ER Ca2+ Depletion Induces Caspase 14 expression and activation.
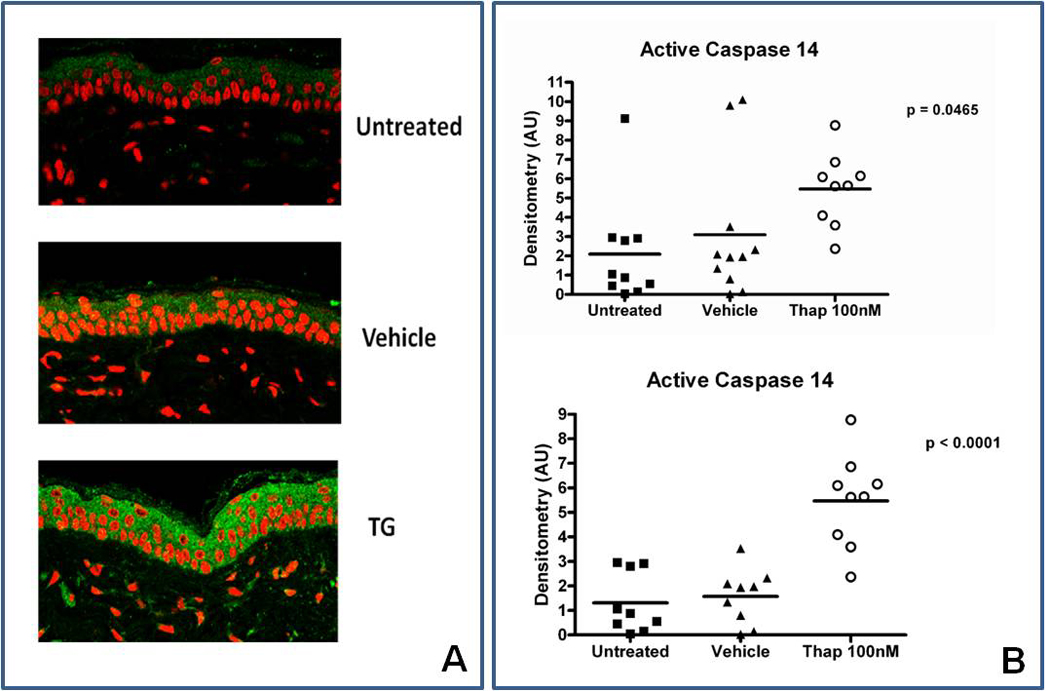
Normal hairless mice flanks were treated with 100 nM TG in a propylene glycol/EtOH vehicle. Animals were sacrificed and skin was harvested after 2 hours. A. Caspase 14 staining (green) of flank skin was minimally increased by the vehicle, but was markedly upregulated by TG. Magnification = 40×. The samples are representative of 5 experiments. B. Mouse flanks were treated as above, and epidermis was collected and probed for activated caspase 14 using Western blotting. Pooled data comparing densitometry of active vs. total caspase 14 (top panel) showed a significant increase in active caspase 14 in TG treated epidermis (p < 0.05), compared to vehicle and control. Removal of outliers (bottom graph panel B) gives p<0.0001 . N= 9–10 mice flanks in each group. Differences were assessed using an ANOVA test.
Figure 7. ER Ca2+ Store Emptying Increases Expression of the Late Differentiation Marker Loricrin.

Top Panel: Immunostaining demonstrates increased loricrin expression. Hairless mice were treated with TG as described above. Untreated (A) and vehicle treated (B) epidermis, counterstained with hemotoxylin (blue), demonstrate similar levels of loricrin staining (brown) restricted to the uppermost SG. TG-treated epidermis (C) demonstrates increased levels of loricrin staining. N=3 mice. Magnification = 2×.
Bottom panel: Western blotting of epidermis demonstrated increased expression of loricrin protein (upper band) after TG treatment. Vehicle treated mice (V), lanes 1 and 2; 10 nM TG (T10), lanes 3 and 4; 50 nM TG (T50), lanes 5 and 6; 100 nM TG (T100) lane 7. Densitometry measurements normalized to β-actin (lower band) are shown in the figure. N=2 mice were used for each condition.
EM images showed that release of ER Ca2+ stimulated a burst of lamellar body secretion around all surfaces of the outermost granular cells (Figure. 8A vs. 8B), which was paralleled by a wave of transitional cell formation, indicated by loss of intracellular organelles (Fig. 8B-TC). However, none of these newly-generated transitional cells display nascent cornified envelopes, which instead appeared only 2–3 cell layers higher, where these transitional cells transformed further into corneocytes (Figs. 8B, broken arrow). All preformed lamellar bodies were secreted after TG treatment, as evidenced by the lack of entombed organelle contents within corneocytes (see also below).
Figure 8. ER store depletion stimulates and mimics barrier homeostatic mechanisms, even though the barrier is not perturbed.
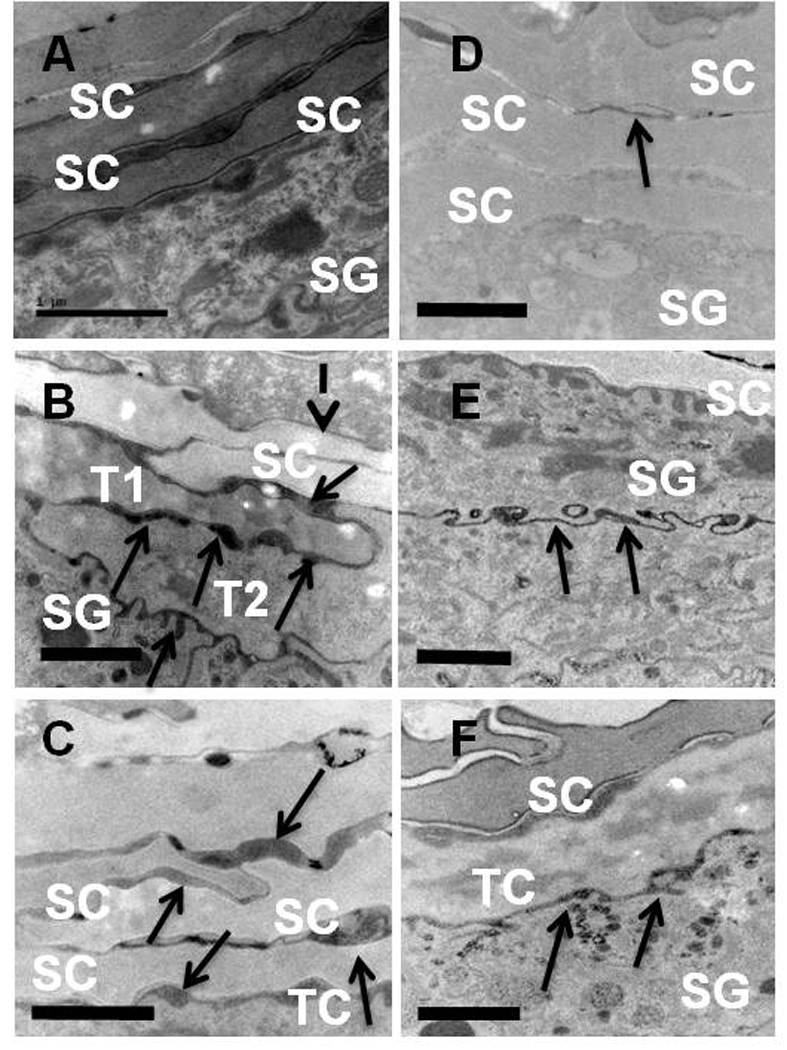
Vehicle-treated control mice (A) demonstrate normal lipid secretion at the SG/SC interface and a normal SC, which abruptly transitions from viable SG keratinocytes into normal SC corneocytes. In contrast, mice treated with 100 nM TG for 2 hours (B) demonstrate many transitional cells (ie. cells that have lost their nuclei and other organelles, but have not yet formed cornified envelopes) (T1 and T2), denoting early terminal differentiation. However, lipid is not entombed within these cells, but instead is secreted around and beneath them (B+C, solid arrows), as is seen after barrier perturbation with acetone or tape-stripping. Lipid secretion precedes cornified envelope formation (dotted arrow in B). Lipase ultrastructural cytochemistry confirmed that all lamellar body contents are secreted beneath the SC in control samples (E), at the TC-SG interface (F), and within the extracellular domains at higher levels of the SC (arrows) (D) in TG treated samples. Scale Bars= 1 µm.
To further characterize the relationship between lamellar body secretion and transitional cell formation, we next examined this skin with ultrastructural cytochemistry, using a lamellar body content marker, acidic lipase 26, to detect the earliest stages of secretion. As seen in Figure 8C, TG treatment stimulated release of lamellar body contents beneath the outermost granular cell layer, immediately prior to TC formation, evident in images from adjacent granular cells that display features of TC (Fig. 8B and 8F). Vehicle-treated control images for comparable levels of SG are seen for comparison in Figs. 8A and 8D. Together, these results suggest that Ca2+ release from ER stimulates lamellar body secretion, which in turn induces formation of transitional cells, prior to the appearance of cornified envelopes. Yet, cornified envelopes eventually appeared, and cornified envelope thickness increased in SC keratinocytes, indicative of enhanced terminal differentiation and SC formation (table 1). This sequence of events occurs too rapidly to be delineated after barrier perturbation, but is clearly seen when these processes are separated using an agent that stimulates ER Ca2+ depletion alone.
Table 1.
Cornified Envelope Thickness is Increased in TG-treated Epidermis. Mouse epidermis was treated with 100 nM TG or the propylene glycol/EtOH vehicle (Control). Cornified Envelope thickness was measured in sequential Electron Micrographs (Figure 5B and 5E). Data are presented as the mean ± SD. n=40. Statistical significance was calculated using a two-sided Students t test.
| Cornified Envelope Thickness (nm) | Control | TG 100 nM | P Value |
|---|---|---|---|
| 14.15±0.95 | 16.14±1.21 | P < 0.01 |
DISCUSSION
These studies demonstrate that ER Ca2+ loss, induced both by external barrier perturbation and by pharmacologic inactivation of the ER Ca2+ ATPase, lead to ER stress and a cascade of physiologic processes that maintain epidermal barrier homeostasis and lead to terminal differentiation. TG usually is used at concentrations up to 1 µM to empty ER Ca2+ stores 9. The concentrations used in this study were considerably lower, in the 10 –100 nM range. As shown in Figures 1 and 2, these concentrations were effective in lowering ER Ca2+ and activating XBP1, consistent with previously published reports that showed TG concentrations in this range altered keratinocyte morphology or differentiation (Li et al 1995; Jones and Sharp 1994).
Since very low (10 nM) concentrations of TG induce both ER Ca2+ loss and XBP1 activation, it seems likely that any significant loss of ER Ca2+ will result in ER stress. It previously has been shown that ER stress induced by agents, such as tunicamycin, that do not directly act on the keratinocyte ER Ca2+ ATPase also enhance terminal differentiation 9. Whether these agents also stimulate processes that mimic barrier repair, and whether it is possible to induce ER stress without changing the ER Ca2+ concentration, will be the subject of future studies.
In these studies, we showed that ER stress induced by ER Ca2+ release results in lamellar body secretion, and that increased secretion is paralleled by the immediate formation of transitional cells. Since these transitional cells still lack cornified envelopes, these results strongly suggest that lamellar body secretion is the initial trigger for terminal differentiation, independent of cornified envelope formation, which occurs subsequent to transitional cell formation. ER Ca2+ release could thus ensure that lamellar body contents are secreted prior to cornification. In turn, secreted lamellar body contents could effectively seal off SG cells, triggering terminal differentiation.
Mutations in the ER Ca2+ ATPase, encoded by the gene ATP2A2, cause Darier’s disease (DD) 4. The ER Ca2+ store is important for normal keratinocyte signaling and differentiation 27–29 6. Previous experiments testing the effects of TG in cultured mouse keratinocytes demonstrated that early differentiation marker expression were inhibited, while expression of later markers, such as loricrin, were enhanced 8,30. Expression of early differentiation markers is premature in DD 5, but decreased in SERCA2 knockout mouse keratinocytes (Hong et al 2009). Changes in later differentiation markers have not been described in DD. These results elucidate a novel Ca2+ signaling mechanism in skin. Modulating SG ER Ca2+ might be useful to treat diseases in which late differentiation or barrier function is impaired.
MATERIALS AND METHODS
Cell Culture
Primary normal human keratinocytes were isolated from newborn foreskins, and a mixture of first passage cells in 0.03 mM Ca2+ EpiLife (Cascade Biologics) media plated in 6-well plates to 80% confluence and incubated at 37°C with 5% CO2 were used for all cell culture studies. Keratinocytes were treated with 10 nM and 50 nM thapsigargin (Sigma-Aldrich) for 2 hours and washed with fresh media. RNA was isolated from cells using Qiagen’s RNeasy kit.
Calcium Measurements in Epidermis
Truncal skin samples were obtained from the Dermatology surgical units under protocols approved by the University of California, San Francisco and San Francisco Veterans Affairs Medical Center and in accordance with the principles expressed in the Declaration of Helsinki. A total of 4 skin samples from three different patients where used. Two of the samples from two different individuals were tape stripped 40 times immediately following excision and two were used as unperturbed controls. Each sample was submerged in a 50 µM solution of CG5N in 0.06 mM [Ca+2] Epilife (Cascade, Oregon) so that both the Stratum Corneum and the dermal side were in contact with the dye solution, and incubated overnight at 4 °C to insure dye penetration in the deeper layers of the tissue. About 2 hours prior to imaging, the samples were rinsed in dye free Epilife in order to remove the excess dye and placed with the dermal side in contact with media. The specimens were mounted with the Stratum Corneum in contact with a glass coverslip and secured on the stage of an inverted Zeiss Axiovert 200 microscope (Zeiss, Germany).
Endoplasmic Reticulum Calcium Measurement in Keratinocytes
Normal primary human keratinocytes were plated in glass bottom chambers in Keratinocyte Growth Media (Clonetics) with 0.03 mM Ca2+ , to allow for efficient transfection of the D1ER construct 31. Cells were transfected with D1ER (gift of Prof. Tsien’s laboratory) using Mirrus Keratinocyte Transit lipid reagent, according to the manufacturer’s protocol. 24 hours after transfection, cells were treated with TG, in a final concentration of 10 nM or 100 nM. After one hour, the cells were washed and transferred to Keratinocyte Growth Media containing 1.2 mM Ca+2 , to allow for efficient cell attachment and growth. Dual channel fluorescence measurements were performed 24 hours later using a Zeiss LSM Meta confocal system. Calibration of the Calcium sensitivity range of the probe and conversion of the FRET ratio into Calcium concentrations was performed following the protocol in 32.
Thapsigargin Mouse Treatment
Mice were treated under protocols approved by the University of California, San Francisco and San Francisco Veterans Affairs Medical Center. Normal hairless mice were anesthetized with 40mg/mL chloral hydrate and received dorsal flank treatments with a vehicle of 70% propylene glycol and 30% ethanol mixture or 100 nM thapsigargin in the vehicle. 2 hours later mice were euthanized and skin biopsies were harvested. Samples for electron microscopy were placed immediately in modified Karnovsky’s fixative according to previous protocol 11,12. Samples for immunohistochemistry were placed immediately in formalin (Fisher Scientific). Samples for RNA isolation were placed in Qiagen’s RNA Later solution and frozen at −80°C. Skin samples for protein and RNA isolation were placed in PBS supplemented with protease inhibitors and underwent heat separation at 56°C for 2 minutes 33. Epidermis was removed from dermis, washed twice with cold PBS/inhibitors, homogenized, and placed in RIPA Buffer supplemented with protease inhibitors. Protein lysates were harvested. Epidermis for RNA isolation was prepared as described above, homogenized, and RNA was isolated according to SV Total RNA Isolation kit (Promega) protocol. Electron microscopy and immunohistochemistry were performed using previously published protocol 11,12.
Quantitative PCR
All cDNA was generated using Roche Applied Science’s Transcriptor first strand cDNA synthesis kit. Quantitative PCR (QPCR) was performed using TaqMan fast universal PCR master mix and the ABI 7900HT real-time PCR machine (Applied Biosystems) and target genes were normalized to GAPDH (primers and dual-labeled probes from Applied Biosystems). Human XBP1 primers and probes used were: forward 5’-aagccaaggggaatgaagt-3’, reverse 5’-ccagaatgcccaacaggata-3’, active form probe 5’-gctgagtccgcagcaggtgcag-3’, inactive form probe 5’-agcactcagactacgtgcacct-3’. Mouse Xbp1 primers and probes used were: forward 5’-gatcctgacgaggttccaga-3’, reverse 5’-atgttctggggaggtgacaa-3’, active form probe 5’-agtccgcagcaggtgcaggc-3’, inactive form probe 5’-cagactatgtgcacctctgcagca-3’. Data were analyzed using the relative standard curve method. ANOVA test was used to assess statistically significant differences in XBP1 activation between perturbed and unperturbed samples.
Immunoblotting
Cell culture and heat separated epidermis samples were homogenized, and proteins were isolated using RIPA buffer (Sigma-Aldrich) containing protease inhibitors (Roche Applied Science). Protein quantification for equal loading was made with Thermo Scientific Pierce’s BCA assay kit. SDS-PAGE and transfer was performed using NuPAGE Novex 4–12% sodium dodecyl sulfate-polyacrylamide gels and nitrocellulose membranes according to Invitrogen’s NuPAGE protocol. Membranes were blocked in PBS with 5% non-fat dry milk and 0.05% Tween-20 and incubated with the following primary antibodies and dilutions: anti-Loricrin (Covance) at 1:3000, anti-Caspase 14 (Novus Biological) at 1:3000, and anti-β-Actin-HRP (Sigma-Aldrich) at 1:30,000. Chemiluminescent detection was performed with ECL Plus detection reagent (Thermo Scientific Pierce) using the Fujifilm LAS-3000 imaging system. Densitometry measurements normalizing to β-Actin were made with the Fujifilm Mulitgauge version 2.0 software.
Microscopy
Calcium Green 5N (CG5N) and Fluorescein were purchased from Invitrogen (Carlsbad, CA).
Two photon excitation FLIM measurements
Time domain FLIM measurements were performed using the same set up described in 21. Lifeteme data acquisition was controlled by the software SPCM (Becker and Hickl, Germany) which was also used to calculate the average lifetime decay times rendered in false color images in the central columns of figure 1A and B.
Data analysis
Phasor analysis of the lifetime data 34 was performed using the program SimFCS (Laboratory for Fluorescence Dynamics, UC-Irvine, CA) as described in 21. A fluorescein solution (pH 10) was used to reference the data, thus accounting for the instrument response function of the system.
The calcium concentration distribution at each layer of the sample (Figure 1) was calculated by binning the calcium range into four intervals: I1, concentrations lower than 1.5µM; I2, between 1.5 µM and 5 µM; I3, between 5 µM and 20 µM; I4, higher than 20µM. For each layer, the number of pixels with calcium concentration in each of the intervals was counted and normalized by the total number of pixels (frequency).
Statistical Analysis
Data were analyzed using the paired, two-tailed Students t test, except in Figure 6, where they were analyzed using an ANOVA test.
What is already known about this topic?
Ca2+ regulates both keratinocyte and epidermal differentiation.
Endoplasmic Reticulum (ER) Ca2+ depletion activates the XBP1 ER stress response pathway in keratinocytes.
Physiologic ER stress has been shown to mediate cell differentiation.
What does this study add?
Quantifies and localizes epidermal Ca2+ loss after barrier perturbation to intracellular stores such as the ER.
Shows that physiologic ER stress enhances epidermal differentiation.
This report is the first to show that barrier repair processes in vivo can be reproduced simply by depleting ER Ca2+.
Quantifies dose-related keratinocyte ER Ca2+ loss after thapsigargin treatment.
Acknowledgments
This work was supported by National Institutes of Health grants AR051930 (T.M.) and AR19098 (P.E.) and the San Francisco Veterans Medical Center. The authors wish to thank Debra Crumrine for expert technical assistance.
Footnotes
Conflict of interest: The authors do not have any conflict of interest
References
- 1.Lee J, Cha SK, Sun TJ, et al. PIP2 activates TRPV5 and releases its inhibition by intracellular Mg2+ J Gen Physiol. 2005;126:439–451. doi: 10.1085/jgp.200509314. [DOI] [PMC free article] [PubMed] [Google Scholar]
- 2.Reimold AM, Iwakoshi NN, Manis J, et al. Plasma cell differentiation requires the transcription factor XBP-1. Nature. 2001;412:300–307. doi: 10.1038/35085509. [DOI] [PubMed] [Google Scholar]
- 3.Tsang KY, Chan D, Bateman JF, et al. In vivo cellular adaptation to ER stress: survival strategies with double-edged consequences. J Cell Sci. 2010;123:2145–2154. doi: 10.1242/jcs.068833. [DOI] [PubMed] [Google Scholar]
- 4.Sakuntabhai A, Ruiz-Perez V, Carter S, et al. Mutations in ATP2A2, encoding a Ca2+ pump, cause Darier disease. Nat Genet. 1999;21:271–277. doi: 10.1038/6784. [DOI] [PubMed] [Google Scholar]
- 5.Kassar S, Charfeddine C, Zribi H, et al. Immunohistological study of involucrin expression in Darier's disease skin. J Cutan Pathol. 2008;35:635–640. doi: 10.1111/j.1600-0560.2007.00880.x. [DOI] [PubMed] [Google Scholar]
- 6.Foggia L, Aronchik I, Aberg K, et al. Activity of the hSPCA1 Golgi Ca2+ pump is essential for Ca2+-mediated Ca2+ response and cell viability in Darier disease. J Cell Sci. 2006;119:671–679. doi: 10.1242/jcs.02781. [DOI] [PubMed] [Google Scholar]
- 7.Prasad V, Okunade GW, Miller ML, et al. Phenotypes of SERCA and PMCA knockout mice. Biochem Biophys Res Commun. 2004;322:1192–1203. doi: 10.1016/j.bbrc.2004.07.156. [DOI] [PubMed] [Google Scholar]
- 8.Li L, Tucker RW, Hennings H, et al. Inhibitors of the intracellular Ca(2+)-ATPase in cultured mouse keratinocytes reveal components of terminal differentiation that are regulated by distinct intracellular Ca2+ compartments. Cell Growth Differ. 1995;6:1171–1184. [PubMed] [Google Scholar]
- 9.Sugiura K, Muro Y, Futamura K, et al. The unfolded protein response is activated in differentiating epidermal keratinocytes. J Invest Dermatol. 2009;129:2126–2135. doi: 10.1038/jid.2009.51. [DOI] [PubMed] [Google Scholar]
- 10.Mera K, Kawahara K, Tada K, et al. ER signaling is activated to protect human HaCaT keratinocytes from ER stress induced by environmental doses of UVB. Biochem Biophys Res Commun. 2010;397:350–354. doi: 10.1016/j.bbrc.2010.05.128. [DOI] [PubMed] [Google Scholar]
- 11.Elias P, Ahn S, Brown B, et al. Origin of the epidermal calcium gradient: regulation by barrier status and role of active vs passive mechanisms. J Invest Dermatol. 2002;119:1269–1274. doi: 10.1046/j.1523-1747.2002.19622.x. [DOI] [PubMed] [Google Scholar]
- 12.Elias PM, Ahn SK, Denda M, et al. Modulations in epidermal calcium regulate the expression of differentiation-specific markers. J Invest Dermatol. 2002;119:1128–1136. doi: 10.1046/j.1523-1747.2002.19512.x. [DOI] [PubMed] [Google Scholar]
- 13.Menon GK, Bommannan DB, Elias PM. High-frequency sonophoresis: permeation pathways and structural basis for enhanced permeability. Skin Pharmacol. 1994;7:130–139. doi: 10.1159/000211287. [DOI] [PubMed] [Google Scholar]
- 14.Menon GK, Elis PM, Feingold KR. Integrity of the permeability barrier is crucial for maintenance of the epidermal calcium gradient. Br J Dermatol. 1994;130:139–147. doi: 10.1111/j.1365-2133.1994.tb02892.x. [DOI] [PubMed] [Google Scholar]
- 15.Menon GK, Price LF, Bommannan B, et al. Selective obliteration of the epidermal calcium gradient leads to enhanced lamellar body secretion. J Invest Dermatol. 1994;102:789–795. doi: 10.1111/1523-1747.ep12377921. [DOI] [PubMed] [Google Scholar]
- 16.Elias PM, Nau P, Hanley K, et al. Formation of the epidermal calcium gradient coincides with key milestones of barrier ontogenesis in the rodent. J Invest Dermatol. 1998;110:399–404. doi: 10.1046/j.1523-1747.1998.00151.x. [DOI] [PubMed] [Google Scholar]
- 17.Feingold KR. Thematic review series: skin lipids. The role of epidermal lipids in cutaneous permeability barrier homeostasis. J Lipid Res. 2007;48:2531–2546. doi: 10.1194/jlr.R700013-JLR200. [DOI] [PubMed] [Google Scholar]
- 18.Demerjian M, Hachem JP, Tschachler E, et al. Acute modulations in permeability barrier function regulate epidermal cornification: role of caspase-14 and the protease-activated receptor type 2. Am J Pathol. 2008;172:86–97. doi: 10.2353/ajpath.2008.070161. [DOI] [PMC free article] [PubMed] [Google Scholar]
- 19.Denda M, Fuziwara S. Visible radiation affects epidermal permeability barrier recovery: selective effects of red and blue light. J Invest Dermatol. 2008;128:1335–1336. doi: 10.1038/sj.jid.5701168. [DOI] [PubMed] [Google Scholar]
- 20.Bianco SD, Peng JB, Takanaga H, et al. Marked disturbance of calcium homeostasis in mice with targeted disruption of the Trpv6 calcium channel gene. J Bone Miner Res. 2007;22:274–285. doi: 10.1359/jbmr.061110. [DOI] [PMC free article] [PubMed] [Google Scholar]
- 21.Celli A, Sanchez S, Behne M, et al. The epidermal Ca(2+) gradient: Measurement using the phasor representation of fluorescent lifetime imaging. Biophys J. 2010;98:911–921. doi: 10.1016/j.bpj.2009.10.055. [DOI] [PMC free article] [PubMed] [Google Scholar]
- 22.Lee SH, Choi EH, Feingold KR, et al. Iontophoresis itself on hairless mouse skin induces the loss of the epidermal calcium gradient without skin barrier impairment. J Invest Dermatol. 1998;111:39–43. doi: 10.1046/j.1523-1747.1998.00226.x. [DOI] [PubMed] [Google Scholar]
- 23.Choi EH, Kim MJ, Ahn SK, et al. The skin barrier state of aged hairless mice in a dry environment. Br J Dermatol. 2002;147:244–249. doi: 10.1046/j.1365-2133.2002.04918.x. [DOI] [PubMed] [Google Scholar]
- 24.Bickenbach JR, Greer JM, Bundman DS, et al. Loricrin expression is coordinated with other epidermal proteins and the appearance of lipid lamellar granules in development. J Invest Dermatol. 1995;104:405–410. doi: 10.1111/1523-1747.ep12665896. [DOI] [PubMed] [Google Scholar]
- 25.Denecker G, Ovaere P, Vandenabeele P, et al. Caspase-14 reveals its secrets. J Cell Biol. 2008;180:451–458. doi: 10.1083/jcb.200709098. [DOI] [PMC free article] [PubMed] [Google Scholar]
- 26.Menon G, Anand KJ, McIntosh N. Practical approach to analgesia and sedation in the neonatal intensive care unit. Semin Perinatol. 1998;22:417–424. doi: 10.1016/s0146-0005(98)80057-8. [DOI] [PubMed] [Google Scholar]
- 27.Callewaert G, Parys JB, De Smedt H, et al. Similar Ca(2+)-signaling properties in keratinocytes and in COS-1 cells overexpressing the secretory-pathway Ca(2+)-ATPase SPCA1. Cell Calcium. 2003;34:157–162. doi: 10.1016/s0143-4160(03)00070-8. [DOI] [PubMed] [Google Scholar]
- 28.Aberg KM, Racz E, Behne MJ, et al. Involucrin expression is decreased in Hailey-Hailey keratinocytes owing to increased involucrin mRNA degradation. J Invest Dermatol. 2007;127:1973–1979. doi: 10.1038/sj.jid.5700785. [DOI] [PubMed] [Google Scholar]
- 29.Aberg KM, Radek KA, Choi EH, et al. Psychological stress downregulates epidermal antimicrobial peptide expression and increases severity of cutaneous infections in mice. J Clin Invest. 2007;117:3339–3349. doi: 10.1172/JCI31726. [DOI] [PMC free article] [PubMed] [Google Scholar]
- 30.Li L, Tucker RW, Hennings H, et al. Chelation of intracellular Ca2+ inhibits murine keratinocyte differentiation in vitro. J Cell Physiol. 1995;163:105–114. doi: 10.1002/jcp.1041630112. [DOI] [PubMed] [Google Scholar]
- 31.Palmer AE, Jin C, Reed JC, et al. Bcl-2-mediated alterations in endoplasmic reticulum Ca2+ analyzed with an improved genetically encoded fluorescent sensor. Proc Natl Acad Sci U S A. 2004;101:17404–17409. doi: 10.1073/pnas.0408030101. [DOI] [PMC free article] [PubMed] [Google Scholar]
- 32.Palmer CN, Irvine AD, et al. Terron-Kwiatkowski A et al. Common loss-of-function variants of the epidermal barrier protein filaggrin are a major predisposing factor for atopic dermatitis. Nat Genet. 2006;38:441–446. doi: 10.1038/ng1767. [DOI] [PubMed] [Google Scholar]
- 33.Ohata Y, Hashimoto T, Nishikawa T. Comparative study of autoantigens for various bullous skin diseases by immunoblotting using different dermo-epidermal separation techniques. Clin Exp Dermatol. 1995;20:454–458. doi: 10.1111/j.1365-2230.1995.tb01376.x. [DOI] [PubMed] [Google Scholar]
- 34.Digman MA, Caiolfa VR, Zamai M, et al. The phasor approach to fluorescence lifetime imaging analysis. Biophys J. 2008;94:L14–L16. doi: 10.1529/biophysj.107.120154. [DOI] [PMC free article] [PubMed] [Google Scholar]