Abstract
Cleaved, cation-derivatized Muscovite mica is utilized extensively in AFM imaging due to its flatness over large areas (millimeter cleavage planes with local RMS roughness <0.3 nm), ease of preparation and ability to adsorb charged biomolecules such as DNA1–3. In particular, NiCl2 treatment has become a common method for controlling DNA adsorption on mica substrates while retaining the mica’s ultra flat surface4. While several studies have modeled the mica:metal-ion:DNA system using macroscopic colloidal theory (DLVO, etc) 4–8, Ni-mica’s physicochemical properties have not been well characterized on the nanoscale. Efforts to manipulate and engineer DNA nanostructures would benefit greatly from a better understanding of the surface chemistry of Ni:mica. Here we present in-situ, nanometer- and attogram-scale measurements, and thermodynamic simulation results that show the surface chemistry of nickel treated mica is more complex than generally appreciated by AFM practitioners, due to metal ion speciation effects present at neutral pH. We also show that under certain preparations, Ni:Mica allows in situ, nanoscopic nucleotide sequence mapping within individual surface-adsorbed DNA molecules by permitting localized, controlled desorption of the double helix by soluble DNA binding enzymes. These results should aid efforts to precisely control DNA:mica binding affinity, particularly at physiological pH ranges required by enzymatic biochemistry (pH 7.0–8.5)4–8, and facilitate development of more complex and useful biochemical manipulations of adsorbed DNA, such as single molecule sequencing.
Keywords: Single Molecule DNA Sequence, Surface-Modified Mica, ToF-SIMS, AFM and surface analysis
Engineered planar substrates, such as chemically-derivatized glass, silicon/silicon oxide, and gold-thiol-based self assembled monolayers (SAMs) are critical enabling components in widely used and commercially important technologies such as ‘next gen’ DNA sequencing9, 10, nucleic acid microarrays11, and surface plasmon resonance biosensors (Biacore, etc)12. Because most of these technologies employ far-field optical microscopy or photonic detection, surface topography and nanometer-scale variations in surface chemistry of the substrate is not of concern. However, in scanning probe microscopy of nucleic acids and nucleic acid-protein complexes, substrate surface topography and local physico-chemical properties are critical issues. When used with the proper attention to substrate:sample preparation, scanning probe microscopy offers substantial advantages over photonic detection in terms of sensitivity (no labels), resolution (sub-molecular-to-atomic) and breadth of measurement modalities (topography, stiffness, adhesiveness, as well as thermal and electrostatic properties). Paradoxically, substrates used in scanning probe microscopy tend to be less engineered and less well characterized than are scaffolds and surfaces used in systems with photonic detection. This is particularly true in the of study of biopolymers, such as DNA and protein fibers of various kinds, which can be microns-to-millimeters in length and thus require vast areas of atomically-flat surface that can be very difficult to achieve on chemically modified glass or gold:thiol:SAM substrates. Freshly cleaved mica complexed with multi-valent cations is a very popular but simple system used to bind DNA for AFM imaging in liquid and in air. In particular, Nickel (II) ion, applied in the form of an aqueous chloride or nitrate salt solution, has been shown to produce unusually strong DNA adsorption on mica compared to similar divalent metal ions and this has been used to advantage in a number of studies, including our own13, where strong adsorption is required1, 4. Despite Ni:mica’s widespread use by the AFM community and its potential as a substrate for DNA nanotechnologies of various kinds, knowledge of its nanoscale physico-chemistry is limited.
A series of classic studies used surface force apparatus (SFA) to study the interaction between two cleaved mica surfaces in various mono- and divalent aqueous metal-ion electrolytes14, 15 (though not including Ni2+). These authors analyzed the mica-mica interaction in terms of an extended DLVO theory of colloid stability. Notably, their experiments were mostly conducted at pH 5.8. Workers studying the biochemistry of single DNA molecules bound to mica with AFM have extended this classic SFA-based work, using a generalization of the DLVO theory to model the force interaction of a charged DNA molecule and mica surface, rather than two mica surfaces, in aqueous metal ion electrolytes at physiological pH (7.0–8.5)4, 5, 7, 8. However, metal ions in solution are known to exhibit complex speciation behavior16, and this important aspect of metal ion chemistry has not been taken into account in the past modeling and discussion of DNA binding to mica. Further, the nickel-ion treated mica surface itself has not been directly characterized due to the minute quantities of material involved.
In this report, we use a combination of nanoscale analytical techniques to probe the properties of Ni:mica on the molecular scale. We employ an exquisitely sensitive surface analysis technique, secondary ion mass spectrometry to confirm in situ partial ion exchange between Ni2+ in the solution and native K+ present on the untreated mica surface. Using AFM we show that a smooth, stable but difficult-to-detect molecular monolayer can form on mica treated with aqueous NiCl2 at pH ~7, likely a result of metal or metal-hydroxide precipitates. Importantly, this result indicates that the actual substrate:molecule interaction can be mediated in some cases by a molecular adlayer of different physico-chemical properties than the mica itself. We present thermodynamic simulations which show that nickel-ion speciation in aqueous solutions is highly sensitive to pH in the range 6–8. As a consequence the solution concentration of the divalent species can vary widely from what is assumed, and the speciation of other metal ions-complexes can be unpredictable unless great care is taken to stabilize the pH condition and redox condition of the solution. Taken together, our simulation and experimental results strongly suggest more detailed modeling and experiments are needed to properly understand and control the mica:metal-ion:DNA system at physiological pH. In order to determine the biofunctional characteristics of the Ni:mica surfaces we digested mica-adsorbed plasmid DNA with a restriction enzyme, RsaI. We show that Ni:mica is compatible with enzymology conducted directly on the surface-fixed DNA molecules, and can be used to precisely locate DNA sequence motifs within single molecules17. Similarly, it has potential uses as a scaffold or substrate for engineering DNA nanostructures and in other areas of DNA nanotechnology, like single molecule DNA sequencing.
Results and Discussion
In-situ ToF-SIMS spectrometry of Ni2+ mica
We used Time-of-Flight Secondary Ion Mass Spectrometry (ToF-SIMS) to probe elemental properties in the first few atomic layers of the Ni-derivatized mica surface. ToF-SIMS uses energetic primary ions to probe the sample surface. As a result of the impact, secondary ions are generated from a close vicinity (a few angstroms) of the impinging point on the sample and are collected for deducing chemical information. These secondary ions usually come from the top couple atomic layers. In ToF-SIMS, the primary ion is pulsed and only a small dose (less than 103 ions/cm2) of primary ion is delivered to the sample surface during the entire process, thus, only a small fraction of the top surface layer is impacted and the rest is essentially intact. Furthermore, the primary ion beam can be focused to a sub-micron-sized spot and scanned across the sample, generating a spatial mapping of the surface elemental composition. As such, it is an ideal tool for characterizing the quantity and distribution of nickel adsorbates on the mica surface.
Spectra from untreated and treated Si wafer sample
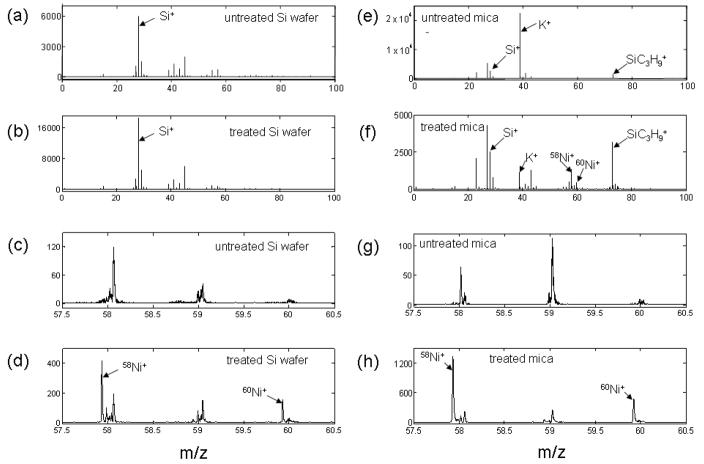
We took ToF-SIMS spectra from the surface of Ni-treated silicon wafers, for reference. The positive spectra for the blank Si wafer and NiCl2 solution treated Si wafer look very similar at a glance, as showing in the plots below. In Fig. 1, plots (a) and (b), show m/z range from 0 to 100 for blank and treated Si wafer. Plot (c) and (d) show a zoom in view in the m/z range 57.5~60.5. Close examination reveals that the blank Si wafer does not carry Ni+ signal, while the treated Si wafer does. The relative abundance of 58Ni and 60Ni isotopes observed match the naturally occurring ratio of 0.68/0.26 closely. Notice that, the Ni signal is not dominant in the spectrum of NiCl2 treated Si wafer, which may indicate that the treatment does not introduce excessive Ni on the sample surface. The peaks in Fig. 1(c and d) represent the two Ni isotopic peaks and other peaks represent hydrocarbons due to surface contamination. For the negative spectra (not shown) on the Si wafers, Cl− shows up both in the untreated and treated Si wafer, but the treated Si wafer have a higher relative Cl− content. While there are Cl− in the untreated Si wafer spectrum, most likely due to salt intrinsic to the wafer itself, on the treated Si wafer the relative intensity of 35Cl− to Si− (or 35Cl− to CN−) is approximately six times that of the untreated Si wafer.
Figure 1.
ToF-SIMS spectra: (a) and (c) for untreated silicon wafers, (e) and (g) for untreated mica, (b) and for Ni-treated silicon wafers and (f) and (h) for Ni-treated mica
Spectra from untreated and treated mica sample
Both untreated and treated mica samples were mounted with a metal grid to help produce an effective extraction field and during acquisition, electron charge neutralization was used. Figure 1 shows the typical spectra for blank mica (e) and NiCl2 solution treated mica (f) in m/z range from 0 to 100. It is apparent that the untreated mica has a relatively higher K+ signal (K+:Si+~7.6:1), and does not have Ni ions. Meanwhile, the NiCl2 solution treated mica does show Ni+ ion signals, accompanied by an approximately 19-fold reduced K+ signal versus the untreated (K+:Si+~0.4:1). Plot (g) and (h) show a zoom in view in the m/z range 57.5~60.5. The negative spectra (not shown) for both samples Cl− peaks, but the relative intensity is almost doubled for treated mica. For the blank, 35Cl−:CN−~1.2 (35Cl−:Si−~0.2), while in the treated mica, 35Cl−:CN−~2.2 (35Cl−:Si−~0.4).
Mapping the spatial uniformity of the Ni adlayer to sub-micron resolution
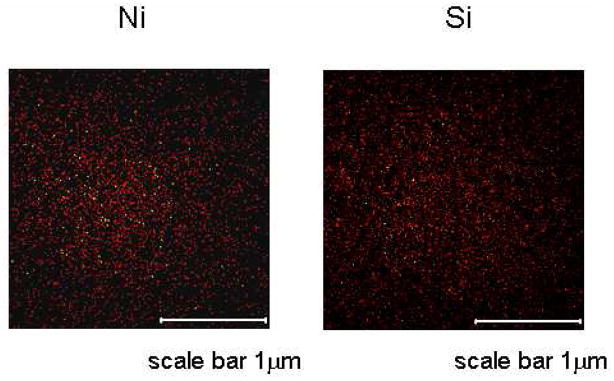
Figure 2 shows the mapping of Si and Ni fragments from mica surface treated with Ni solution. Because mica surface contains -OH groups, the intensity of the Si fragments is directly proportional to the distribution of the ion exchange sites for Ni ions. Figure 2 indicates an even distribution of Ni with no agglomeration.
Figure 2.
ToF-SIMS images showing the distribution of Si and Ni on Mica surface
AFM measurements of Ni2+ mica surface roughness
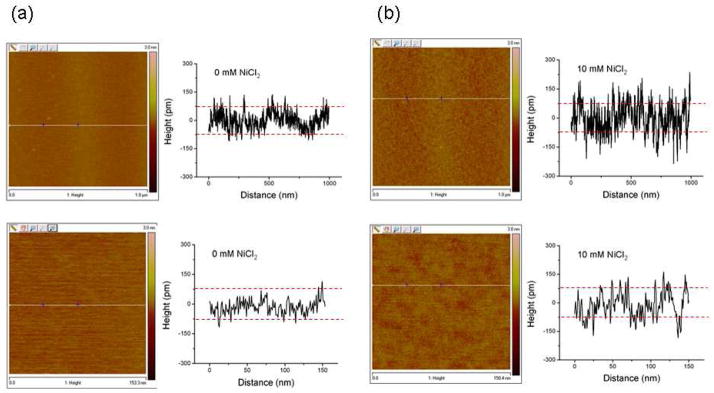
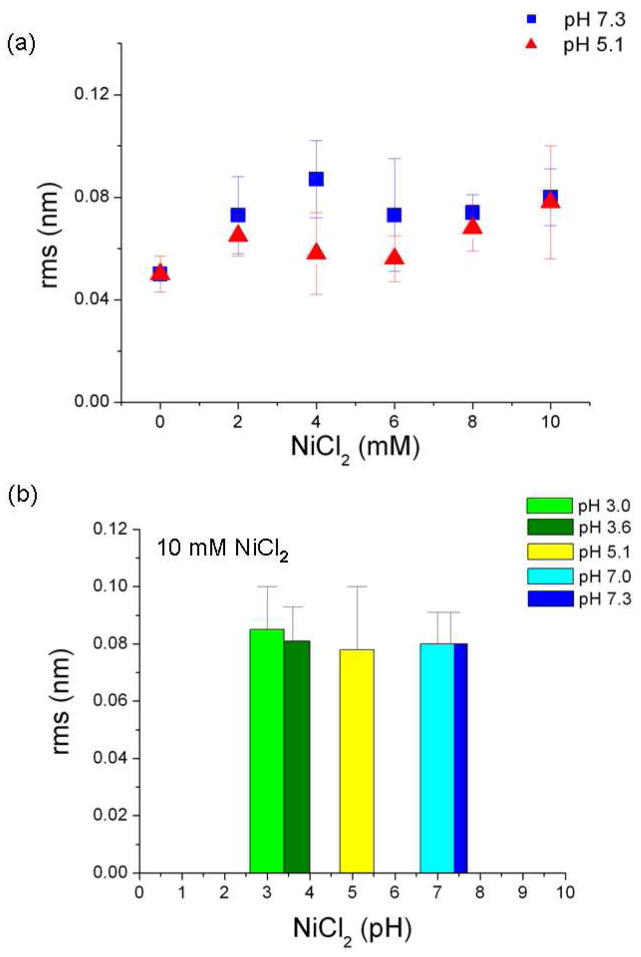
The Ni2+ -treated mica surfaces were flat, uniform, and stable and can be used for DNA imaging. Figure 3 shows representative images, with cross-sectional profiles, from samples treated with water (a), or 10 mM NiCl2 (b). The average surface roughness of the sample treated with water is 0.20 nm or less, peak-to-peak, while the 10 mM NiCl2 treated sample is slightly rougher, 0.30 nm peak-to-peak, and is mottled in appearance. In order to determine the effect of NiCl2 solution concentration on the surface roughness, samples were prepared using the standard procedure, with NiCl2 concentrations varying from 0 to 10 mM (Figure 4a). There is an obvious difference between the apparent surface roughness without and with NiCl2, while within the experimental error roughness is independent of NiCl2 concentration at both pH 7.1 and pH 5.1. The roughness increases with increasing NiCl2, as expected, and supports the notion that the nickel ions make up the thin adlayer described in Figure 3. The effect of pH of the NiCl2 solution (10 mM) on the preparation at is presented in Fig. 4b. We found no significant difference in roughness between surfaces prepared from solutions with pH 3.0, 3.6, 5.1 7.0 or 7.3. We note that the increase in the apparent surface roughness may be caused by several factors in addition to pure geometrical effects, including ion adsorption onto the AFM tip, the change in ion-mediated van der Waals, and potentially strong electrostatic interactions between Ni-ions adsorbed onto a mica surface and the AFM tip. The measurements were conducted in tapping mode in air at ~30% relative humidity, and under these conditions we would expect less than a complete monolayer of adsorbed water molecules on the mica surface. In this case, we feel that discussion of the tip-surface interaction in terms of electrical double layer forces, a concept typically associated with ionic solutions, would be confusing to the readers.
Figure 3.
Typicalsurface cross sections of (a) 0 mM and (b) 10 mM NiCl 2 deposited on mica. Dashed red lines at +/− 100 pm are for reference
Figure 4.
(a) Surface roughness of NiCl2 treated mica as function of NiCl2 concentration. (b) Surface roughness for of mica treated with 10 mM NiCl2 solutions, at solution pH from 3.0 to 7.3.
Thermodynamic simulation of aqueous Ni ion speciation
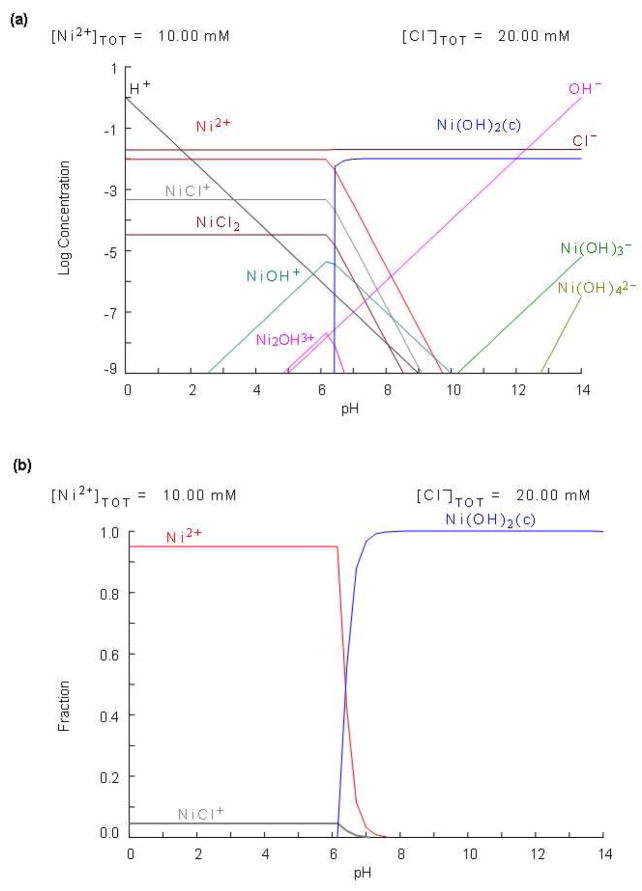
In an effort to further understand the origin of the surface roughness observed with AFM, we conducted thermodynamic modeling of the chemical system containing Ni2+ ions in aqueous solutions. All the thermodynamic modeling calculations refer to the bulk solutions only. The different phase formation under closed system and/or surrounding conditions can be calculated from the changes of the free energy, ΔG, of the reaction under given conditions. In the thermodynamic modeling of the aqueous Ni(II) ions, we define the system to be investigated by the following main components: Ni2+, NiCl+, NiCl2, Ni(OH)+, Ni(OH)2, Ni(OH)3− and Ni(OH) 4 2−. Figure 5(a) shows concentrations of all possible nickel species can be formed at different pH. As shown in Fig. 5(b), the Ni2+ ions form weak complexes with Cl− ions in acidic pH range. However, by increasing pH, Ni2+ions form stable solid precipitate of Ni(OH)2 in the pH range of 7–14. Based on the thermodynamics modeling, pH range of 6–8 can produce many nickel species, which may lead to inconsistent surface chemistry and non-uniform DNA binding between replicate preparations. The pH below 6 is the optimum pH for introducing nickel species to mica surface. Interestingly, pH does not appear to change the roughness of the samples under the conditions used here. This indicates that while the surface layer associated with NiCl2 may be in the form of nickel hydroxide, there is no large change in the deposition properties above pH 6.0 as is suggested by our thermodynamic simulation.
Figure 5.
Thermodynamic modeling diagram showing (a) log concentration of all possible nickel species Ni species vs pH (b) the distributions of the fraction Ni species vs pH
In situ detection of nucleotide sequence in adsorbed DNA molecules
In order to determine the biofunctional characteristics of the Ni:mica surfaces, we elongated, fixed and in situ digested plasmid DNA with a restriction enzyme, RsaI. Rsa I recognizes a four-nucleotide sequence, GTAC, and cleaves both strands of the double helix at that location in the molecule, assuming the chemical environment allows the enzyme to function normally. In this system both the conformation of the adsorbed DNA and the enzyme cleavage kinetics can give qualitative information about the fate of Ni bound to the substrate, and the strength of the DNA:mica interaction.
Figure 6 shows a typical image, with two linearized pUC19 molecules elongated on NiCl2 treated mica surface and then digested in aqueous salt buffer for 30 min at 37°C. AFM images were taken from dried samples directly. Height profiles taken along the backbone contour of the molecules show depressions corresponding to the locations of GTAC sequence sites predicted from the know sequence of pUC19. PUC19 has two RsaI recognition sites, and upon complete digestion fragments of 75 nm, 223 nm, and 584 nm are produced (assuming 0.33 nm/bp of B-DNA). Due to the attractions between the DNA molecule and the Ni2+ surface, fragments remain adhered to the surface in their original order within the DNA molecule. The Ni2+ surface adheres the DNA to the surface, but loosely enough so that the ends at the gap sites have flexibility to move either during enzyme incubation or during post digestion washing. This property results in “swinging” ends that enlarge gaps produced by enzyme cleavages. Proteins can also adhere to the Ni:mica surface, though with less avidity than the charged DNA molecule, as can be seen in Fig. 6 where RsaI enzymes surround digested pUC19.
Figure 6.
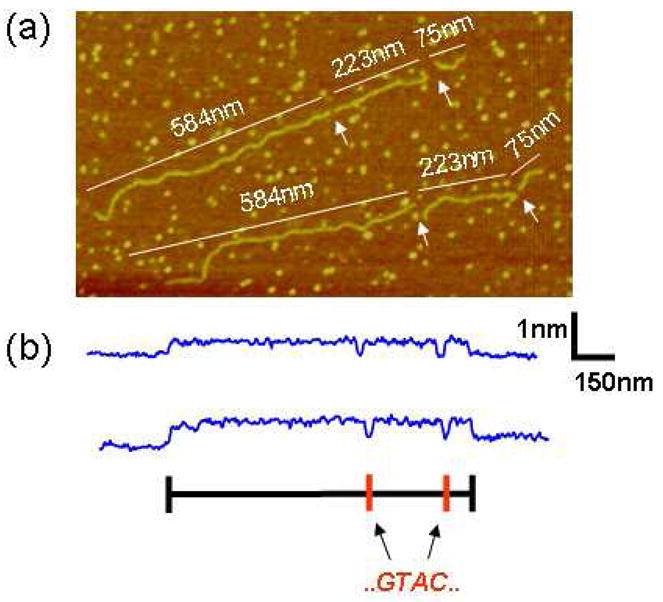
(a) Image of two pUC19 molecules on treated mica (10 mM NiCl2), after in situ digestion with restriction enzyme RsaI (recognition sequence GATC). White arrows indicate gaps corresponding to the location of GTAC sequences within the DNA molecule. Fragment lengths (nm) are indicated on image. (b) Corresponding height profile plots taken along the backbone contour of each molecule.
In our experiments, a majority of the plasmid molecules on the surface remained in an elongated, non-equilibrium conformation, through the entire digestion, washing and drying process. It has been established that DNA molecules bound loosely to mica will relax to a random conformation in the 2D plane indicative of nearly free diffusion in the plane, even while apparently remaining confined to the surface8. Clearly, in this case, the DNA are bound to the Ni:mica strongly enough to resist entropic relaxation. However, typically 30–40% of the recognition sites available are cleaved (see Methods). This indicates that the adsorbed molecules retained enough local conformational flexibility to permit the enzyme to dimerize, encircle the double helix, and access the bases via the DNA major groove18. This in turn suggests a balance between tight binding of the DNA to the mica surface and a local flexibility, as could be expected from distributed “adhesion points”, as might occur if the Ni ions were complexed tightly, but not all of the available complexation sites on the crystal plane were occupied.
An important observation with respect to enzyme fidelity is that the frequency of double strand breaks observed at locations not corresponding to the enzyme recognition sequence was low, roughly 2% of the total cleavages. This level of non-specific cleavage is indistinguishable from simple breakage due to overstretching and drying observed in cases where no enzyme is applied. Therefore we conclude that the Ni2+ does not induce significant non-specific cleavage of surface adsorbed DNA molecules, which is surprising because this infidelity can occur when restriction enzymes are used in solutions containing divalent cations other than the required Mg2+ cofactor. Given that all of the available sites on the bound molecules are not cleaved, it is possible that the Ni2+ inhibits the enzyme directly, or that simply the DNA is bound so tightly to the surface in some places that the enzyme cannot access the double helix in the required conformation.
CONCLUSIONS
Here we have presented the first direct surface analysis of Ni2+-treated mica used to bind DNA for single molecule biochemical studies. Using a ToF-SIMS, a highly sensitive surface analysis technique, we demonstrated that Ni ions in solution are exchanged with native K+ ions on the mica surface, and this exchange is responsible for the alteration in mica surface properties that facilitate strong binding of DNAs. Our thermodynamic simulation of Ni ion speciation reveals that the concentration of divalent cations in solution is a strong function of pH in the pH range 6–8. This is important because current models of DNA:mica binding are driven by the solution concentration of the divalent species5, 8, which our results show can vary widely from what is assumed, and the speciation of other metal ions-complexes can be unpredictable unless great care is taken to stabilize the pH condition and redox condition of the solution.
Using AFM we detected a thin adlayer that forms in when mica is treated with NiCl2 solutions. The roughness imparted by this layer is not sensitive to the pH of the deposition solution, over the range pH 3.0–7.0. This layer can be difficult to distinguish from the bare mica surface itself. The results of the thermodynamic modeling, together with AFM and ToF-SIMS data, can be used for the selection of the optimum experimental conditions for the adsorption of Ni2+ from aqueous solutions onto the mica surface. In this way it is possible to establish the chemical conditions (including pH, redox potential, concentration of the different ions used, etc.) as well as the boundary conditions in which Ni(II) ions could be adsorbed into mica surface reproducibly.
Judged by the activity restriction enzymes, a reasonably robust 30–40% in situ cleavage efficiency with little to no non-specific activity, NiCl2 treatment not only provides a smooth, adhesive monolayer on mica capable of strongly adsorbing DNA, but also provides a surface suitable for stable bioactivity. These results are comparable to those we have achieved on APTES treated mica surfaces17, which require more preparation time, and have less reproducible roughness and DNA binding properties than does Ni:mica. Based on these results, we expect that DNA polymerases, which require similar levels of template molecule access and flexibility as restriction enzymes, would also function on molecules adsorbed to Ni:mica. Optical microscopy of in situ DNA polymerase activity on molecules fixed to modified glass substrates, using fluorescently-labeled nucleotides and intercalating dyes as reporters is common, and is a key step in the technologically important ‘next-gen’ DNA sequencing method. The use of “bioactive” Ni:mica substrates, instead of modified, relatively rough glass or silicon substrates, could open these important biochemical systems to investigation with scanning probe microscopies, and their attendant advantages of spatial resolution and chemical/mechanical/electronic imaging modes.
Methods
Mica and silicon substrates
Mica is a layered silicate of the general formula K(Al2)Si3Al)O10(OH)2, whose structure and properties have been reviewed elsewhere19. Samples were prepared on freshly cleaved 9.9 mm V1 mica discs (Ted Pella, Inc.). Following cleavage, the mica was derivatized with 100 μL aliquots of 10, 8, 6, 4, and 2 mM NiCl2 solutions for 10 seconds, rinsed with ultra pure water, and then dried with a stream of dry nitrogen. Samples measured with ToF-SIMS were derivatized with 10 mM NiCl2 only. Silicon samples cut from a 100 mm silicon wafer (University Wafer) were cleaned in heated 3:1 sulfuric acid and 30% hydrogen peroxide piranha solution, rinsed thoroughly with ultra pure water, and dried with N2. Silicon were derivatized with 100 μL aliquots of 10mM NiCl2 solution and were either blown dry with N2 or evaporated at room temperature, then rinsed with ultra pure water, and dried with a stream of dry nitrogen. All control samples, 0 mM NiCl2 on mica and silicon, used ultra pure water in lieu of NiCl2 solutions. All samples were stored in N2 filled containers until time of measurement. NiCl2 titrations of 10, 8, 6, 4, and 2 mM NiCl2 were made from a 0.5 M NiCl2 stock solution of ultra pure water (pH 7.7–8.0) and anhydrous Nickel (II) Chloride, 98% pure (Aldrich) which is then frozen in aliquots until time of use. The pH of the stock solutions was in the range of 6.58–6.61. Solutions are filtered before deposition onto substrates and applied in low humidity (22%) at 22 °C in 100 uL aliquots. The pH of the 10 mM NiCl2 solutions ranged from 7.65–7.73.
ToF-SIMS
The spectra were collected on a TRIFT II ToF-SIMS, using 22k eV Au+ primary ion over 25 μm area. The samples were analyzed as received, no rising or any cleaning. For the untreated mica sample, mica was pealed off from the backing glass; for the treated sample, the backing glass slice was cut to fit into the instrument.
AFM
AFM images were acquired with a Veeco Dimension 3000 AFM, in tapping mode, using manufacturer-supplied FESP cantilevers (k = 3 N/m, f = 60–100kHz). Imaging was conducted at 22°C and ~30% humidity. Images were acquired using linear scanning speeds of ~3–9 μm s−1 with an average resolution of 512 × 512 pixels per 2 × 2 μm area.
Thermodynamic Simulation of Ion Speciation
The modeling of the nickel species was performed using chemical equilibria and information on stability constants for all the basic nickel chlorides included in the software Make Equilibrium Diagrams Using Sophisticated Algorithms20, 21.
DNA deposition and in-situ enzymatic digestion
Linear pUC19 DNA molecules were elongated and deposited onto derivatized mica surfaces using fluid flow22. After DNA has been elongated and immobilized on derivatized mica surface, 100 ul aliquots of buffer solution (10 mM Tris-HCl, pH 7.5 at 37°C, 10 mM MgCl2) containing 2 units of RsaI restriction enzyme (recognition sequence GTAC) were deposited on mica samples and incubated at 37 °C in humidified heater for 30 minutes to 1 hour. Enzyme solution is then blown off with nitrogen, rinsed vigorously three times with ultra pure water, and dried with nitrogen. To quantify digestion kinetics of the surface bound DNAs, 40 representative, randomly selected AFM images, from five independently prepared substrates, containing 132 digested pUC19 molecules were scored for the number of specific and non-specific cleaves, based on the know DNA sequence of the plasmid. Of a possible 264 specific cleavage sites, 108 (41%) were successfully cleaved with 5 (2%) additional double strand breaks in locations not containing an enzyme recognition site.
Acknowledgments
This research was supported by NIH grant R21 GM08099.
References
- 1.Hansma HG, Laney DE. Biophys J. 1996;70:1933–1939. doi: 10.1016/S0006-3495(96)79757-6. [DOI] [PMC free article] [PubMed] [Google Scholar]
- 2.Guthold M, Zhu XS, Rivetti C, Yang GL, Thomson NH, Kasas S, Hansma HG, Smith B, Hansma PK, Bustamante C. Biophys J. 1999;77:2284–2294. doi: 10.1016/S0006-3495(99)77067-0. [DOI] [PMC free article] [PubMed] [Google Scholar]
- 3.McMaster TJ, Miles MJ, Shewry PR, Tatham AS. Langmuir. 2000;16:1463–1468. [Google Scholar]
- 4.Pietrement O, Pastre D, Fusil S, Jeusset J, David MO, Landousy F, Hamon L, Zozime A, Le Cam E. Langmuir. 2003;19:2536–2539. [Google Scholar]
- 5.Sushko ML, Shluger AL, Rivetti C. Langmuir. 2006;22:7678–7688. doi: 10.1021/la060356+. [DOI] [PubMed] [Google Scholar]
- 6.Pastre D, Hamon L, Landousy F, Sorel I, David MO, Zozime A, Le Cam E, Pietrement O. Langmuir. 2006;22:6651–6660. doi: 10.1021/la053387y. [DOI] [PubMed] [Google Scholar]
- 7.Cheng H, Zhang K, Libera JA, de la Cruz MO, Bedzyk MJ. Biophys J. 2006;90:1164–1174. doi: 10.1529/biophysj.105.070649. [DOI] [PMC free article] [PubMed] [Google Scholar]
- 8.Pastre D, Pietrement O, Fusil P, Landousy F, Jeusset J, David MO, Hamon C, Le Cam E, Zozime A. Biophys J. 2003;85:2507–2518. doi: 10.1016/s0006-3495(03)74673-6. [DOI] [PMC free article] [PubMed] [Google Scholar]
- 9.Margulies M, Egholm M, Altman WE, Attiya S, Bader JS, Bemben LA, Berka J, Braverman MS, Chen YJ, Chen ZT, Dewell SB, Du L, Fierro JM, Gomes XV, Godwin BC, He W, Helgesen S, Ho CH, Irzyk GP, Jando SC, Alenquer MLI, Jarvie TP, Jirage KB, Kim JB, Knight JR, Lanza JR, Leamon JH, Lefkowitz SM, Lei M, Li J, Lohman KL, Lu H, Makhijani VB, McDade KE, McKenna MP, Myers EW, Nickerson E, Nobile JR, Plant R, Puc BP, Ronan MT, Roth GT, Sarkis GJ, Simons JF, Simpson JW, Srinivasan M, Tartaro KR, Tomasz A, Vogt KA, Volkmer GA, Wang SH, Wang Y, Weiner MP, Yu PG, Begley RF, Rothberg JM. Nature. 2005;437:376–380. doi: 10.1038/nature03959. [DOI] [PMC free article] [PubMed] [Google Scholar]
- 10.Holt RA, Jones SJM. Genome Res. 2008;18:839–846. doi: 10.1101/gr.073262.107. [DOI] [PubMed] [Google Scholar]
- 11.Chee M, Yang R, Hubbell E, Berno A, Huang XC, Stern D, Winkler J, Lockhart DJ, Morris MS, Fodor SPA. Science. 1996;274:610–614. doi: 10.1126/science.274.5287.610. [DOI] [PubMed] [Google Scholar]
- 12.Oshannessy DJ, Brighamburke M, Peck K. Anal Biochem. 1992;205:132–136. doi: 10.1016/0003-2697(92)90589-y. [DOI] [PubMed] [Google Scholar]
- 13.Reed J, Hsueh C, Mishra B, Gimzewski JK. Nanotechnology. 2008:19. doi: 10.1088/0957-4484/19/38/384021. [DOI] [PubMed] [Google Scholar]
- 14.Pashley RM, Quirk JP. Colloids Surf. 1984;9:1–17. [Google Scholar]
- 15.Pashley RM, Israelachvili JN. J Colloid Interface Sci. 1984;97:446–455. [Google Scholar]
- 16.Burgess J. Metal ions in solution. Halsted Press; New York: 1978. p. 481. [Google Scholar]
- 17.Reed J, Mishra B, Pittenger B, Magonov S, Troke J, Teitell MA, Gimzewski JK. Nanotechnology. 2007;18:044032, 15. doi: 10.1088/0957-4484/18/4/044032. [DOI] [PMC free article] [PubMed] [Google Scholar]
- 18.Pingoud A, Fuxreiter M, Pingoud V, Wende W. Cell Mol Life Sci. 2005;62:685–707. doi: 10.1007/s00018-004-4513-1. [DOI] [PubMed] [Google Scholar]
- 19.Radoslovich EW. Acta Crystallogr. 1960;13:919–932. [Google Scholar]
- 20.Puigdomenech I. Abstracts of Papers of the American Chemical Society. 2000;219:248-IEC. [Google Scholar]
- 21.Puigdomenech I. TRITA-OOK-3010. Royal Institute of Technology, Dept. Inorg. Chemistry; Stockholm: 1983. INPUT, SED, and PREDOM: Computer programs drawing equilibrium diagrams; p. 12. [Google Scholar]
- 22.Jing JP, Reed J, Huang J, Hu XH, Clarke V, Edington J, Housman D, Anantharaman TS, Huff EJ, Mishra B, Porter B, Shenker A, Wolfson E, Hiort C, Kantor R, Aston C, Schwartz DC. Proc Natl Acad Sci U S A. 1998;95:8046–8051. doi: 10.1073/pnas.95.14.8046. [DOI] [PMC free article] [PubMed] [Google Scholar]


