Abstract
Historically, annual rotavirus activity in the United States has started in the southwest in late fall and ended in the northeast 3 months later; this trend has diminished in recent years. Traveling waves of infection or local environmental drivers cannot account for these patterns. A transmission model calibrated against epidemiological data shows that spatiotemporal variation in birth rate can explain the timing of rotavirus epidemics. The recent large-scale introduction of rotavirus vaccination provides a natural experiment to further test the impact of susceptible recruitment on disease dynamics. The model predicts a pattern of reduced and lagged epidemics postvaccination, closely matching the observed dynamics. Armed with this validated model, we explore the relative importance of direct and indirect protection, a key issue in determining the worldwide benefits of vaccination.
The importance of rotavirus as a leading cause of severe diarrhea among children in both developed and developing countries has captured the attention of policy-makers and vaccine manufacturers in recent years. Rotavirus is ubiquitous in the population; individuals are infected multiple times during their life span, usually via fecal-oral transmission (1). In adults, infection is typically asymptomatic; however, for children who have not been previously exposed to the virus, infection can lead to severe diarrhea and vomiting and may require hospitalization or result in death. About 610,000 deaths per year worldwide can be attributed to rotavirus (2, 3). In the United States, it is estimated that rotavirus annually leads to ~60,000 hospitalizations and 30 to 40 deaths among children <5 years of age (4). Two live, attenuated oral vaccines have recently been licensed in North America and Europe and have been demonstrated in clinical trials to prevent 79 to 98% of episodes of severe rotavirus diarrhea in vaccinated infants (5–9). Such vaccines have the potential to prevent considerable numbers of rotavirus-related hospitalizations and deaths worldwide. Analyzing the impact of vaccination on the incidence of severe diarrhea, however, requires an understanding of the underlying dynamics of rotavirus infection.
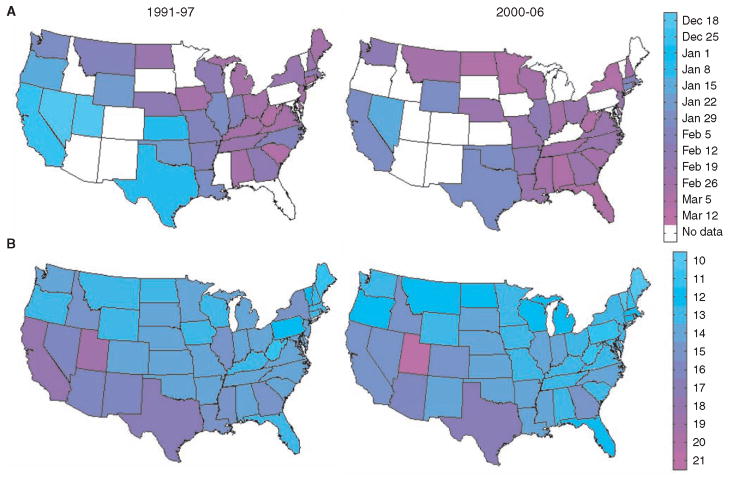
Analysis of rotavirus epidemiological data from the continental United States indicates that disease incidence is highly seasonal and spatially structured. Until the late 1990s, annual epidemics peaked in the southwest in December to January and appeared to spread northeast, where epidemics peaked in March to April (Fig. 1A) (10–12). In recent years, this spatiotemporal pattern has become less pronounced, primarily because epidemics have occurred later in southwestern states (Fig. 1A) (13). The spatiotemporal pattern exhibited by rotavirus differs from that of other acute seasonal infections in the United States, notably influenza, for which epidemics tend to begin in major population centers relatively synchronously and spread to less populous areas in correlation with work commutes (14). Such hierarchical patterns are consistent with “gravity models” (15), which assume local extinction followed by annual reinvasion from outside of the United States (16). By contrast, the available epidemiological and viral phylogenetic evidence for rotavirus suggests local persistence of infection during epidemic troughs in summer months (10, 17–19).
Fig. 1.
Spatiotemporal pattern of rotavirus epidemics and birth rates in the United States. (A) Map of mean week of rotavirus activity for the period from 1991–1997 and 2000–2006. Mean timing of annual rotavirus activity was calculated for states that reported rotavirus-positive specimens to the NREVSS for at least four of the six rotavirus seasons. (B) Average crude birth rates by state (live births per 1000 estimated population per year) for 1991–1997 and 2000–2006 according to National Vital Statistics Reports.
If rotavirus does persist locally, then geographic differences in the timing of rotavirus epidemics must be driven by local heterogeneities in demographic or environmental factors. Although climatic factors have traditionally been suspected to be the underlying cause of rotavirus seasonality and patterns of spread (20), the spatiotemporal signature of rotavirus in the United States is too complex to be explained by a single environmental gradient (13). We quantified the impact of several environmental factors on rotavirus epidemic patterns, including solar radiation, precipitation, vapor pressure, and temperature. Univariate and multivariate regression suggested that such factors could not explain the observed variability in timing of rotavirus epidemics either across states or over time (10).
Alternatively, birth rates are known to play an important role in epidemic dynamics and can affect both regional spatial and temporal patterns (21–23). Birth rates have traditionally been ~30% higher in the southwestern United States than in the northeast, but over the past decade rates have declined by 10 to 25%, particularly in California (Fig. 1B) (24, 25). We found that the state-to-state and year-to-year variation in birth rates was consistent with the observed variability in the timing of rotavirus epidemics in the United States; that is, earlier epidemics tended to occur in localities having higher birth rates in the year leading up to the rotavirus season (Pearson’s correlation coefficient r = −0.57, P < 0.001). Furthermore, regression analysis confirmed that birth rates were strongly associated with rotavirus epidemic timing, explaining 65 to 71% of the spatial variation across states and 61% of temporal trends (10) (table S1).
Model description
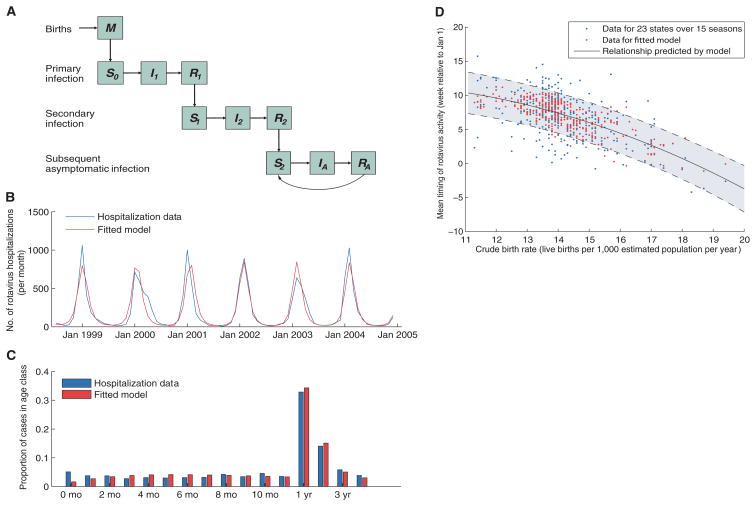
We developed an age- and state-stratified transmission model for rotavirus to test whether the spatiotemporal signature of epidemics could be generated by geographic variability in birth rate. The model allows for individuals to be infected multiple times over the course of their life; each infection is followed by a temporary period of complete immunity and confers an increased level of incomplete protection, both against infection and against severe diarrhea-given infection (Fig. 2A). This reflects the current understanding of rotavirus epidemiology and immunity (10).
Fig. 2.
Description of model and model fit. (A) Compartmental diagram illustrating the transmission model. See (10) for a more detailed description. (B and C) Fit of the model to age-specific hospitalization data from the California HCUP SID for (B) the number of hospitalizations per month in children 0 to 4 years of age and (C) the age distribution of hospitalized rotavirus cases (0 to 11 months and 1 to 4 years of age). (D) Timing of rotavirus epidemics based on laboratory-confirmed NREVSS data versus the state-specific crude birth rate in the preceding year. We calculated the mean timing of annual rotavirus activity for each of the 23 states and 15 rotavirus seasons (1991 to 2006) by weighting each calendar week by the proportion of rotavirus detections occurring that week. Observed data are plotted in blue, whereas the red dots represent predictions from the fitted model driven by birth rate. The relationship between the birth rate and timing of epidemics predicted by our model is given by the solid black line, whereas the shaded area between dashed lines represents the 95% confidence interval for the predicted relationship.
The model assumes seasonal variation in the instantaneous transmission rate: β(t) = β0{1 + acos[2π(t − ϕ)]}; here, β0 is the baseline transmission rate, a is the amplitude of seasonality, and ϕ is a seasonal offset parameter. We used data from the State Inpatient Databases (SID) of the U.S. Healthcare Cost and Utilization Project (HCUP) (26) for a subset of 16 states with monthly hospital discharge data from January 1993 to December 2004. We explored four possible assumptions for mixing between age groups and found that the best-fitting model included an age-related peak in the rate of transmission to children <3 years of age [based on Akaike information criterion, (10)].
The rate of hospitalizations for rotavirus predicted by the model was similar to the reported incidence (Fig. 2B), as was the age distribution of cases (<0.025 difference in the proportion of cases in any given 1-year age group) (Fig. 2C). When we incorporated information on the declining birth rate in California, the model predicted a seasonal peak of rotavirus activity gradually shifting from early January to February in this state (Fig. 2B). If we modeled a constant birth rate over this time period, the model was unable to capture the observed change in the timing of rotavirus epidemics and did not fit the data as well (10).
Effect of birth rate on epidemic timing across the United States
We then tested the birth rate effect for the entire country by using weekly data on the total number of rotavirus-positive specimens reported to the Centers of Disease Control and Prevention (CDC) through the National Respiratory and Enteric Virus Surveillance System (NREVSS). Laboratories throughout the United States voluntarily reported weekly information on rotavirus activity for the period from July (calendar week 27) 1991 to June (calendar week 26) 2006. We focused our analysis on the 23 states with at least 40 positive specimens reported each season over the study period.
The observed relationship between the timing of annual rotavirus activity (10) and mean birth rate was well captured by our fitted model (Fig. 2D). When the recruitment of susceptibles was high (around 20 live births per 1000 total population per year), epidemics tended to occur earlier (late November to early December), and when birth rate was low (around 12 per 1000), epidemics occurred on average 3 months later. A model with constant average birth rate in space and time failed to capture the spatiotemporal dynamics of the disease (10).
Impact of vaccination
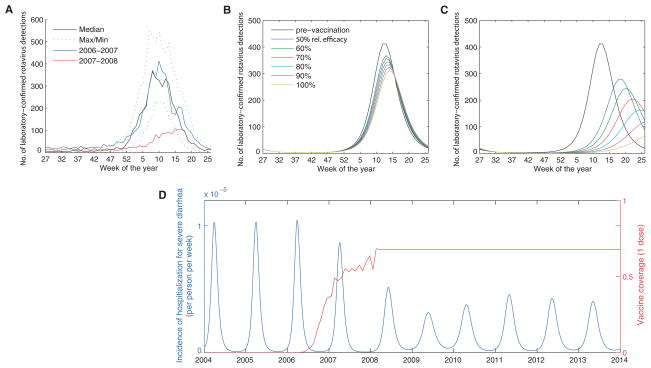
In February 2006, the RotaTeq vaccine (Merck) was introduced into the routine vaccination schedule for U.S. infants. Coverage with at least one dose of the vaccine by 3 months of age increased to about 60% by March 2008 (10). Data from NREVSS and the New Vaccine Surveillance Network (NVSN) indicate that the 2007–2008 rotavirus season was delayed by about 2 to 4 months and substantially diminished in size relative to epidemics in previous years (Fig. 3A) (27). Because vaccination effectively reduces the rate of recruitment of susceptible individuals, akin to a decline in birth rate, we can validate our model by comparing the predicted impact of vaccination to the observed dynamics.
Fig. 3.
Effect of vaccination on the size and timing of the epidemic in the first and second years following the introduction of the vaccine. (A) Weekly number of rotavirus-positive tests from participating NREVSS laboratories, 1991–2006, compared with 2007–2008, by week of year. (B and C) Weekly incidence of laboratory-confirmed rotavirus detections predicted by the model for an average prevaccination epidemic (black) and the epidemic in the (B) first year and (C) second year after the introduction of the vaccine, given one-dose vaccine coverage estimates and assuming 50 to 100% relative effectiveness. (D) Time series of model predictions for effect of vaccination (introduced in 2006) on the incidence of laboratory-confirmed rotavirus (blue), assuming vaccine coverage (red) remains at its current level (~68% with one dose, with 70% relative effectiveness).
We assumed that the vaccine conferred a protective effect similar to that of primary infection (average vaccine efficacy of 80.3% against severe diarrhea) (9). Although the vaccine does not completely protect against infection with rotavirus (vaccine efficacy of 36.5% against infection), it substantially decreases the probability of developing severe diarrhea (10). Weekly vaccine coverage levels were interpolated on the basis of monthly one-dose coverage estimates derived from health insurance claims data for children <3 months of age (10). We explored a variety of assumptions about the relative effectiveness of the one-dose coverage estimates compared with the proportion who receive the full three-dose protective effect conferred by the vaccine (10).
Our model predicted that the introduction of the RotaTeq vaccine in 2006 would lead to a small decrease in the incidence of severe diarrhea during the initial 2006–2007 season (Fig. 3B) and a larger decline and delay in the epidemic during 2007–2008 (Fig. 3C). These predicted dynamics captured the observed effects of vaccination (Fig. 3, A to C). If the relative effectiveness of the one-dose coverage estimates was assumed to be ~70%, as compared with the full three-dose vaccine schedule, then the model generated a good quantitative match with the observed impact of vaccination during 2007–2008 (Fig. 3, A to C). Model predictions suggest that the 2008–2009 season will be characterized by somewhat elevated rotavirus transmission during the summer and fall and a smaller epidemic peak occurring about 1 month later than in the prevaccination era. Thereafter, there will be a similar pattern of smaller yearly epidemics if vaccine coverage remains at its current level (~68% coverage with one dose) (Fig. 3D).
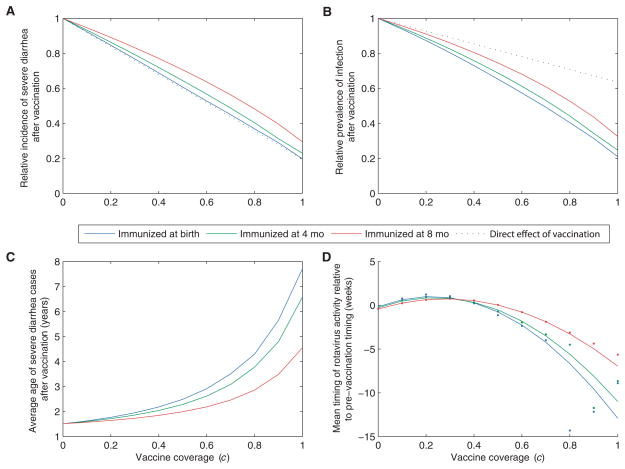
Lastly, we quantified the expected long-term impact of rotavirus vaccination at a variety of coverage levels. Vaccination is predicted to result in both decreased incidence of severe diarrhea and decreased prevalence of symptomatic and asymptomatic infections (Fig. 4). However, a single course of the vaccine will not eliminate the disease completely if the effect of vaccination is truly comparable to the protection provided by primary infection. This is unsurprising given that the duration of immunity against natural rotavirus infection is not lifelong (28). Our model also indicated that there is little or no indirect protection against severe diarrhea (Fig. 4A). As the age at immunization increases [i.e., if protection only occurs after two or three doses of the vaccine (10)], more individuals can be infected before being fully immunized, thereby reducing the benefit of vaccination. However, the decrease in clinical severity (and thereby the infectiousness) of subsequent infections in vaccinated individuals leads to some indirect protection against infection in general. Under all vaccination schemes, the reduction in the prevalence of infection is greater than that predicted by the direct effect of vaccination alone (Fig. 4B); for example, herd immunity provides an additional 15 to 25% reduction in infection prevalence at 70% vaccine coverage.
Fig. 4.
Population dynamic impact of vaccination. Vaccination was included in the model assuming coverage (c) between 0 and 100% and age at immunization of 0 (blue), 4 (green), or 8 (red) months of age (comparable to assuming acquisition of immunity after first, second, or last dose of the vaccine). Plots show the effect of vaccination predicted by the model 10 years after the vaccine is introduced on (A) the average incidence of severe diarrhea, (B) the prevalence of symptomatic and asymptomatic infection, (C) the average age of severe diarrhea cases, and (D) the timing of epidemics relative to the pre-vaccination timing. The dots represent the model-predicted timing, while the lines represent the fitted relationship for coverage = 0 to 70%. Note that epidemics occur biennially when vaccination coverage exceeds 70%. The dotted black lines in (A) and (B) represent the direct effect of vaccination assuming immunization at birth.
The average age of severe diarrhea cases is predicted to increase with higher vaccine coverage (Fig. 4C). The decrease in prevalence of infection in the population delays the time to primary (and secondary) infection such that the average age of severe diarrhea cases increases from 1.5 years old to 4.6 to 7.7 years old, depending on the age at immunization. This increase in the average age of first infection could lead to further decreases in the incidence of severe diarrhea (beyond those predicted by the model) if cases in older children tend to be less severe compared with those in infants (29).
As vaccine coverage level increases, the epidemic peaks occur later than prevaccination, but there tends to be less seasonal variation in the number of rotavirus cases; as a result, the mean timing of rotavirus activity may occur slightly earlier (Fig. 4D). This effect is similar to the birth rate dropping below currently observed levels. As vaccine coverage reaches about 70 to 80%, our model indicates that rotavirus activity follows a pattern of biennial epidemics (reflecting the nonlinear feedback of herd immunity). Still higher vaccine coverage levels can lead to potentially irregular dynamics (particularly if we consider stochastic variations) and a period of years in which there are very few cases of severe diarrhea.
Discussion
The analysis of spatiotemporal epidemic patterns has considerable power to help illuminate epidemic dynamics. Traveling waves of infection originating in large population centers have been noted and described for measles (21), rabies (30), dengue (31), and influenza (14). Unlike these pathogens, however, rotavirus infection appears to persist throughout the year even in relatively small populations, possibly through recurring infections in adults (10, 17, 18).
We propose that spatiotemporal variation in birth rate can lead to secular changes in the pattern of rotavirus epidemics. If individuals experiencing their first infection are the primary drivers of epidemics, then demographic changes will have a strong influence on epidemic dynamics. At current rates of susceptible recruitment, small (~5%) seasonal variation in transmissibility can lead to strongly seasonal outbreaks of rotavirus resulting from the annual depletion of infants susceptible to primary infection. The observed variation in birth rates over time and space dictates the relative timing of epidemics across the United States, as evidenced by a state-specific rotavirus transmission model calibrated against rich epidemiological data sets. Qualitatively similar relationships between rotavirus dynamics and the recruitment of susceptibles have been observed in other countries and time periods (10). By contrast, other nondemographic factors may explain why transmissibility tends to be slightly greater in the winter in the United States and elsewhere (10).
The large-scale introduction of pediatric rotavirus vaccination in the United States provides a natural experiment to validate our model, by reducing the recruitment rate of fully susceptible individuals. Incorporating this effect into the model predicts the changes in spatiotemporal dynamics of epidemics associated with early vaccination efforts, verifying our demographic hypothesis. Vaccination against rotavirus has reduced the incidence of severe diarrhea and could lead to changes in the average age of cases and the timing of epidemics. Furthermore, the vaccination program is predicted to decrease the overall prevalence of infection by a degree that is greater than that predicted by the direct effect of vaccination alone.
Although our model reproduced several features of the spatiotemporal dynamics of rotavirus in the United States, further refinement of the model may be necessary (10). We have only implicitly accounted for the interaction between different strains of rotavirus, for which there may be varying degrees of homotypic and heterotypic immunity (32). Secondary infections may occur only when individuals encounter a strain that substantially differs from the one causing primary infection. Furthermore, the true effect of vaccination may differ slightly from that suggested by our model. If vaccination conferred highly protective immunity comparable to that exhibited after two natural infections, our model suggests that the level of herd immunity generated by vaccination could lead to the elimination of the infection from the population at very high coverage levels (10). However, one cannot rule out the possible emergence of new rotavirus strains in response to vaccine pressure, and information on rotavirus genetic diversity will be crucial to understand the long-term effectiveness of any immunization program.
We can extend our U.S.-based analysis to the context of developing countries, where rotavirus remains a substantial cause of childhood morbidity and mortality and disease dynamics differ. The high birth rates typical of developing countries may help explain why rotavirus exhibits less seasonal variation in such settings (33), although climatic factors could also play a role. In addition, rotavirus vaccine efficacy remains somewhat unclear in developing country settings and could be lower than in the United States because of several factors that might interfere with vaccine performance (e.g., presence of maternal antibodies, high levels of coinfection with other enteropathogens, higher rates of malnutrition, and greater prevalence of uncommon rotavirus strains). Efficacy trials of rotavirus vaccines are ongoing in several countries of Asia and Africa, and results are expected in the next 6 to 12 months. Differences in population demographics, epidemiology of rotavirus disease, and, potentially, vaccine effectiveness, would need to be carefully considered when predicting the benefits of vaccination in developing countries, and the vaccine experience of industrialized nations may not directly translate to countries with high rotavirus mortality burden. Introducing vaccination would likely decrease the overall burden of disease but could have important dynamic consequences, which are key to explore in future research.
Supplementary Material
References and Notes
- 1.Kapikian AZ, Chanock RM. In: Fields Virology. Fields BN, et al., editors. Vol. 2. Lippincott-Raven; Philadelphia: 2001. pp. 1657–1708. [Google Scholar]
- 2.Parashar UD, Gibson CJ, Bresse JS, Glass RI. Emerg Infect Dis. 2006;12:304. doi: 10.3201/eid1202.050006. [DOI] [PMC free article] [PubMed] [Google Scholar]
- 3.Parashar UD, Hummelman EG, Bresee JS, Miller MA, Glass RI. Emerg Infect Dis. 2003;9:565. doi: 10.3201/eid0905.020562. [DOI] [PMC free article] [PubMed] [Google Scholar]
- 4.Fischer TK, et al. J Infect Dis. 2007;195:1117. doi: 10.1086/512863. [DOI] [PubMed] [Google Scholar]
- 5.Glass RI, Parashar UD. N Engl J Med. 2006;354:75. doi: 10.1056/NEJMe058285. [DOI] [PubMed] [Google Scholar]
- 6.Glass RI, et al. Lancet. 2006;368:323. doi: 10.1016/S0140-6736(06)68815-6. [DOI] [PubMed] [Google Scholar]
- 7.Ruiz-Palacios GM, et al. N Engl J Med. 2006;354:11. [Google Scholar]
- 8.Vesikari T, et al. N Engl J Med. 2006;354:23. [Google Scholar]
- 9.Linhares AC, et al. Lancet. 2008;371:1181. doi: 10.1016/S0140-6736(08)60524-3. [DOI] [PubMed] [Google Scholar]
- 10.Materials and methods are available as supporting material on Science Online.
- 11.LeBaron CW, Lew J, Glass RI, Weber JM, Ruiz-Palacios GM. JAMA. 1990;264:983. doi: 10.1001/jama.264.8.983. [DOI] [PubMed] [Google Scholar]
- 12.Torok TJ, et al. Pediatr Infect Dis J. 1997;16:941. doi: 10.1097/00006454-199710000-00007. [DOI] [PubMed] [Google Scholar]
- 13.Turcios RM, et al. Pediatr Infect Dis J. 2006;25:451. doi: 10.1097/01.inf.0000214987.67522.78. [DOI] [PubMed] [Google Scholar]
- 14.Viboud C, et al. Science. 2006;312:447. doi: 10.1126/science.1125237. published online 29 March 2006. [DOI] [PubMed] [Google Scholar]
- 15.Xia Y, Bjornstad ON, Grenfell BT. Am Nat. 2004;164:267. doi: 10.1086/422341. [DOI] [PubMed] [Google Scholar]
- 16.Nelson MI, Simonsen L, Viboud C, Miller MA, Holmes EC. PLoS Pathog. 2007;3:1220. doi: 10.1371/journal.ppat.0030131. [DOI] [PMC free article] [PubMed] [Google Scholar]
- 17.Cox MJ, Medley GF. Epidemiol Infect. 2003;131:719. doi: 10.1017/s0950268803008720. [DOI] [PMC free article] [PubMed] [Google Scholar]
- 18.Nakajima H, et al. Lancet. 2001;357:1950. doi: 10.1016/S0140-6736(00)05086-8. [DOI] [PubMed] [Google Scholar]
- 19.Arista S, et al. J Virol. 2006;80:10724. doi: 10.1128/JVI.00340-06. [DOI] [PMC free article] [PubMed] [Google Scholar]
- 20.Purohit SG, Kelkar SD, Simha V. J Diarrhoeal Dis Res. 1998;16:74. [PubMed] [Google Scholar]
- 21.Grenfell BT, Bjornstad ON, Kappey J. Nature. 2001;414:716. doi: 10.1038/414716a. [DOI] [PubMed] [Google Scholar]
- 22.Conlan AJ, Grenfell BT. Proc R Soc London Ser B. 2007;274:1133. doi: 10.1098/rspb.2006.0030. [DOI] [PMC free article] [PubMed] [Google Scholar]
- 23.Cilla G, Perez-Trallero E, Lopez-Lopategui MC, Gilsetas A, Gomariz M. Epidemiol Infect. 2000;125:677. doi: 10.1017/s0950268800004842. [DOI] [PMC free article] [PubMed] [Google Scholar]
- 24.Hamilton BE, Sutton PD, Ventura SJ. Revised birth and fertility rates for the 1990s and new rates for Hispanic populations, 2000 and 2001: United States. National Center for Health Statistics; 2003. [PubMed] [Google Scholar]
- 25.Centers for Disease Control and Prevention National Center for Health Statistics. [accessed 22 April 2008];VitalStats. www.cdc.gov/nchs/vitalstats/VitalStatsbirths.htm.
- 26.Agency for Healthcare Quality and Research (AHRQ) www.hcupus.ahrq.gov/databases.jsp.
- 27.Staat MA, et al. MMWR Morb Mortal Wkly Rep. 2008;57:697. [PubMed] [Google Scholar]
- 28.Anderson RM, May RM. Infectious Diseases of Humans: Dynamics and Control. Oxford Univ. Press; Oxford: 1991. [Google Scholar]
- 29.Bernstein DI, Sander DS, Smith VE, Schiff GM, Ward RL. J Infect Dis. 1991;164:277. doi: 10.1093/infdis/164.2.277. [DOI] [PubMed] [Google Scholar]
- 30.Smith DL, Lucey B, Waller LA, Childs JE, Real LA. Proc Natl Acad Sci USA. 2002;99:3668. doi: 10.1073/pnas.042400799. [DOI] [PMC free article] [PubMed] [Google Scholar]
- 31.Cummings DA, et al. Nature. 2004;427:344. doi: 10.1038/nature02225. [DOI] [PubMed] [Google Scholar]
- 32.Jiang B, Gentsch JR, Glass RI. Clin Infect Dis. 2002;34:1351. doi: 10.1086/340103. [DOI] [PubMed] [Google Scholar]
- 33.Cook SM, Glass RI, LeBaron CW, Ho MS. Bull World Health Organ. 1990;68:171. [PMC free article] [PubMed] [Google Scholar]
- 34.V.E.P and B.G. were supported by NIH (grant R01 GM083983-01) and the Bill and Melinda Gates Foundation. V.E.P, B.G., and L.S. were also supported by the RAPIDD program of the Science and Technology Directorate, U.S. Department of Homeland Security, and the Fogarty International Center, NIH. The findings and conclusions in this report are those of the authors and do not necessarily represent the views of the Centers for Disease Control and Prevention (CDC).
Associated Data
This section collects any data citations, data availability statements, or supplementary materials included in this article.


