

Abstract
BACKGROUND AND PURPOSE
Inosine monophosphate dehydrogenases, encoded by IMPDH1 and IMPDH2, are targets for the important immunosuppressive drug, mycophenolic acid (MPA). Variation in MPA response may result, in part, from genetic variation in IMPDH1 and IMPDH2.
EXPERIMENTAL APPROACH
We resequenced IMPDH1 and IMPDH2 using DNA from 288 individuals from three ethnic groups and performed functional genomic studies of the sequence variants observed.
KEY RESULTS
We identified 73 single nucleotide polymorphisms (SNPs) in IMPDH1, 59 novel, and 25 SNPs, 24 novel, in IMPDH2. One novel IMPDH1 allozyme (Leu275) had 10.2% of the wild-type activity as a result of accelerated protein degradation. Decreased activity of the previously reported IMPDH2 Phe263 allozyme was primarily due to decreased protein quantity, also with accelerated degradation. These observations with regard to the functional implications of variant allozymes were supported by the IMPDH1 and IMPDH2 X-ray crystal structures. A novel IMPDH2 intron 1 SNP, G > C IVS1(93), was associated with decreased mRNA quantity, possibly because of altered transcription.
CONCLUSIONS AND IMPLICATIONS
These results provide insight into the nature and extent of sequence variation in the IMPDH1 and IMPDH2 genes. They also describe the influence of gene sequence variation that alters the encoded amino acids on IMPDH function and provide a foundation for future translational studies designed to correlate sequence variation in these genes with outcomes in patients treated with MPA.
Keywords: mycophenolic acid, mycophenolate mofetil, mycophenolate sodium, inosine monophosphate dehydrogenase, IMPDH1, IMPDH2, pharmacogenetics, functional genomics, transplantation
Introduction
The immunosuppressant drug mycophenolic acid (MPA) inhibits inosine monophosphate dehydrogenase (IMPDH) and is used to prevent rejection in solid organ transplantation patients (Allison and Eugui, 2000). MPA is also used to treat autoimmune diseases (Mak et al., 2009) and multiple myeloma (Takebe et al., 2004). IMPDH catalyses the rate-limiting step in de novo guanosine monophosphate synthesis. Because lymphocytes rely on de novo synthesis to provide guanine nucleotides while most other cells use the salvage pathway, inhibition of IMPDH results in immunosuppression (Allison and Eugui, 2000). However, in addition to having a narrow therapeutic index, clinical response to MPA is quite variable, and is complicated by large individual variation in both MPA plasma concentrations (Pisupati et al., 2005; Fernandez et al., 2007) and levels of IMPDH activity (Glander et al., 2001; 2004;).
Two different IMPDH isoforms are encoded by IMPDH1 and IMPDH2 (Gu et al., 1997; Zimmermann et al., 1997). Both isoforms are cytosolic, but they are known to be able to aggregate (Ji et al., 2006). IMPDH1 spans 18 kb on chromosome 7q31.3, encoding seven splice variants as a result of differential splicing (Gu et al., 1997; Spellicy et al., 2007). We focused our studies on the canonical 514 amino acid IMPDH1 isoform. IMPDH2 is 5 kb in length and maps to chromosome 3p21.2 (Zimmermann et al., 1995). Although the two isoforms have similar substrate kinetics (Carr et al., 1993), the two gene products are not redundant. IMPDH2 expression is inducible and, thus, it is more highly expressed in many tissues than the constitutively expressed IMPDH1 (Senda and Natsumeda, 1994). Knockout of IMPDH2 is embryonic lethal in mice (Gu et al., 2000), but IMPDH1 knockout mice are phenotypically normal (Gu et al., 2003). Despite their differences, inhibition of both IMPDH1 and IMPDH2 is important for the antiproliferative effects of MPA (Wu, 1994; Allison and Eugui, 2000).
Genetic polymorphisms in both IMPDH1 and IMPDH2 have been shown to influence outcome in transplantation patients treated with MPA, suggesting that response to MPA might be influenced, in part, by inheritance. Examples include a nonsynonymous single nucleotide polymorphism (SNP) in IMPDH2 that was shown to reduce IMPDH activity (Wang et al., 2007), an IMPDH2 intron SNP that increased IMPDH activity in MPA-treated transplantation patients (Sombogaard et al., 2009), an IMPDH2 intron SNP that reduced the antiproliferative effects of MPA on lymphocytes (Winnicki et al., 2010), and two IMPDH1 intron SNPs associated with biopsy-proven acute transplant rejection (Wang et al., 2008). Therefore, we performed a comprehensive study of sequence variation in IMPDH1 and IMPDH2 by resequencing DNA from 288 unrelated individuals in three ethnic groups, followed by functional studies of the variants observed. These results shed light on possible mechanisms by which IMPDH activity might be altered by gene sequence variation and they provide a foundation for future pharmacogenetic studies of variation in MPA response in transplant patients.
Methods
DNA samples
Anonymized DNA samples from 96 African-American (AA), 96 Caucasian-American (CA) and 96 Han Chinese-American (HCA) healthy subjects (sample sets HD100AA, HD100CAU and HD100CHI) were obtained from the Coriell Institute (Camden, NJ). All subjects had provided written consent for the use of their DNA for research purposes. These studies were reviewed and approved by the Mayo Clinic Institutional Review Board.
Gene resequencing
All IMPDH1 and IMPDH2 exons, intron–exon splice junctions and portions of their 5′-flanking regions (FRs) were amplified using the PCR, as described previously (Moyer et al., 2008). Amplification primer sequences are listed in Table S1. Amplicons were sequenced on both strands in the Mayo Molecular Biology Core Facility using dye terminator sequencing chemistry. Polymorphisms observed only once, as well as any with ambiguous chromatograms, were subjected to a second, independent round of amplification – followed by DNA sequencing.
Expression constructs
The open reading frames for IMPDH2 and the 514 amino acid IMPDH1 isoform were amplified from clones MGC-9332 and MGC-40351 (ATCC, Manassas, VA), respectively, and each amplicon was subcloned into pcDNA™3.1D/V5-His-TOPO (Invitrogen, Carlsbad, CA) in frame with the V5-His tag. Site-directed mutagenesis of variant allozyme constructs, transient expression and the preparation of recombinant IMPDH allozymes expressed in COS-1 cells were performed as described previously (Moyer et al., 2008).
Activity assay
IMPDH activity was determined in COS-1 cell lysates using a high performance liquid chromatography assay described previously (Glander et al., 2009) with IMP and NAD+ concentrations of 1200 and 333 µM respectively. Variant allozyme activities are reported as percentages of the wild-type (WT). Co-transfection of pSV-β-galactosidase DNA made it possible to correct for variation in transfection efficiency (Moyer et al., 2008). Substrate kinetic studies were performed with [IMP] ranging from 20 to 1500 µM, with [NAD+] fixed at 333 µM and with [NAD+] ranging from 10 to 500 µM, with [IMP] fixed at 1200 µM, using enzyme translated in vitro using the Tn T® coupled rabbit reticulocyte lysate (RRL) system (Promega, Madison, WI).
Western blots
Levels of immunoreactive protein were determined for each allozyme by quantitative Western blot analysis performed with a rabbit polyclonal V5-tag antibody (Abcam, Cambridge, MA), as described previously (Moyer et al., 2008). These results were quantified using ImageJ software (http://rsbweb.nih.gov/ij/).
RRL degradation
The RRL system was used to transcribe and translate each allozyme in the presence of [35S]-methionine (PerkinElmer, Boston, MA), and the rate of protein degradation was determined as described previously (Wang et al., 2003). Briefly, in vitro translated protein was placed in untreated RRL together with a creatine phosphate-based ATP regeneration system. This mixture was incubated at 37°C and sampled at various time points. The samples were subjected to sodium dodecyl sulphate polyacrylamide gel electrophoresis (SDS-PAGE), and the amount of allozyme protein at each time point was determined by autoradiography.
Pulse-chase assays
COS-1 cells were transiently transfected with WT or Phe263 IMPDH2. After 48 h, the transfected cells were grown in methionine-free media for 30 min, ‘pulsed’ with media containing 0.1 mCi·mL−1[35S]-methionine (PerkinElmer) for 20 min, and were then ‘chased’ with media containing non-radioactive methionine. Samples of the cells were taken at various time points and were processed with the Classic IP Kit (Pierce Protein Research Products, Rockford, IL) with a monoclonal mouse anti-V5 antibody (Abcam). The eluate samples from the immunoprecipitation reactions were subjected to SDS-PAGE. The resulting gels were dried, and levels of radioactively labelled protein were determined by autoradiography.
mRNA expression
Lymphoblastoid cell lines from which the 288 DNA samples used for gene resequencing had been obtained were purchased from the Coriell Institute. Total RNA was extracted, and mRNA expression analysis was performed using the Affymetrix Human Genome U133 Plus 2.0 Array as described previously (Moyer et al., 2008). Data from IMPDH2 probe set 201892_s_at were used to perform association analyses. IMPDH2 mRNA expression levels for 30 randomly selected samples were also determined using SYBR® Green-based quantitative reverse transcription polymerase chain reaction (qRT-PCR).
Electrophoretic mobility shift assays
Electrophoretic mobility shift (EMS) assays were performed as described previously (Moyer et al., 2008). Sp1 antibody (Santa Cruz Biotechnology, Santa Cruz, CA), 400 µg·mL−1, was used to perform supershift assays.
Structural analysis
The human IMPDH1 and IMPDH2 crystal structures were used to perform computational modelling of variant allozymes. For IMPDH1, a 2.5 Å resolution crystal structure bound to the substrate analogue 6-chloropurine riboside 5′-monophosphate (6-Cl-IMP) was used as a starting template (PDB ID: 1JCN; Risal et al., unpublished). A 2.65 Å resolution structure of IMPDH2 bound to two inhibitors, C2-mycophenolic adenine dinucleotide and ribavirin monophosphate, was used for that enzyme (PDB ID: 1NF7; Risal et al., unpublished). Molecular visualization and computational modelling of the variants was performed using Coot (Emsley and Cowtan, 2004). To computationally probe possible structural consequences in more detail, molecular dynamics simulations of both WT and variant allozymes were attempted using the GROMACS3.3.3 software package (Van Der Spoel et al., 2005). Unfortunately, those simulations were unstable, presumably due to the incomplete nature of the starting crystal structures (95 missing residues in five gaps for IMPDH1 and 71 residues in four gaps for IMPDH2). Structural figures were prepared with Molscript and Raster3D (Kraulis, 1991; Merritt and Bacon, 1997).
Data analysis
Gene sequencing chromatograms were analysed with Mutation Surveyor (SoftGenetics, State College, PA). Linkage disequilibrium was determined by calculating r2 and D′ values (Hedrick, 2000; Hartl and Clark, 2007), and intragene haplotypes were inferred as described by Tajima (Schaid et al., 2002). Values for π, θ and Tajima's D were calculated as described previously (Tajima, 1989a,b;). Genotype–phenotype correlations for IMPDH2 SNPs with log2-transformed IMPDH2 mRNA expression levels were calculated separately for each ethnic group using PLINK (Purcell et al., 2007). Transcription factor binding sites were predicted using TFSEARCH v.1.3 (Heinemeyer et al., 1998). Apparent KM values were calculated using Prism 4 (GraphPad Software, La Jolla, CA). Average levels of allozyme activity and protein were compared using the two-sample t-test assuming unequal variance (Microsoft Excel, Redmond, WA).
Results
Gene sequencing
We resequenced IMPDH1 and IMPDH2 using DNA from 288 healthy individuals divided equally among three ethnic groups. The cell lines used to isolate this DNA were deposited by the National Institute of General Medical Sciences, in part, to help create a resource for defining common genetic variation across ethnic groups for use in pharmacogenetic studies. Healthy subjects were used to avoid ‘enrichment’ for any particular disease. We observed 73 SNPs – 59 novel (previously unavailable in public databases) – for IMPDH1, including four nonsynonymous SNPs. For IMPDH2, 25 SNPs – 24 novel – were observed, including one nonsynonymous SNP (Figure 1 and Table 1). We have used the nomenclature of Gu et al. (1997) for IMPDH1 and will refer to the differentially expressed 5′-exons as ‘A’, ‘B’ and ‘C’. The exon A (115) SNP (Arg39X) results in a truncating mutation in longer IMPDH1 isoforms. Our gene resequencing data were deposited in the National Institutes of Health-supported pharmacogenetics database PharmGKB (Submission IDs: PS208272 for IMPDH1, and PS208273 for IMPDH2) and in dbSNP. All SNPs were in Hardy–Weinberg equilibrium (P > 0.001). Polymorphism locations and frequencies varied widely among the three ethnic groups. IMPDH1 had 49, 26 and 39 SNPs in the AA, CA and HCA populations, respectively, but only 20 were found in more than one population. For IMPDH2, there were 11, 8 and 3 SNPs in the AA, CA and HCA populations, respectively, but only one of these SNPs was observed in all three populations.
Figure 1.
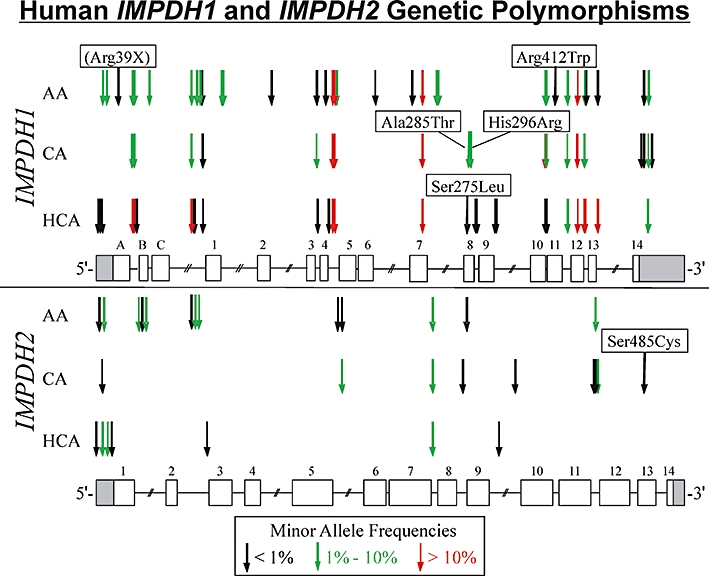
Human IMPDH1 and IMPDH2 genetic polymorphisms. Open rectangles denote coding exons, and shaded rectangles are untranslated regions. The exons for IMPDH1 are numbered according to Gu et al. (1997), so that translation initiation for the canonical 514 amino acid IMPDH1 isoform begins in exon 1. Exons A, B and C encode N-terminal extensions that are part of longer IMPDH1 isoforms that are translated from an ATG translation initiation codon located in exon A. Arrows indicate the locations of polymorphisms, with frequencies indicated by colours. Nonsynonymous SNPs are indicated, with the appropriate amino acid change. AA, African-American; CA, Caucasian-American; HCA, Han Chinese-American.
Table 1.
Human IMPDH1 and IMPDH2 genetic polymorphisms
| IMPDH isoform | Polymorphism location | HGVS nomenclaturea | Nucleotide sequence change | Amino acid sequence change | Minor allele frequency | Previously reported | rs Number | ||
|---|---|---|---|---|---|---|---|---|---|
| AA | CA | HCA | |||||||
| 1 | 5′-FR (−1262) | −1262 | T > C | 0.010 | 0.000 | 0.000 | rs72624920 | ||
| 1 | 5′-FR (−1195) | −1195 | C > A | 0.000 | 0.000 | 0.005 | rs72624921 | ||
| 1 | 5′-FR (−1061) | −1061 | C > G | 0.010 | 0.000 | 0.000 | rs72624922 | ||
| 1 | 5′-FR (−1000) | −1000 | del TAACA | 0.010 | 0.000 | 0.031 | rs72624923 | ||
| 1 | 5′-FR (−992) | −992 | C > A | 0.063 | 0.073 | 0.198 | rs72624924 | ||
| 1 | 5′-FR (−980) | −980 | ins TAAAA | 0.010 | 0.000 | 0.031 | rs72624925 | ||
| 1 | 5′-FR (−969) | −969 | ins AAAAT | 0.000 | 0.000 | 0.005 | rs72624926 | ||
| 1 | 5′-FR (−791) | −791 | C > G | 0.000 | 0.000 | 0.026 | rs72624927 | ||
| 1 | 5′-FR (−751) | −751 | G > T | 0.083 | 0.167 | 0.000 | rs72624928 | ||
| 1 | 5′-FR (−743) | −743 | T > C | 0.063 | 0.026 | 0.182 | rs72624929 | ||
| 1 | 5′-FR (−572) | −572 | G > A | 0.036 | 0.000 | 0.000 | rs72624930 | ||
| 1 | 5′-FR (−493) | −493 | C > T | 0.005 | 0.021 | 0.000 | rs72624931 | ||
| 1 | 5′-FR (−467) | −467 | G > A | 0.010 | 0.000 | 0.000 | rs72624932 | ||
| 1 | 5′-FR (−462) | −462 | T > C | 0.016 | 0.130 | 0.026 | Yes | rs11761662 | |
| 1 | 5′-FR (−434) | −434 | C > T | 0.000 | 0.000 | 0.010 | rs72624933 | ||
| 1 | 5′-UTR (−301) | −301 | G > A | 0.000 | 0.000 | 0.005 | rs66539932 | ||
| 1 | 5′-UTR (−184) | −184 | C > T | 0.000 | 0.000 | 0.005 | rs72624934 | ||
| 1 | 5′-UTR (−181) | −181 | G > C | 0.000 | 0.000 | 0.005 | rs72624935 | ||
| 1 | 5′-UTR (−69) | −69 | T > G | 0.016 | 0.000 | 0.000 | rs72624936 | ||
| 1 | 5′-UTR (−36) | −36 | T > C | 0.005 | 0.000 | 0.000 | rs72624937 | ||
| 1 | Exon A (115) | 115 | C > T | (Arg39X)b | 0.005 | 0.000 | 0.000 | rs72624938 | |
| 1 | IVS A (−52) | 147−52 | G > T | 0.063 | 0.026 | 0.182 | Yes | rs2288552 | |
| 1 | IVS A (−35) | 147−35 | G > A | 0.063 | 0.026 | 0.182 | Yes | rs2288551 | |
| 1 | IVS A (−26) | 147−26 | C > A | 0.000 | 0.000 | 0.005 | rs72624939 | ||
| 1 | IVS B (49) | 190+49 | G > A | 0.047 | 0.000 | 0.000 | rs72624940 | ||
| 1 | IVS C (−850) | 255−850 | A > C | 0.011 | 0.052 | 0.297 | Yes | rs28364722 | |
| 1 | IVS C (−823) | 255−823 | G > A | 0.000 | 0.000 | 0.005 | rs72624941 | ||
| 1 | IVS C (−713) | 255−713 | G > A | 0.000 | 0.000 | 0.005 | rs72624942 | ||
| 1 | IVS C (−531) | 255−531 | G > A | 0.042 | 0.000 | 0.000 | rs72624943 | ||
| 1 | IVS C (−530) | 255−530 | A > C | 0.021 | 0.000 | 0.000 | rs72624944 | ||
| 1 | IVS C (−94) | 255−94 | C > T | 0.000 | 0.005 | 0.000 | rs72624945 | ||
| 1 | IVS C (−58) | 255−58 | G > C | 0.005 | 0.000 | 0.000 | rs72624946 | ||
| 1 | IVS C (−36) | 255−36 | C > A | 0.000 | 0.000 | 0.005 | rs72624947 | ||
| 1 | IVS 1 (7) | 353+7 | G > C | 0.021 | 0.000 | 0.000 | rs72624948 | ||
| 1 | IVS 1 (46) | 353+46 | G > A | 0.005 | 0.000 | 0.000 | rs72624949 | ||
| 1 | IVS 1 (120) | 353+120 | C > A | 0.058 | 0.000 | 0.000 | rs72624950 | ||
| 1 | IVS 2 (57) | 402+57 | G > A | 0.005 | 0.000 | 0.000 | rs72624951 | ||
| 1 | IVS 3 (−34) | 505−34 | C > A | 0.005 | 0.021 | 0.000 | rs72624952 | ||
| 1 | IVS 3 (−10) | 505−10 | T > C | 0.000 | 0.000 | 0.005 | rs72624953 | ||
| 1 | Exon 4 (306) | 306 | C > T | 0.005 | 0.000 | 0.000 | Yes | rs34724843 | |
| 1 | IVS 4 (16) | 579+16 | G > T | 0.000 | 0.000 | 0.005 | rs72624954 | ||
| 1 | IVS 4 (119) | 579+119 | G > A | 0.458 | 0.510 | 0.385 | Yes | rs2278293 | |
| 1 | IVS 4 (−106) | 580−106 | G > A | 0.427 | 0.370 | 0.521 | Yes | rs2278294 | |
| 1 | IVS 4 (−69) | 580−69 | C > T | 0.010 | 0.000 | 0.000 | rs72624955 | ||
| 1 | IVS 6 (58) | 874+58 | G > A | 0.005 | 0.000 | 0.000 | rs72624956 | ||
| 1 | Exon 7 (633) | 633 | C > T | 0.005 | 0.000 | 0.000 | rs72624957 | ||
| 1 | Exon 7 (732) | 732 | G > C | 0.104 | 0.151 | 0.151 | Yes | rs2288550 | |
| 1 | IVS 7 (6) | 1074+6 | G > T | 0.010 | 0.000 | 0.000 | Yes | rs61751224 | |
| 1 | IVS 7 (7) | 1074+7 | C > T | 0.010 | 0.000 | 0.000 | rs72624958 | ||
| 1 | IVS 7 (102) | 1074+102 | C > T | 0.010 | 0.000 | 0.000 | rs72624959 | ||
| 1 | Exon 8 (824) | 824 | C > T | Ser275Leu | 0.000 | 0.000 | 0.005 | rs72624960 | |
| 1 | Exon 8 (853) | 853 | G > A | Ala285Thr | 0.000 | 0.010 | 0.000 | rs72624961 | |
| 1 | Exon 8 (887) | 887 | A > G | His296Arg | 0.000 | 0.010 | 0.000 | Yes | rs61751223 |
| 1 | IVS 8 (14) | 1165+14 | C > T | 0.000 | 0.000 | 0.005 | rs72624962 | ||
| 1 | IVS 8 (−45) | 1166−45 | G > A | 0.000 | 0.000 | 0.005 | rs72624963 | ||
| 1 | IVS 9 (12) | 1261+12 | G > A | 0.000 | 0.000 | 0.005 | rs72624964 | ||
| 1 | IVS 9 (29) | 1261+29 | G > A | 0.000 | 0.000 | 0.005 | rs72624965 | ||
| 1 | IVS 10 (9) | 1405+9 | A > G | 0.000 | 0.000 | 0.011 | Yes | rs11562030 | |
| 1 | IVS 10 (33) | 1405+33 | C > T | 0.083 | 0.167 | 0.000 | Yes | rs28580600 | |
| 1 | IVS 10 (53) | 1405+53 | del G | 0.021 | 0.026 | 0.182 | rs72624966 | ||
| 1 | Exon 11 (1234) | 1234 | C > T | Arg412Trp | 0.005 | 0.000 | 0.000 | rs72624967 | |
| 1 | IVS 11 (176) | 1550+176 | T > G | 0.010 | 0.052 | 0.260 | Yes | rs4731447 | |
| 1 | Exon 12 (1320) | 1320 | G > A | 0.266 | 0.255 | 0.349 | Yes | rs2228075 | |
| 1 | IVS 12 (33) | 1694+33 | C > T | 0.000 | 0.016 | 0.000 | rs72624968 | ||
| 1 | IVS 12 (43) | 1694+43 | G > A | 0.010 | 0.052 | 0.260 | rs72624969 | ||
| 1 | IVS 12 (59) | 1694+59 | G > T | 0.005 | 0.000 | 0.000 | rs72624970 | ||
| 1 | IVS 12 (−24) | 1695−24 | C > T | 0.005 | 0.000 | 0.000 | rs72624971 | ||
| 1 | IVS 13 (27) | 1778+27 | A > C | 0.005 | 0.000 | 0.000 | rs72624972 | ||
| 1 | 3′-UTR (1682) | *1682 | G > C | 0.000 | 0.005 | 0.000 | rs72624973 | ||
| 1 | 3′-UTR (1741) | *1741 | C > T | 0.005 | 0.005 | 0.000 | rs72624974 | ||
| 1 | 3′-UTR (1772) | *1772 | C > T | 0.000 | 0.000 | 0.010 | rs72624975 | ||
| 1 | 3′-UTR (1773) | *1773 | G > A | 0.010 | 0.042 | 0.000 | rs72624976 | ||
| 1 | 3′-UTR (1821) | *1821 | C > T | 0.000 | 0.005 | 0.000 | rs72624977 | ||
| 2 | 5′-FR (−619) | −619 | G > T | 0.000 | 0.000 | 0.005 | rs72639215 | ||
| 2 | 5′-FR (−398) | −398 | C > A | 0.005 | 0.000 | 0.000 | rs72639216 | ||
| 2 | 5′-FR (−274) | −274 | C > T | 0.000 | 0.005 | 0.000 | rs72639217 | ||
| 2 | 5′-FR (−207) | −207 | del TGG | 0.000 | 0.000 | 0.016 | rs72639218 | ||
| 2 | 5′-FR (−162) | −162 | C > T | 0.042 | 0.000 | 0.000 | rs72639219 | ||
| 2 | 5′-FR (−118) | −118 | C > T | 0.000 | 0.000 | 0.016 | rs72624903 | ||
| 2 | 5′-UTR (−69) | −69 | C > T | 0.000 | 0.000 | 0.005 | rs72624904 | ||
| 2 | IVS 1 (91) | 98+91 | T > G | 0.010 | 0.000 | 0.000 | rs72639213 | ||
| 2 | IVS 1 (93) | 98+93 | G > C | 0.005 | 0.000 | 0.000 | rs72639214 | ||
| 2 | IVS 1 (−4) | 99−4 | G > A | 0.016 | 0.000 | 0.000 | rs72624905 | ||
| 2 | IVS 2 (21) | 147+21 | G > T | 0.005 | 0.000 | 0.000 | rs72624906 | ||
| 2 | IVS 2 (65) | 147+65 | C > G | 0.016 | 0.000 | 0.000 | rs72624907 | ||
| 2 | IVS 2 (−77) | 148−77 | C > T | 0.016 | 0.000 | 0.000 | rs72624908 | ||
| 2 | IVS 2 (−64) | 148−64 | G > C | 0.000 | 0.000 | 0.005 | rs72624909 | ||
| 2 | IVS 5 (−112) | 532−112 | A > G | 0.005 | 0.000 | 0.000 | rs72624910 | ||
| 2 | IVS 5 (−96) | 532−96 | G > A | 0.005 | 0.031 | 0.000 | rs72624911 | ||
| 2 | IVS 7 (10) | 819+10 | T > C | 0.031 | 0.083 | 0.031 | Yes | rs11706052 | |
| 2 | IVS 8 (26) | 910+26 | A > G | 0.000 | 0.005 | 0.000 | rs72624912 | ||
| 2 | Exon 9 (999) | 999 | G > A | 0.005 | 0.000 | 0.000 | rs72624913 | ||
| 2 | IVS 9 (108) | 1006+108 | C > G | 0.000 | 0.000 | 0.005 | rs72624914 | ||
| 2 | IVS 9 (202) | 1006+202 | C > T | 0.000 | 0.005 | 0.000 | rs72624915 | ||
| 2 | IVS 11 (25) | 1295+25 | C > T | 0.000 | 0.005 | 0.000 | rs72624916 | ||
| 2 | IVS 11 (44) | 1295+44 | C > T | 0.010 | 0.005 | 0.000 | rs72624917 | ||
| 2 | IVS 11 (71) | 1295+71 | C > T | 0.000 | 0.031 | 0.000 | rs72624918 | ||
| 2 | Exon 13 (1454) | 1454 | C > G | Ser485Cys | 0.000 | 0.005 | 0.000 | rs72624919 | |
Polymorphisms in IMPDH1 exons and untranslated regions (UTRs) are numbered relative to the A (nucleotide 1) in the ATG translation initiation codon located in exon 1 of the canonical 514 amino acid isoform. Negative numbers are assigned to positions 5′ to that location, and positive numbers for positions 3′ to the A in that ATG. Nucleotides located within introns (IVSs) are numbered based on their distance from the nearest splice junction, with distances from 3′-splice junctions assigned positive numbers, and distances from 5′ splice junctions assigned negative numbers. Exons A, B and C encode N-terminal extensions that are part of longer isoforms of IMPDH1, which are translated from an upstream ATG translation initiation codon located in exon A (see Figure 1). Amino acid changes due to nonsynonymous SNPs are numbered for the canonical 514 amino acid isoform of IMPDH1. Polymorphisms in IMPDH2 are numbered in the same fashion relative to the A (nucleotide 1) in the ATG translation initiation codon. Polymorphisms identified previously are noted. Most of the rs numbers were assigned based on data from the present resequencing studies.
The HGVS column reflects the Human Genome Variation Society nomenclature system described by Ogino et al. (2007).
This SNP results in a truncating mutation for the longest, 599 amino acid isoform, of IMPDH1 at Arg39 (numbered from the upstream translation initiation codon).
SNP, single nucleotide polymorphism.
The extent of genetic variation within resequenced areas was estimated by calculating π, an estimate of average heterozygosity per site, and θ, a population mutation estimate of the neutral mutation variable. Tajima's D, a measure of the neutral mutation hypothesis that equals 0 under conditions of neutrality, was also calculated (Table 2) (Tajima, 1989a,b;). IMPDH2 values for π and θ were lower than those for IMPDH1. Tajima's D differed significantly from 0 only for IMPDH2 in the AA population (Table 2). These results may be relevant to human evolution, but would not be expected to be directly related to drug response phenotypes.
Table 2.
π, θ and Tajima's D values for IMPDH1 and IMPDH2 in three ethnic groups
| Population | π (×104) | θ (×104) | Tajima's D | P-value | |
|---|---|---|---|---|---|
| IMPDH1 | AA | 4.64 ± 2.66 | 11.1 ± 2.89 | −1.72 | 0.081 |
| CA | 4.75 ± 2.71 | 6.15 ± 1.78 | −0.632 | 0.542 | |
| HCA | 6.78 ± 3.69 | 8.13 ± 2.23 | −0.479 | 0.645 | |
| IMPDH2 | AA | 0.485 ± 0.54 | 3.20 ± 1.10 | −2.11 | 0.030 |
| CA | 0.485 ± 0.54 | 2.21 ± 0.86 | −1.78 | 0.070 | |
| HCA | 0.236 ± 0.36 | 1.72 ± 0.74 | −1.84 | 0.060 |
Values are normalized parameter estimates ± SE. The P-values listed refer to Tajima's D.
AA, African-American; CA, Caucasian-American; HCA, Han Chinese-American.
IMPDH1 and IMPDH2 haplotypes were inferred as described previously (Schaid et al., 2002), and haplotypes with a frequency of ≥1% in any population, as well as those containing nonsynonymous SNPs, are listed in Tables S2 and S3 respectively. The haplotype nomenclature used in those tables assigns a number to each haplotype containing a nonsynonymous SNP, corresponding to the order of appearance of nonsynonymous SNPs from 5′ to 3′, with letters corresponding to each haplotype in order of decreasing haplotype frequency.
Enzyme activity and substrate kinetics
IMPDH1 and IMPDH2 variant allozymes encoded by alleles with nonsynonymous SNPs were characterized functionally. To do that, WT IMPDH1 and IMPDH2, as well as the five variant allozymes observed during the resequencing studies, were transiently expressed in COS-1 cells to ensure the presence of mammalian post-translational modification and protein degradation systems. We also included the previously reported IMPDH2 Phe263 allozyme in these studies because of its reported reduced kcat value (Wang et al., 2007) and to provide as comprehensive functional genomic data as possible for these important genes. After correcting for transfection efficiency, IMPDH1 Leu275 and IMPDH2 Phe263 showed striking decreases in enzyme activity (10.2 ± 2.0% and 21.4 ± 8.7% of WT levels, respectively, P < 0.0001) (Figure 2A).
Figure 2.
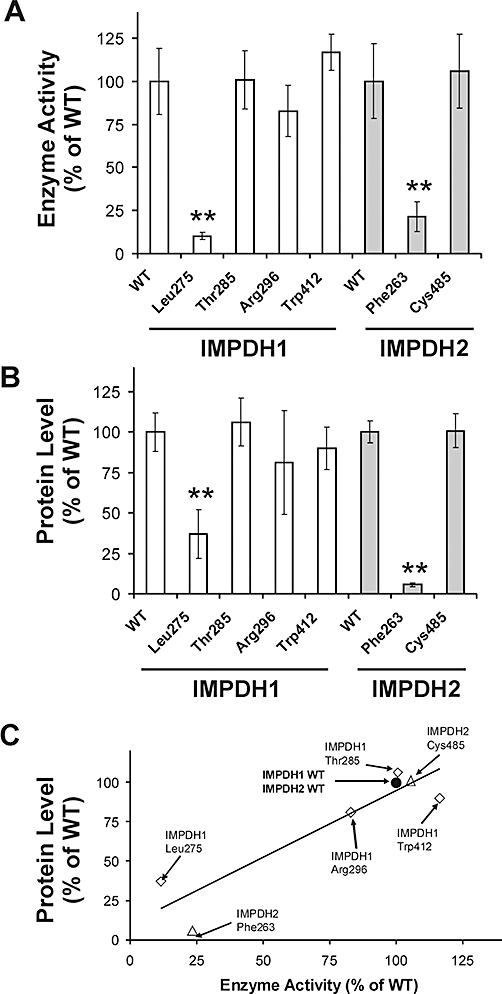
Average levels of IMPDH1 and IMPDH2 enzyme activity (A), and average levels of IMPDH1 and IMPDH2 immunoreactive protein levels (B), both expressed relative to values for the WT allozyme of the appropriate IMPDH isoform after the transfection of COS-1 cells. At least six independent experiments were performed for each allozyme, and results are expressed as a % of values for the WT allozyme. Error bars denote one SD. **Values that differ significantly from that of the appropriate WT allozyme at P < 0.0001. (C) Correlation between IMPDH1 and IMPDH2 allozyme enzyme activity and immunoreactive protein levels after expression in COS-1 cells (r = 0.92, P = 0.0011). The correlation coefficient for only IMPDH1 allozymes was r = 0.93 (P = 0.021), while that for only IMPDH2 allozymes was r = 0.99 (P = 0.033).
Because decreased activity for variant allozymes might be due to alterations in substrate kinetics, we also attempted to determine apparent KM values for both IMP and NAD+ for the two allozymes that displayed striking decreases in activity. Km values for IMPDH1 Leu275 could not be determined accurately because it had extremely low activity. Apparent Km values of WT IMPDH1 for IMP and NAD+ were 9.84 ± 3.52 and 14.5 ± 8.9 µM respectively. Similar values for WT IMPDH2 and IMPDH2 Phe263 were 23.7 ± 5.8 and 10.2 ± 3.6 µM for IMP (P < 0.05 when compared with WT IMPDH2); and 24.9 ± 10.2 and 14.8 ± 8.1 µM for NAD+.
Western blot analysis
Decreased enzyme activity might also be due to reduced protein quantity, as reported previously for many genetically polymorphic enzymes (Weinshilboum and Wang, 2004; Ji et al., 2007; Moyer et al., 2008). Therefore, we performed quantitative Western blot analysis of recombinant IMPDH allozymes in the same cytosol preparations used to assay enzyme activity. After correcting for transfection efficiency, IMPDH1 Leu275 and IMPDH2 Phe263 expressed significantly less immunoreactive protein than did their respective WT allozymes (P < 0.0001, Figure 2B). Leu275 had 37 ± 15% of WT IMPDH1 protein, while Phe263 showed the most dramatic decrease, with only 5.7 ± 1.3% of the WT IMPDH2 value. These quantitative Western blot results were significantly correlated with levels of enzyme activity (r = 0.92, P = 0.0011, Figure 2C), indicating that 85% of the variation in level of enzyme activity might be explained by differences in quantity of immunoreactive protein (Figure 2C).
IMPDH mRNA levels
Decreased mRNA concentrations would be an additional possible explanation for decreased immunoreactive protein levels, perhaps as a result of decreased mRNA stability. Therefore, we performed qRT-PCR with total mRNA isolated from transiently transfected COS-1 cells, using co-transfected lacZ, which encodes β-galactosidase, to control for transfection efficiency. None of the IMPDH1 variant allozymes had an mRNA level that differed significantly from that for the WT allozyme (Figure 3), and while both IMPDH2 variant allozymes had slightly lower mRNA levels than did the WT, these small differences seemed unlikely to account for the observed differences in protein levels (Figure 2A).
Figure 3.
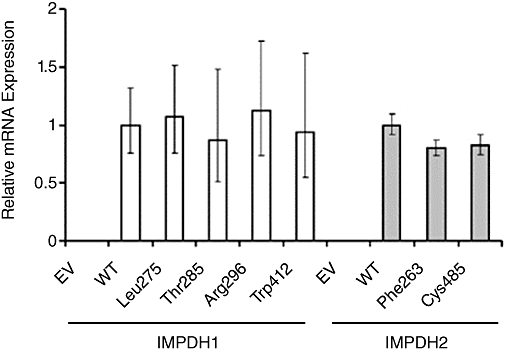
Average IMPDH1 and IMPDH2 allozyme mRNA expression levels as determined by qRT-PCR using SYBR Green chemistry. mRNA levels of IMPDH1 and IMPDH2 allozymes were measured relative to lacZ (which encodes β-galactosidase) mRNA levels, and were normalized to the appropriate WT mRNA level. Error bars denote 95% confidence intervals. EV denotes empty vector.
In vitro protein degradation
Previous studies have shown that reduced protein levels for variant allozymes are often due to accelerated protein degradation (Wang et al., 2003; Weinshilboum and Wang, 2004). Therefore, we performed in vitro degradation assays for IMPDH1 Leu275 and IMPDH2 Phe263 with an untreated RRL that contained all components of the ubiquitin proteasome degradation system. We were able to translate WT IMPDH1 and IMPDH2 as well as the two variant allozymes in vitro with similar efficiencies (Figure S1). However, only IMPDH1 Leu275 displayed accelerated degradation (Figure 4A and B). TPMT*3A, a genetically variant allozyme that was previously shown to be rapidly degraded in the RRL (Wang et al., 2003), was included in these assays as a positive control.
Figure 4.
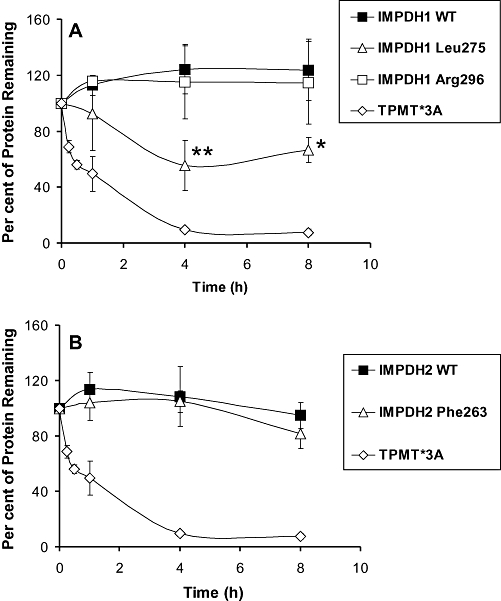
IMPDH1 and IMPDH2 rabbit reticulocyte lysate (RRL) degradation studies. Average levels of 35S-labelled recombinant IMPDH1 (A) and IMPDH2 (B) allozyme protein remaining at 1, 4 and 8 h after incubation in an untreated RRL. Each time point represents the mean level of protein remaining relative to the initial protein level for three independent assays. Error bars denote one SD. *Differs from WT at this time point with P < 0.05. **Differs from WT at this time point with P < 0.01. The rapidly degraded TPMT*3A protein (Wang et al., 2003) was included as a positive control.
In vivo pulse-chase assay
Despite the low protein levels of IMPDH2 Phe263, we did not observe increased protein degradation for this variant in vitro using the RRL system. Because IMPDH2 Phe263 appeared to be transcribed and translated in vitro with efficiency similar to IMPDH2 WT, we performed an in vivo pulse-chase assay on COS-1 cells transiently expressing IMPDH2 WT or Phe263. A 27 h chase revealed that the Phe263 variant was being degraded at a significantly more rapid rate than the WT (Figure 5). These results, together with results from the in vitro degradation assay, suggest that levels of IMPDH2 Phe263 protein might be regulated, in part, by a protein degradation system that requires intact cells – possibly via one of the autophagy pathways.
Figure 5.
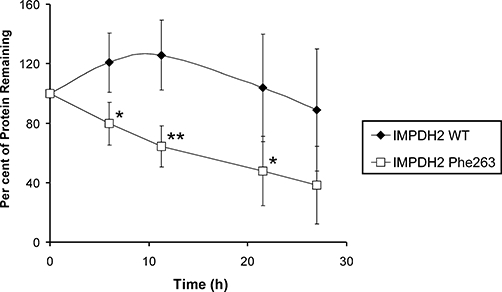
Pulse-chase assay for IMPDH2 WT and Phe263 allozymes. Recombinant IMPDH2 WT or Phe263 were transiently expressed in COS-1 cells, pulse-labelled with 0.1 mCi·mL−1[35S]-methionine, and chased with media containing excess non-radioactive methionine. Average level of 35S-labelled protein remaining was determined at 6, 11, 21 and 27 h. Each time point represents the mean level of protein remaining relative to the initial protein level for four independent assays. Error bars denote one SD. *Differs from WT at this time point with P < 0.05. **Differs from WT at this time point with P < 0.01.
IMPDH variant allozyme structural analysis
Because of the striking decreases that we observed in cytosolic protein levels for IMPDH1 Leu275 and IMPDH2 Phe263 compared with WT (Figure 2B), and because those differences appeared to be due to accelerated degradation, perhaps as a result of protein misfolding (Wang et al., 2005), we also used structural information to help interpret our observations. The Leu275 substitution in IMPDH1 was predicted to have a possible effect on enzyme structure and function. In the WT crystal structure, Ser275 was solvent-exposed and near the active site, with a closest approach of ∼7 Å to the bound 6-Cl-IMP (Figure 6A). It was also near a subunit–subunit tetramer interface. Leu275 substitution might destabilize the WT conformation by introducing a large hydrophobic group at the surface, near the oligomerization interface. Increasing surface hydrophobicity could interfere with tetramerization and/or favour aggregation and membrane interaction, as the exposed hydrophobic residues would tend to interact with similar surfaces on other proteins. For Leu275 IMPDH1, substitution of the larger hydrophobic leucine for the smaller hydrophilic serine probably results in a local conformational change that might also alter enzyme activity as it is near the active site of the enzyme. In contrast, both Thr285 and Arg296 variants substitute hydrophilic residues at surface-exposed positions that are further from the active site and the tetramerization interface and therefore were not predicted to have significant effects on protein structure or function (Figure 6A). Trp412 altered a residue located in a gap in the crystal structure, so structural speculation was not possible.
Figure 6.
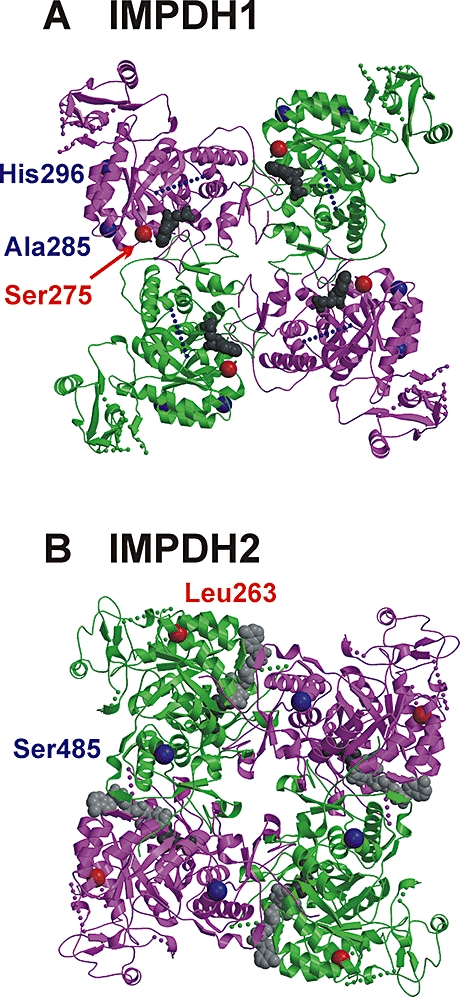
Variant residues within the IMPDH1 and IMPDH2 structures. (A) The tetrameric crystal structure of IMPDH1 is shown as a ribbon diagram (magenta and green) with five gaps for the missing residues within each monomer drawn as dotted lines. The active site bound inhibitor 6-Cl-IMP (shown as gray space-filling spheres) is accessible from the ‘front’ face. The WT amino acids at variant residues are depicted as red or blue spheres. Specifically, Ser275 (red sphere) is located near the active site and the tetramerization interface, while Ala285 and His296 (blue spheres) are distant from both. Arg412 is located in a gap of 50 disordered residues (blue dotted line), so its location cannot be shown. (B) The tetrameric IMPDH2 crystal structure containing ribavirin monophosphate (dark gray spheres) and C2-mycophenolic adenine dinucleotide (light gray spheres) in each active site is shown. From this ‘back’ view, both Leu263 (red sphere) and Ser485 (blue sphere) are distant from the active site and the tetramerization interface.
The IMPDH2 Phe263 variant was also predicted to have unfavourable structural consequences. In the WT crystal structure, the Leu263 side chain was buried in a hydrophobic pocket and was distant from both the active site and tetramerization interface (Figure 6B). Computational substitution of the bulkier Phe263 residue would introduce a number of energetically unfavourable short contacts that could not be relieved with adjustment of only side chain conformation and would have a substantial effect on local protein conformation. Therefore, the Phe263 substitution would probably interfere with protein folding and/or stability. In contrast, the Cys485 IMPDH2 variant represented the conservative substitution of a hydrophilic solvent-exposed residue distant from both the active site and tetramerization interface. It could easily be accommodated by the WT protein conformation and, as a result, was thought to be unlikely to compromise folding and/or stability.
SNP-associated variation in mRNA levels
As intronic, 3′-FR or 5′-FR SNPs can influence transcription (Cheung et al., 2005), we also attempted to determine whether SNPs outside of the open reading frames might be associated with IMPDH1 and IMPDH2 mRNA expression. We first obtained expression array data for the same lymphoblastoid cell lines from which the DNA used in our gene resequencing studies had been obtained. IMPDH2 was highly expressed, but IMPDH1 expression was too low to be measured reliably, so our analyses focused on IMPDH2.
Basal IMPDH2 mRNA expression varied fivefold (Figure 7A), displayed a log-normal distribution (Figure 7B) and did not differ significantly across the three populations studied (Figure 7C). A random subset of the samples (n = 30) was used for qRT-PCR validation of the microarray results. The two sets of data were significantly correlated, with r = 0.63, P = 0.0002 (Figure S2). Subsequent SNP–expression association analyses showed that only a single IMPDH2 SNP, IVS1(93), was significantly associated with basal mRNA expression (P = 0.045).
Figure 7.
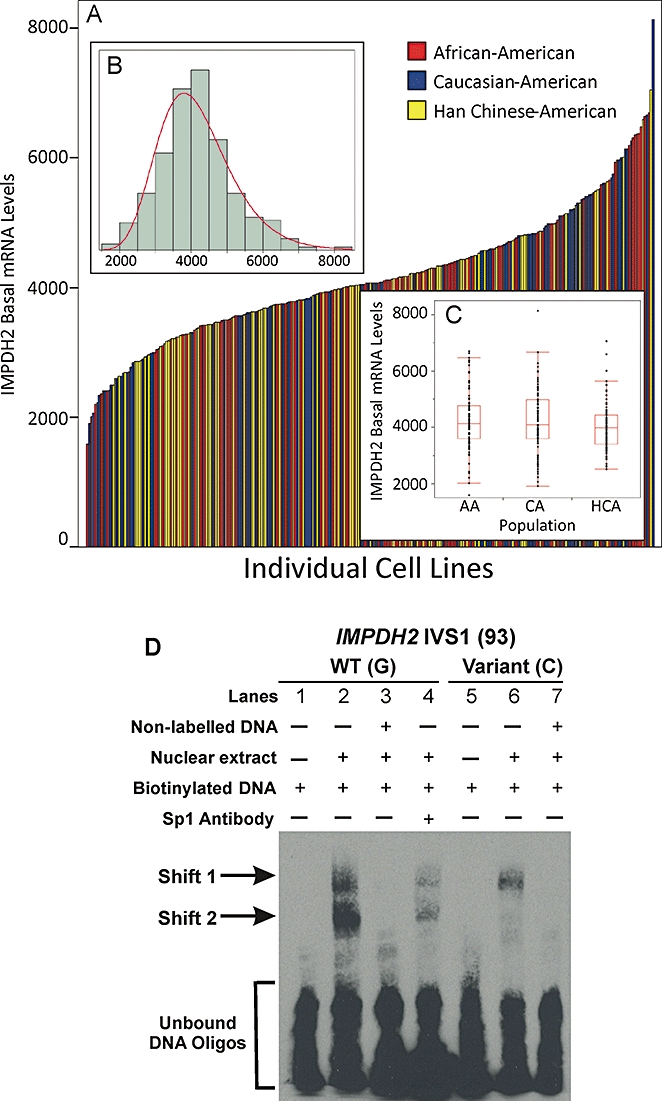
Basal IMPDH2 mRNA expression levels in the lymphoblastoid cell lines from which the resequenced DNA was obtained. (A) Variation in IMPDH2 basal mRNA expression levels. Each bar represents an individual cell line, and the height of the bar represents the basal mRNA expression level. Bars are colour-coded by ethnic group. (B) Frequency distribution histogram of IMPDH2 basal mRNA expression levels. (C) IMPDH2 basal mRNA expression did not differ across the three populations studied. AA, African-American; CA, Caucasian-American; HCA, Han Chinese-American. (D) Electrophoretic mobility shift assay blot for IMPDH2 SNP IVS1(93) to investigate potential protein–DNA interactions. Lanes 1–4 contain DNA oligonucleotides with the WT sequence and lanes 5–7 contain DNA oligonucleotides with the variant nucleotide sequence. Lanes 1 and 5 contain no nuclear extract protein and serve as negative controls. Lane 2 shows that DNA oligonucleotides with the WT sequence result in two electrophoretic mobility shifts, ‘Shift 1’ and ‘Shift 2’. Lane 6, which contains DNA oligonucleotides with the variant sequence, shows that the variant sequence cannot bind the protein(s) that result in ‘Shift 2’. Lanes 3 and 7 contain excess non-labelled DNA oligonucleotides to show that the protein–DNA interactions seen in lanes 3 and 6 are specific. Addition of Sp1 antibody did not result in a supershift of either ‘Shift 1’ or ‘Shift 2’, but did attenuate both mobility shifts (lane 4).
In order to determine whether IVS1(93) might be located within a sequence that could bind potential regulatory proteins, we performed EMS assays, assays that are used to investigate protein–DNA interactions. Our EMS assays showed that sequences containing IVS1(93) could bind nuclear extract protein from these cells, resulting in a mobility shift of biotinylated DNA oligonucleotides from the region of unbound DNA oligonucleotides to ‘Shift 1’ and ‘Shift 2’ positions (Figure 7D, lane 2). The presence of the variant allele, however, abolished protein binding at ‘Shift 2’ (Figure 7D, lane 6). Because the WT sequence surrounding this SNP was predicted to bind to the transcription factor Sp1, while the variant nucleotide was predicted to abolish this putative binding site (Heinemeyer et al., 1998), we attempted a ‘supershift’ assay with an Sp1 antibody. Addition of the antibody did not result in a ‘supershift’ above the original shifts, but the Sp1 antibody did attenuate protein binding (Figure 7D, compare lane 4 with lane 2).
Discussion and conclusions
We set out to identify and functionally characterize polymorphisms in IMPDH1 and IMPDH2. Gene resequencing, performed with 288 DNA samples from three ethnic groups, resulted in the identification of 73 SNPs in IMPDH1 (59 novel) and 25 SNPs in IMPDH2 (24 novel). We then pursued the potential functional implications of nonsynonymous SNPs as well as SNPs that might alter transcription. Four nonsynonymous SNPs were identified in IMPDH1 and one in IMPDH2, and we also performed functional genomic studies of the previously described IMPDH2 Phe263 allozyme (Wang et al., 2007).
Two allozymes, IMPDH1 Leu275 (identified during our resequencing study) and IMPDH2 Phe263 (reported previously by Wang et al., 2007), displayed striking decreases in cytosolic IMPDH activity (Figure 2). The decreased activity for IMPDH1 Leu275 could be explained, in part, by a decrease in immunoreactive protein (Figure 2B) caused by accelerated protein degradation (Figure 4A). This observation was supported by molecular modelling, which showed that the Leu275 substitution might compromise protein folding/tetramerization/stability and might also compromise enzyme activity by altering protein structure adjacent to the active site. The decreased activity of Phe263 correlated with a decrease in immunoreactive protein. Although neither changes in mRNA expression (Figure 3) nor in vitro protein degradation via ubiquitin-mediated proteasomal degradation could explain the decreased expression (Figure 4B), an in vivo pulse-chase assay showed that the decrease in immunoreactive protein for Phe263 could also be attributed to accelerated protein degradation (Figure 5), albeit through a process – possibly autophagy – that was not observed in the RRL system. These results also agreed with our structural modelling results, which showed that introduction of the bulky Phe263 residue was incompatible with the WT conformation and, as a result, could interfere with protein folding and/or stability. Our results extend the initial observation of low activity for Phe263 (Wang et al., 2007) by suggesting that protein degradation may be a mechanism contributing to the decrease in activity. Although minor allele frequencies for these nonsynonymous SNPs are relatively low, Phe263, Leu275 and other, as yet unidentified rare variants of large effect in IMPDH1 and IMPDH2, might have clinical significance.
In addition to alterations in function as a result of nonsynonymous SNPs, we also found that the IMPDH2 IVS1(93) SNP was associated with a decrease in IMPDH2 basal mRNA expression in lymphoblastoid cell lines. Furthermore, EMS assays showed that the variant nucleotide resulted in loss of nuclear extract protein binding (Figure 7D), perhaps by disrupting the binding of a transcription factor(s). These results will obviously require replication because of the low minor allele frequency of the IVS1(93) SNP.
Our results, in addition to providing insight into mechanisms by which IMPDH1 and IMPDH2 SNPs alter function, also provide polymorphism data that can be used to seek clinically relevant IMPDH1 and IMPDH2 SNP–expression or SNP–clinical phenotype correlations. The majority of the 73 SNPs that we observed in IMPDH1 and the 25 SNPs we observed in IMPDH2 were novel (previously unavailable in public databases). Because we utilized DNA from individuals representing three ethnic groups, we were also able to demonstrate that both genes display striking ethnic-dependent sequence variation, raising the possibility that patients from different ethnic groups might respond differently to ‘standard’ doses of MPA. For instance, the most common IMPDH1 haplotype in AA and CA populations (*1A), is relatively uncommon in the HCA population, and the second most common haplotype in the HCA population (*1R, 18.7%) is not found in the AA population and is present at only a 3.1% frequency in the CA population (Table S2). As previous studies seeking to link genetic variation in IMPDH1 and IMPDH2 with response to MPA have primarily focused on Caucasians of European descent (Sombogaard et al., 2009; Winnicki et al., 2010) or on populations of undefined ethnicity (Wang et al., 2007; 2008;), our results will facilitate genotype–phenotype correlation studies performed with more diverse populations.
In summary, we have performed a comprehensive series of studies of common genetic variation in IMPDH1 and IMPDH2 in three populations and identified a novel nonsynonymous IMPDH1 SNP associated with dramatically decreased activity. Our results have also provided insight into possible mechanisms by which SNPs in IMPDH1 and IMPDH2 could result in altered function. These observations will provide a foundation for future studies correlating sequence variation in these important genes with clinical outcome in patients being treated with MPA as well as future translational pharmacogenomic studies of MPA in transplantation recipients.
Acknowledgments
This work was supported in part by a Predoctoral Fellowship Award from the American Heart Association to T-Y Wu (09PRE2080377); by National Institutes of Health grants R01 GM28157, U01 GM61388 (The Pharmacogenetics Research Network) and R01 CA132780; and by a PhRMA Foundation ‘Center of Excellence Award in Clinical Pharmacology’. We thank Judith Gilbert for advice with regard to the high performance liquid chromatography assays.
Glossary
Abbreviations
- 3MA
3-methyladenine
- AA
African-American
- CA
Caucasian-American
- EMS
electrophoretic mobility shift
- FR
flanking region
- HCA
Han Chinese-American
- IMPDH
inosine monophosphate dehydrogenase
- MPA
mycophenolic acid
- qRT-PCR
quantitative reverse transcription polymerase chain reaction
- RRL
rabbit reticulocyte lysate
- SDS-PAGE
sodium dodecyl sulphate polyacrylamide gel electrophoresis
- SNP
single nucleotide polymorphism
- WT
wild-type
Conflict of interest
None.
Supporting information
Additional Supporting Information may be found in the online version of this article:
Figure S1 Results of IMPDH1 and IMPDH2 allozyme in vitro translation using a rabbit reticulocyte lysate system.
Figure S2 qRT-PCR correlation with expression microarray results for IMPDH2.
Table S1 Sequences of primer pairs used to amplify IMPDH1 and IMPDH2 prior to resequencing
Table S2 IMPDH1 haplotypes with frequencies of 1% or greater
Table S3 IMPDH2 haplotypes with frequencies of 1% or greater
Please note: Wiley-Blackwell are not responsible for the content or functionality of any supporting materials supplied by the authors. Any queries (other than missing material) should be directed to the corresponding author for the article.
References
- Allison AC, Eugui EM. Mycophenolate mofetil and its mechanisms of action. Immunopharmacology. 2000;47:85–118. doi: 10.1016/s0162-3109(00)00188-0. [DOI] [PubMed] [Google Scholar]
- Carr SF, Papp E, Wu JC, Natsumeda Y. Characterization of human type I and type II IMP dehydrogenases. J Biol Chem. 1993;268:27286–27290. [PubMed] [Google Scholar]
- Cheung VG, Spielman RS, Ewens KG, Weber TM, Morley M, Burdick JT. Mapping determinants of human gene expression by regional and genome-wide association. Nature. 2005;437:1365–1369. doi: 10.1038/nature04244. [DOI] [PMC free article] [PubMed] [Google Scholar]
- Emsley P, Cowtan K. Coot: model-building tools for molecular graphics. Acta Crystallogr D Biol Crystallogr. 2004;60:2126–2132. doi: 10.1107/S0907444904019158. [DOI] [PubMed] [Google Scholar]
- Fernandez A, Martins J, Villlafruela JJ, Marcen R, Pascual J, Cano T, et al. Variability of mycophenolate mofetil trough levels in stable kidney transplant patients. Transplant Proc. 2007;39:2185–2186. doi: 10.1016/j.transproceed.2007.06.025. [DOI] [PubMed] [Google Scholar]
- Glander P, Braun KP, Hambach P, Bauer S, Mai I, Roots I, et al. Non-radioactive determination of inosine 5′-monophosphate dehydro-genase (IMPDH) in peripheral mononuclear cells. Clin Biochem. 2001;34:543–549. doi: 10.1016/s0009-9120(01)00267-3. [DOI] [PubMed] [Google Scholar]
- Glander P, Hambach P, Braun KP, Fritsche L, Giessing M, Mai I, et al. Pre-transplant inosine monophosphate dehydrogenase activity is associated with clinical outcome after renal transplantation. Am J Transplant. 2004;4:2045–2051. doi: 10.1111/j.1600-6143.2004.00617.x. [DOI] [PubMed] [Google Scholar]
- Glander P, Sombogaard F, Budde K, van Gelder T, Hambach P, Liefeldt L, et al. Improved assay for the nonradioactive determination of inosine 5′-monophosphate dehydrogenase activity in peripheral blood mononuclear cells. Ther Drug Monit. 2009;31:351–359. doi: 10.1097/FTD.0b013e31819c3f3d. [DOI] [PubMed] [Google Scholar]
- Gu JJ, Spychala J, Mitchell BS. Regulation of the human inosine monophosphate dehydrogenase type I gene. Utilization of alternative promoters. J Biol Chem. 1997;272:4458–4466. doi: 10.1074/jbc.272.7.4458. [DOI] [PubMed] [Google Scholar]
- Gu JJ, Stegmann S, Gathy K, Murray R, Laliberte J, Ayscue L, et al. Inhibition of T lymphocyte activation in mice heterozygous for loss of the IMPDH II gene. J Clin Invest. 2000;106:599–606. doi: 10.1172/JCI8669. [DOI] [PMC free article] [PubMed] [Google Scholar]
- Gu JJ, Tolin AK, Jain J, Huang H, Santiago L, Mitchell BS. Targeted disruption of the inosine 5′-monophosphate dehydrogenase type I gene in mice. Mol Cell Biol. 2003;23:6702–6712. doi: 10.1128/MCB.23.18.6702-6712.2003. [DOI] [PMC free article] [PubMed] [Google Scholar]
- Hartl DL, Clark AG. Principles of Population Genetics. 4th edn. Sunderland, MA: Sinauer Associates; 2007. [Google Scholar]
- Hedrick PW. Genetics of Populations. 2nd edn. Sudbury, MA: Jones and Bartlett Publishers; 2000. [Google Scholar]
- Heinemeyer T, Wingender E, Reuter I, Hermjakob H, Kel AE, Kel OV, et al. Databases on transcriptional regulation: TRANSFAC, TRRD and COMPEL. Nucleic Acids Res. 1998;26:362–367. doi: 10.1093/nar/26.1.362. [DOI] [PMC free article] [PubMed] [Google Scholar]
- Ji Y, Gu J, Makhov AM, Griffith JD, Mitchell BS. Regulation of the interaction of inosine monophosphate dehydrogenase with mycophenolic acid by GTP. J Biol Chem. 2006;281:206–212. doi: 10.1074/jbc.M507056200. [DOI] [PubMed] [Google Scholar]
- Ji Y, Moon I, Zlatkovic J, Salavaggione OE, Thomae BA, Eckloff BW, et al. Human hydroxysteroid sulfotransferase SULT2B1 pharmacogenomics: gene sequence variation and functional genomics. J Pharmacol Exp Ther. 2007;322:529–540. doi: 10.1124/jpet.107.122895. [DOI] [PubMed] [Google Scholar]
- Kraulis PJ. MOLSCRIPT: a program to produce both detailed and schematic plots of protein structures. J Appl Crystallogr. 1991;19:946–950. [Google Scholar]
- Mak A, Cheak AA, Tan JY, Su HC, Ho RC, Lau CS. Mycophenolate mofetil is as efficacious as, but safer than, cyclophosphamide in the treatment of proliferative lupus nephritis: a meta-analysis and meta-regression. Rheumatology (Oxford) 2009;48:944–952. doi: 10.1093/rheumatology/kep120. [DOI] [PubMed] [Google Scholar]
- Merritt EA, Bacon DJ. Raster3D: photorealistic molecular graphics. Methods Enzymol. 1997;277:505–524. doi: 10.1016/s0076-6879(97)77028-9. [DOI] [PubMed] [Google Scholar]
- Moyer AM, Salavaggione OE, Wu TY, Moon I, Eckloff BW, Hildebrandt MA, et al. Glutathione S-transferase P1: gene sequence variation and functional genomic studies. Cancer Res. 2008;68:4791–4801. doi: 10.1158/0008-5472.CAN-07-6724. [DOI] [PMC free article] [PubMed] [Google Scholar]
- Ogino S, Gulley ML, den Dunnen JT, Wilson RB, Association E. Standard mutation nomenclature in molecular diagnostics: practical and educational challenges. J Mol Diagn. 2007;9:1–6. doi: 10.2353/jmoldx.2007.060081. [DOI] [PMC free article] [PubMed] [Google Scholar]
- Pisupati J, Jain A, Burckart G, Hamad I, Zuckerman S, Fung J, et al. Intraindividual and interindividual variations in the pharmacokinetics of mycophenolic acid in liver transplant patients. J Clin Pharmacol. 2005;45:34–41. doi: 10.1177/0091270004270145. [DOI] [PubMed] [Google Scholar]
- Purcell S, Neale B, Todd-Brown K, Thomas L, Ferreira MA, Bender D, et al. PLINK: a tool set for whole-genome association and population-based linkage analyses. Am J Hum Genet. 2007;81:559–575. doi: 10.1086/519795. [DOI] [PMC free article] [PubMed] [Google Scholar]
- Schaid DJ, Rowland CM, Tines DE, Jacobson RM, Poland GA. Score tests for association between traits and haplotypes when linkage phase is ambiguous. Am J Hum Genet. 2002;70:425–434. doi: 10.1086/338688. [DOI] [PMC free article] [PubMed] [Google Scholar]
- Senda M, Natsumeda Y. Tissue-differential expression of two distinct genes for human IMP dehydrogenase (E.C.1.1.1.205) Life Sci. 1994;54:1917–1926. doi: 10.1016/0024-3205(94)90150-3. [DOI] [PubMed] [Google Scholar]
- Sombogaard F, van Schaik RH, Mathot RA, Budde K, van der Werf M, Vulto AG, et al. Interpatient variability in IMPDH activity in MMF-treated renal transplant patients is correlated with IMPDH type II 3757T > C polymorphism. Pharmacogenet Genomics. 2009;19:626–634. doi: 10.1097/FPC.0b013e32832f5f1b. [DOI] [PubMed] [Google Scholar]
- Spellicy CJ, Daiger SP, Sullivan LS, Zhu J, Liu Q, Pierce EA, et al. Characterization of retinal inosine monophosphate dehydrogenase 1 in several mammalian species. Mol Vis. 2007;13:1866–1872. [PubMed] [Google Scholar]
- Tajima F. DNA polymorphism in a subdivided population: the expected number of segregating sites in the two-subpopulation model. Genetics. 1989a;123:229–240. doi: 10.1093/genetics/123.1.229. [DOI] [PMC free article] [PubMed] [Google Scholar]
- Tajima F. Statistical method for testing the neutral mutation hypothesis by DNA polymorphism. Genetics. 1989b;123:585–595. doi: 10.1093/genetics/123.3.585. [DOI] [PMC free article] [PubMed] [Google Scholar]
- Takebe N, Cheng X, Wu S, Bauer K, Goloubeva OG, Fenton RG, et al. Phase I clinical trial of the inosine monophosphate dehydrogenase inhibitor mycophenolate mofetil (cellcept) in advanced multiple myeloma patients. Clin Cancer Res. 2004;10:8301–8308. doi: 10.1158/1078-0432.CCR-04-0747. [DOI] [PubMed] [Google Scholar]
- Van Der Spoel D, Lindahl E, Hess B, Groenhof G, Mark AE, Berendsen HJ. GROMACS: fast, flexible, and free. J Comput Chem. 2005;26:1701–1718. doi: 10.1002/jcc.20291. [DOI] [PubMed] [Google Scholar]
- Wang L, Sullivan W, Toft D, Weinshilboum R. Thiopurine S-methyltransferase pharmacogenetics: chaperone protein association and allozyme degradation. Pharmacogenetics. 2003;13:555–564. doi: 10.1097/01.fpc.0000054124.14659.99. [DOI] [PubMed] [Google Scholar]
- Wang L, Nguyen TV, McLaughlin RW, Sikkink LA, Ramirez-Alvarado M, Weinshilboum RM. Human thiopurine S-methyltransferase pharmacogenetics: variant allozyme misfolding and aggresome formation. Proc Natl Acad Sci USA. 2005;102:9394–9299. doi: 10.1073/pnas.0502352102. [DOI] [PMC free article] [PubMed] [Google Scholar]
- Wang J, Zeevi A, Webber S, Girnita DM, Addonizio L, Selby R, et al. A novel variant L263F in human inosine 5′-monophosphate dehydrogenase 2 is associated with diminished enzyme activity. Pharmacogenet Genomics. 2007;17:283–290. doi: 10.1097/FPC.0b013e328012b8cf. [DOI] [PubMed] [Google Scholar]
- Wang J, Yang JW, Zeevi A, Webber SA, Girnita DM, Selby R, et al. IMPDH1 gene polymorphisms and association with acute rejection in renal transplant patients. Clin Pharmacol Ther. 2008;83:711–717. doi: 10.1038/sj.clpt.6100347. [DOI] [PubMed] [Google Scholar]
- Weinshilboum R, Wang L. Pharmacogenetics: inherited variation in amino acid sequence and altered protein quantity. Clin Pharmacol Ther. 2004;75:253–258. doi: 10.1016/j.clpt.2003.12.002. [DOI] [PubMed] [Google Scholar]
- Winnicki W, Weigel G, Sunder-Plassmann G, Bajari T, Winter B, Herkner H, et al. An inosine 5′-monophosphate dehydrogenase 2 single-nucleotide polymorphism impairs the effect of mycophenolic acid. Pharmacogenomics J. 2010;10:70–76. doi: 10.1038/tpj.2009.43. [DOI] [PubMed] [Google Scholar]
- Wu JC. Mycophenolate mofetil: molecular mechanisms of action. Perspect Drug Discov. 1994;2:185–204. [Google Scholar]
- Zimmermann AG, Spychala J, Mitchell BS. Characterization of the human inosine-5′-monophosphate dehydrogenase type II gene. J Biol Chem. 1995;270:6808–6814. doi: 10.1074/jbc.270.12.6808. [DOI] [PubMed] [Google Scholar]
- Zimmermann AG, Wright KL, Ting JP, Mitchell BS. Regulation of inosine-5′-monophosphate dehydrogenase type II gene expression in human T cells. Role for a novel 5′ palindromic octamer sequence. J Biol Chem. 1997;272:22913–22923. doi: 10.1074/jbc.272.36.22913. [DOI] [PubMed] [Google Scholar]
Associated Data
This section collects any data citations, data availability statements, or supplementary materials included in this article.