Abstract
Ion mobility spectrometry (IMS), and particularly differential IMS or FAIMS, is emerging as a versatile tool for separation and identification of gas-phase ions, especially in conjunction with mass spectrometry. For over two decades since its inception, the utility of FAIMS was constrained by resolving power (R) of less than ~20. Stronger electric fields and optimized gas mixtures have recently raised achievable R to ~200, but further progress with such approaches is impeded by electrical breakdown. However, the resolving power of planar FAIMS devices using any gas and field intensity scales as the square root of separation time (t). Here, we extended t from the previous maximum of 0.2 s up to fourfold by reducing the carrier gas flow and increased the resolving power by up to twofold as predicted, to >300 for multiply-charged peptides. The resulting resolution gain has enabled separation of previously “co-eluting” peptide isomers, including folding conformers and localization variants of modified peptides. More broadly, a peak capacity of ~200 has been reached in tryptic digest separations.
Introduction
The preeminent platform of modern analytical chemistry is mass spectrometry (MS) preceded by separation step(s), and coupling of pre-ionization methods using liquid chromatography (LC) or electrophoresis to MS is the staple of biological and environmental analyses.1–3 Over the last decade, those approaches have been increasingly supplemented or replaced by post-ionization separations in the gas phase employing ion mobility spectrometry (IMS).4–14 The key advantage of IMS is speed, with separations requiring tens of minutes to hours in the condensed phase completed in <1 s. As the LC and IMS mechanisms are unrelated, these dimensions are quite ‘orthogonal’ and online LC/IMS combines exceptional separation power with throughput largely determined by the LC stage.7,9,12,13 The two branches of IMS are conventional IMS4–9 based on the absolute ion mobility (K) measured at moderate electric field intensity (E) and differential or field asymmetric waveform IMS (FAIMS)10–14 relying on the difference between mobilities at high and low E. These methods are also substantially orthogonal,14,15 and the peak capacity of 2-D FAIMS/(conventional IMS) greatly exceeds that of either stage.14 Implementations of conventional IMS include drift-tube (DT) IMS,4 traveling-wave (TW) IMS,16,17 and differential mobility analyzers (DMA).18 These differ in optimum applications: the dispersive methods of DTIMS and TWIMS are appropriate for global analyses while the filtering technique of DMA is best for targeted use. However, all three are based on the same physical property and therefore yield identical separations.
One way to engineer FAIMS has been devised so far.5,10 A buffer gas flow pushes ions through a gap between a pair of electrodes carrying a periodic asymmetric waveform of some amplitude (dispersion voltage, DV). In the resulting “dispersion field” (ED), ions oscillate and drift to one of the electrodes, with speed depending on the sign of the difference between mobility in the high- and low-E segments of opposite polarity. Eventually, all ions would be neutralized on electrodes. For a given species, the drift may be canceled (and ions equilibrated in the gap) by constant weak “compensation field” (EC) created by “compensation voltage” (CV) superposed on the waveform. Scanning CV produces the spectrum of species submitted to analysis. The resolution depends on the gap shape, maximizing for planar gaps with homogeneous field inside.19
The IMS alternative to condensed-phase methods has been held back by limited separation power. For example, for tryptic peptides in proteomics, capillary LC can provide20 the resolving power (R) and peak capacity of ~103, while DTIMS achieved21 the maximum R of ~180 – 240 for ions with charge state (z) of 3 and 4. The maxima for TWIMS and DMA, despite major gains for both lately, are much lower: ~40 and ~80, respectively.22,23 The metrics for FAIMS used to be even worse (R ~ 10 – 20), though that was partly offset by generally greater orthogonality to MS.5,10 FAIMS resolution tends to improve at higher ED or helium content in the gas, and we have raised R by order of magnitude (up to ~200 for 3+ and 4+ peptides)24,25 using the 3:1 He/N2 mixture with ED = 21 kV/cm (at DV = 4 kV) or the 1:1 He/N2 buffer with ED = 29 kV/cm (at DV = 5.4 kV). With that, many species “co-eluting” in low-resolution commercial FAIMS systems, such as amino acid and peptide isomers (including isotopomers26 and peptides modified at different sites27), were separated. Still, others were only partly resolved if at all, and the need for resolution and specificity in characterization of complex samples is virtually open-ended. Further increase of ED or He content in the same analyzer is prohibited by electrical breakdown (facilitated by He addition).24,25,28 Much higher ED and He fractions are feasible in narrower gaps where the breakdown is suppressed by the Paschen law,28,29 but, to maintain the transmission efficiency through tighter gaps, one must shorten the separation time (t). With planar gaps, the fwhm peak widths (w) scale as t−1/2 and the resolution loss outweighs the benefits of higher fields.25,29,30
However, the resolving power of planar FAIMS devices may be raised (at the cost of lower ion transmission, and thus sensitivity) using longer separations. For high-resolution studies,24,25,27 we accepted t = 0.2 s that was typical for preceding work with cylindrical devices.10 Here we extend the separation to t ~ 0.33 – 0.8 s and expectedly improve R by ~40 – 100%, to >300 for multiply-charged peptides. This gain has allowed separating previously unresolved species, including some peptide modification variants.
Experimental Methods
We employed a previously described planar FAIMS analyzer (with the analytical gap of 1.88 mm width and ~50 mm length) coupled to an LTQ ion trap MS system (Thermo Fisher) with electrospray ionization (ESI) source.24,25. An ion funnel in the MS inlet31 was crucial to obtain a fair signal despite severe losses due to extended ion residence in the FAIMS gap. The 2:1 bisinusoidal waveform of 750 kHz frequency had DV of 4 or 5.4 kV. The separation time is inversely proportional to the flow rate of carrier gas (here N2 or He/N2 mixtures) through the gap (Q), set by flow controllers (MKS Instruments, Andover, MA). Here, Q was reduced from the previous minimum24,25 of 2.0 L/min (for t = 0.2 s) to 0.5 – 1.2 L/min. Other instrumental parameters were as in previous work.24,25,27 As higher He fractions accelerate ion diffusion in the gap and thus reduce the transmission efficiency with any t, the greatest He content often precluded the lowest Q values. The peptide standards were concentrated to ~10 – 20 μM for better ion signal. The tryptic digest of bovine serum albumin (BSA) was kept at 1.5 uM for starting protein.
Near the range bottom, Q was less than the conductance of MS inlet capillary (~0.8 L/min). The FAIMS unit, however, was not sealed to the inlet and remained under positive pressure, expelling the buffer gas out of the curtain plate/orifice interface at the entrance rather than pulling atmospheric air in. Indeed, EC values for various ions did not depend on Q even at the maximum He fraction in the buffer. The flow to ESI/FAIMS interface at Q < 0.8 L/min was marginal, causing insufficient ion desolvation with ensuing drastic drop and poor stability of signal. At Q < 0.5 L/min, the spectra abruptly converted to broad features at low EC, indicating the penetration of ambient air, ESI solvent vapor, and/or solvated ions into the gap (presumably, as the FAIMS unit switched to the negative pressure). Thus present design requires Q ≥ 0.5 L/min, limiting the attainable resolution.
Results and Discussion
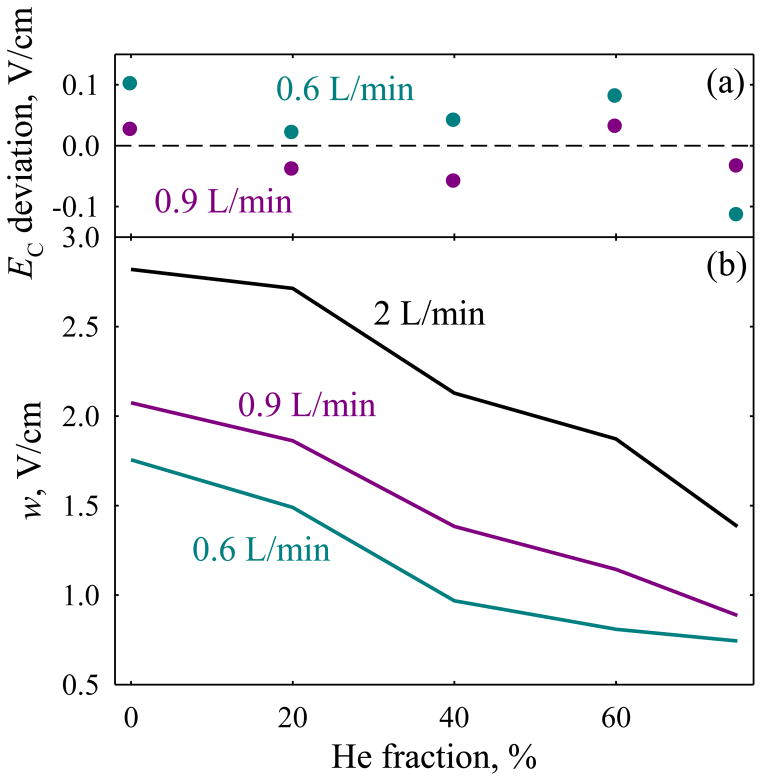
We have first determined the effect of longer residence times for the test case of protonated reserpine that exhibits an intense, well-shaped peak in FAIMS.24,25 At DV = 4 kV and 0 – 75 % He, the EC values with t ~ 0.44 – 0.67 s (Q = 0.9 – 0.6 L/min) track those with t = 0.2 s (Fig. 1a) within the experimental error margin of 0.1 V/cm. (Ideally, the EC values are independent of the separation time.) The peaks at each He fraction narrow when t is extended beyond 0.2 s (Fig. 1b), and the resolving power increases by ~35 – 65% (on average, 51%) with t ~ 0.44 s and ~60 – 130% (on average, 96%) with 0.67 s. These gains are close to 49% and 83%, respectively, expected from the t1/2 scaling. The actual gains should exceed those estimates, because t includes a fixed onset time upon ion injection into the gap (needed for the filtering to start when species with wrong CV cross the gap and begin touching the electrodes.)5,30 Approximating the “wasted” time at 10 – 20 ms,30 the projected resolution gains increase to 51 – 54% (at t = 0.44 s) and 86 – 90% (at 0.67 s), in agreement with experiment. To quantify the statistics of peak widths at 75% He, we obtained consecutive replicates by looping over a narrow spectral window (Fig. S1). Based on ~20 replicates acquired over ~1 hr., we found (at 95% confidence) w = 0.886 ± 0.034 V/cm with Q = 0.9 L/min and 0.743 ± 0.030 V/cm with 0.7 L/min.
Fig. 1.
Properties measured for the (H+)reserpine feature at DV = 4 kV depending on the He content, with various flow rates: (a) shifts of peak position relative to the values with Q = 2 L/min, (b) peak widths (fwhm). At 75% He, we used Q = 0.7 L/min instead of 0.6 L/min for better peak shape.
Unlike reserpine, many biomolecules are flexible and irreversibly isomerize (denature) upon even a moderate heating. For peptides and proteins, this normally appears as the unfolding of tertiary and then secondary structure.32 Ions in FAIMS are heated by separation field and the unfolding of proteins (and thus, arguably, peptides) is controlled by the maximum temperature at waveform peaks that depends on the ion mobility.33,34 For multiply-charged peptides generated by ESI, exemplified by bradykinin (Bk) 2+, that temperature in the present FAIMS unit reaches25 ~170 °C at {DV = 4 kV; 75% He} and ~250 °C at {DV = 5.4 kV; 50% He}. These temperatures suffice for substantial denaturation, and ~10 unfolded conformers (presumably, pathway intermediates) were resolved24,25 for Bk2+.
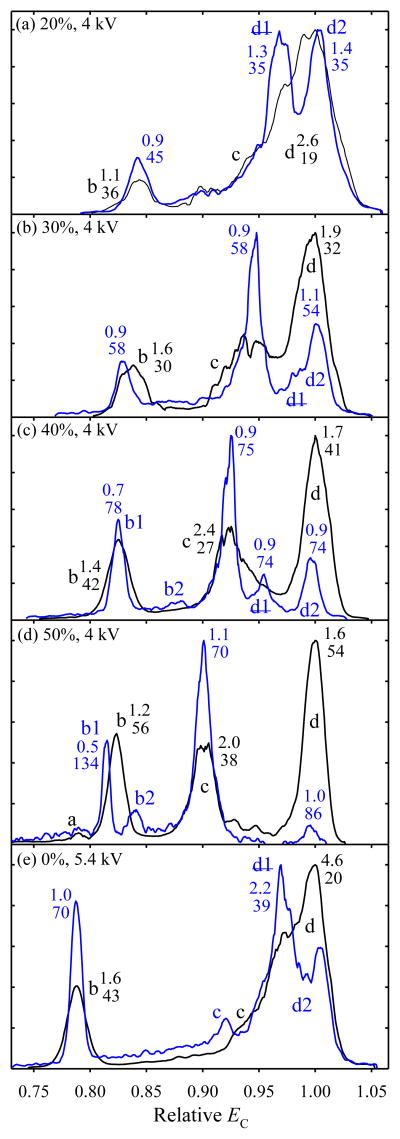
As seen in common cooking, the extent of denaturation also depends on the heating duration. Hence, besides resolving conformers better, a longer FAIMS separation may change their distribution. Indeed, extending t for Bk2+ from 0.2 to ~0.8 s raises the fraction of low-EC features at both DV and all He fractions tried (Fig. 2). This pattern suggests unfolding, which decreases EC for peptides and proteins.24,25,35,36 However, FAIMS eliminates species that shifted EC within the gap by more than the peak width (similarly to the loss of fragments from ions dissociated inside a selection quadrupole in MS).33,34 Therefore, the relative abundance of unfolded low-EC ions grows over the additional residence time not because folded high-EC species turn into them, but because they isomerize and are removed while the unfolded ions remain stable and pass the gap. In contrast with increases of DV or He percentage,24,25 extending the separation results in no new peaks at low EC. This happens because higher DV or He content raise the ion temperature, which may create new isomers in the FAIMS entrance region,25 whereas longer heating may only extinguish pre-existing isomers.
Fig. 2.
Spectra for (H+)2bradykinin at {DV = 4 kV; 20 – 50% He} and DV = 5.4 kV in N2 as labeled, with Q = 2 L/min (black) and 0.5 L/min (blue). The widths (V/cm) and resolving power values underneath are given for the major well-shaped peaks.
The resolution gains for the 14 features marked in five panels of Fig. 2 are 1.3 – 2.8 times with the mean of 1.94 times, which matches the expected value of (0.8/0.2)1/2 = 2. With improved resolution at longer t, some features that seemed to contain multiple conformers split (Fig. 2). In particular, a broad peak (d), which dominated the spectra with t = 0.2 s at low He fractions and either DV,24,25 partitions into (d1) and (d2). Although R for both at DV = 4 kV and 20% He is just 35 (Fig 2a) vs. ~100 for Bk2+ conformers24 at 75% He with t = 0.2 s, at no He fraction were (d1) and (d2) distinguished in refs. [24, 37]. This is likely because, by the point the He content got high enough to separate these species, they were unfolded by heating. Thus extended analyses at lower DV and/or He fractions may resolve fragile ions that do not survive a more effective, but more vigorous FAIMS regime. Extensive isomerization and poorly resolved conformers have rendered bradykinin unsuitable for evaluation of resolving power with t = 0.2 s.25 Here, we could not obtain quality spectra at the maximum DV and He content because of low signal, apparently due to destruction of nearly all ions upon unfolding - an extreme manifestation of the “self-cleaning” mechanism.33,34
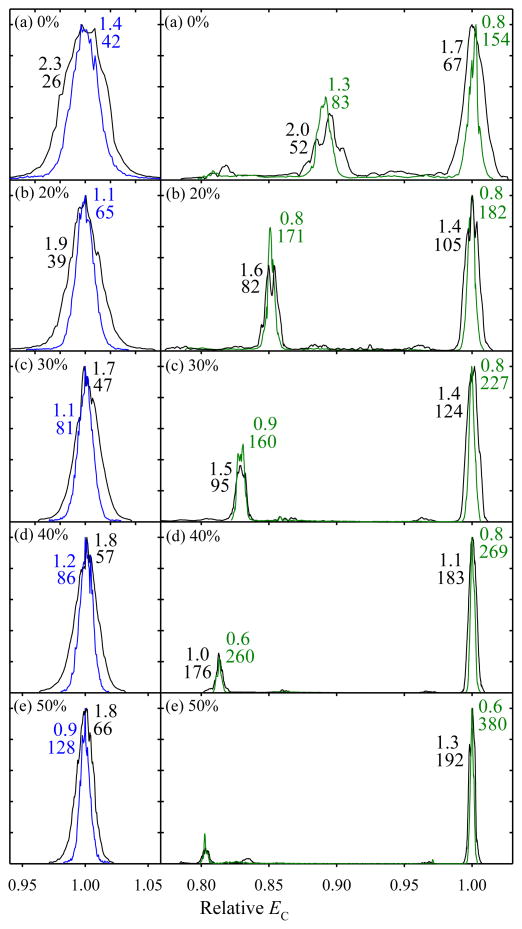
The behavior of for Bk2+ in FAIMS is rare and perhaps related to its peculiar zwitterion properties due to the basic guanidino groups in the arginines at C and N termini.25,38–41 Competition between zwitterion (salt-bridge) and other (canonical) structures may increase conformational diversity, and H/D exchange studies have found two distinct populations39,40 (though a priori optimization produced a zwitterion global minimum with canonical isomers at substantially higher energy).41 Many other peptides exhibited a single major peak at any DV and/or He content up to the possible maxima,24,25 evidently tolerating the heat for at least 0.2 s. This was the case for common standards syntide 2 (St) and angiotensin, which produced intense well-defined peaks for z = 2 and 3 adopted to benchmark the resolving power for peptides.24,25,37 The spectra for St2+ and St3+ with t = 0.5 s resemble those with 0.2 s, but all peaks narrow at any gas composition (Fig. 3). At DV = 5.4 kV, the mean resolution gain for the features marked in Fig. 3 is 69% for 2+ ions and 80% for 3+ ions, again slightly exceeding the estimate of 58% from the t1/2 scaling. At 50% He (Fig. 3e), the apparent R for the major 3+ peak is 380. Based on 10 consecutive replicates (Fig. S2 a), this peak has (at 95% confidence) w = 0.742 ± 0.052 V/cm and R = 328 ± 23, the greatest resolving power achieved in FAIMS. The difference between this value and 380 from a single spectrum points to the need for oft-omitted statistical validation of the resolution claims in IMS and FAIMS studies.
Fig. 3.
Spectra for syntide 2 ions at {DV = 5.4 kV; 0 – 50% He} as labeled, with Q = 2 L/min (black) and 0.8 L/min (blue for 2+ and green for 3+ ions). The widths (V/cm) and R values underneath are given for the major well-shaped peaks. For visual inspection, all spectra were slightly shifted to match the peak positions measured in Ref. [25]. The comparison at {DV = 4 kV; 0 – 75% He} was similar.
With t = 0.2 s, the resolving power for multiply-charged peptides at {DV = 5.4 kV; 50% He} exceeded25 that at {DV = 4 kV; 75% He} by ~20 – 25%. With t = 0.5 s here, the same St3+ feature at {DV = 4 kV; 75% He} has w = 0.584 ± 0.048 V/cm and R = 277 ± 23, based on 12 replicates (Fig. S2 b). Thus, the resolution edge of higher DV with lower He content persists with extended separation. The minor St3+ peak has identical width (w = 0.576 ± 0.028 V/cm based on 15 replicates, Fig. S2 c), supporting the notion that these peaks correspond to single ion geometries and therefore the measured width is due to instrumental resolution. Over a 1-hr. period, the standard deviation of peak position from the mean (Fig. S2 b) was 0.15 V/cm or 0.09%, which is statistically the same as 0.08% with24 t = 0.2 s. Hence reducing the gas flow to 0.8 L/min did not affect the FAIMS operational stability and reproducibility.
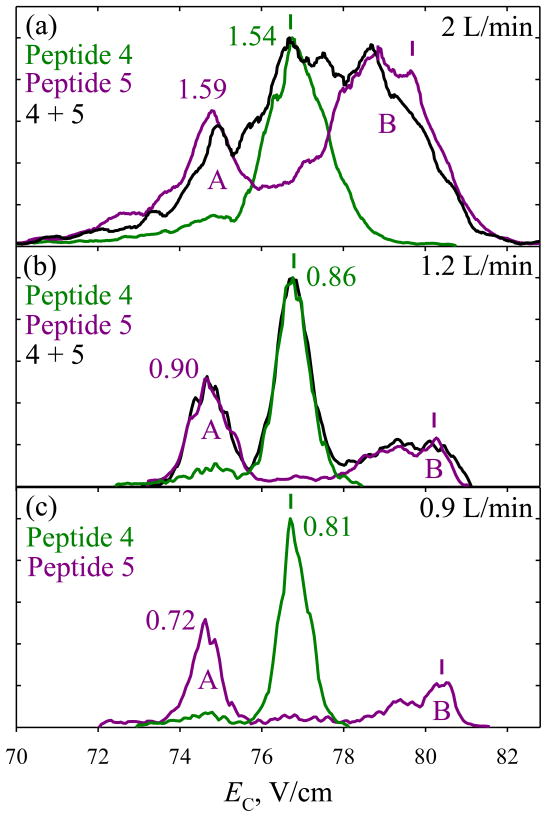
The resolution advantage of longer separation benefits both targeted and global analyses. In particular, a topical proteomic problem of separating and identifying the localization variants of modified peptides has challenged both chromatography (because of co-elution)42 and tandem MS (because of non-unique fragmentation for three or more candidate isomers).43 Such variants for singly and doubly phosphorylated peptides were recently resolved by FAIMS,27 but some only in part. For example,27 APLpSFRGPpSLPKSYVK (4) and APLpSFRGPSLPKpSYVK (5) were separated almost fully for z = 3, while, for 2+ ions, 5 could be filtered away from 4, but not vice versa (Fig. 4a). Increasing t to ~0.33 s narrows the features for both peptides by ~1.8 times, and (4) can be purified from (5) to >95% at the peak apex (Fig. 4b). Further extension to t ~0.44 s narrows the features by another ~10 – 20%, with similar separation quality (Fig. 4c). For (5), extending the separation raises the intensity of conformers (A) relative to that of (B): the more compact geometries at higher EC apparently unfold, as we discussed for bradykinin.
Fig. 4.
Spectra for 2+ ions of peptides 4, 5, and their ~1:1 mixture measured (a) in Ref. [27] and (b, c) presently. The mixture was not analyzed in (c), and the spectrum for 5 was scaled to the relative height found in (b). The widths (V/cm) are shown for the well-shaped peaks. The CVs for optimum filtering of each variant are marked by colored vertical bars.
Extending the separation from 0.2 to 0.4 – 0.5 s has diminished the signal for syntide 2 and phosphopeptide ions by order of magnitude, with some variation depending on the species and charge state. This is caused by both ion elimination upon unfolding and further diffusional losses during longer ion residence in the gap. The rectangular ion beam in the gap must also widen laterally over longer t, increasing losses when it exits the FAIMS unit and impinges on the face of (circular) MS inlet capillary. Hence slit-aperture MS inlets19,44 may be particularly beneficial with extended FAIMS analyses.
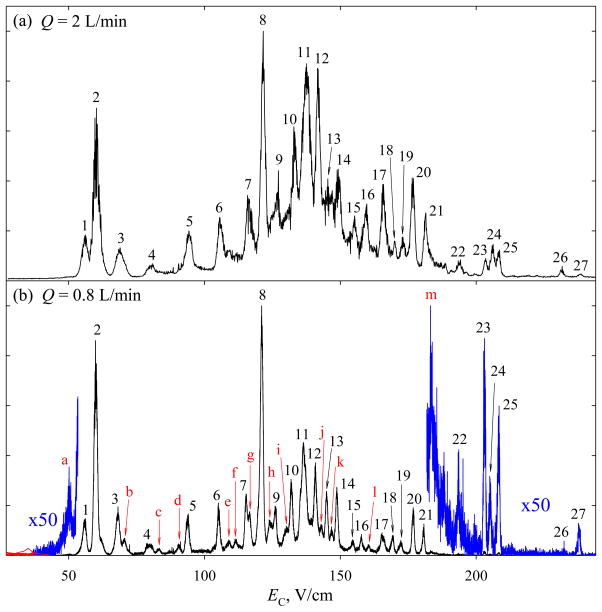
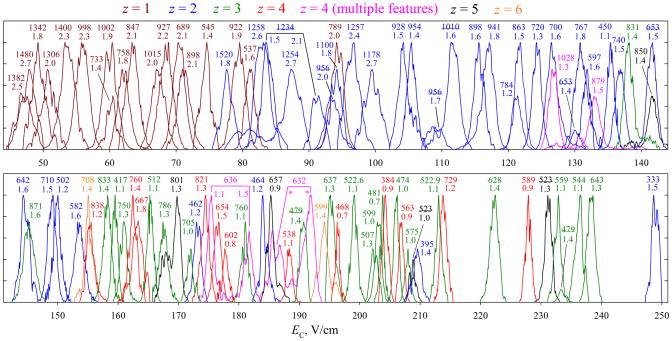
The metric of separation power for complex mixtures is peak capacity (pc), defined as the separation space divided by the average peak width. The pc of FAIMS in various regimes was benchmarked for the BSA digest.24 With t = 0.2 s at {DV = 4 kV; 75% He}, we reported24 pc ~110 using this unit. The spectrum at {DV = 5.4 kV; 50% He} is overall similar (Fig. 5a) with EC values generally increasing for higher z and smaller ions of each z (Fig. 6), but the order of many peaks differs. Previously,24 the highest EC were measured for 3+ ions with m/z = 575 and 474. Here, those lie at 206 – 208 V/cm, while the spectrum continues to ~250 V/cm. This is a consequence of transmission of high-EC ions to MS being inadvertently suppressed in earlier work24 by insufficient potential on the FAIMS unit. Raising that potential has opened a new part of the spectrum populated by smaller multiply charged species (Fig. 6). The mean w values for ions with z = 1, 2, 3, and 4 – 6 are 2.0, ~1.65, 1.2, and 1.2 V/cm, respectively. The trend of peaks narrowing from z = 1 to 2 to 3 but flat for z = 3 – 6 tracks that24 at DV = 4 kV, where the corresponding widths were 1.2, 1.0, and 0.8 V/cm for z = 1, 2, and ≥3. Here, the peaks are broader by ~50 – 65% because of smaller ion mobility at lower He content.24,25 For the spectrum truncated at EC = 210 V/cm to compare with that24 at DV = 4 kV, the average width of all (~90) peaks is 1.5 V/cm and thus pc is same ~110. One may expect a ~20% increase of resolving power achieved25 at DV = 5.4 KV for syntide 2 and angiotensin to translate into peak capacity gain for digest separations, but perhaps that increase is not representative of tryptic peptides. The peak capacity is ~140 overall, and ~120 for multiply-charged peptides that are often selected for proteomic analyses.24 This performance was reproduced at DV = 4 kV with proper FAIMS unit biasing.
Fig. 5.
The FAIMS spectrum (total ion count) for BSA digest measured with the “standard” (a) and extended (b) separation times. The resolved peaks are numbered in (a) and the corresponding peaks are labeled by same numbers in (b), the features newly resolved in (b) are marked by red letters.
Fig. 6.
FAIMS spectra for selected ions with t = 0.2 s, extracted from the data in Fig. 5a (the lower panel continues the upper one). The features are colored according to the charge state as shown, each labeled by the m/z value with, where possible, the peak width (V/cm) underneath. Underlined labels indicate species with multiple separated conformers. The species graphed are not necessarily the most intense ones, but were chosen to illustrate the peak capacity and represent the diversity of ion masses and charge states. Some peaks were scaled to 3/4 or 1/2 height for picture clarity, regardless of the real intensity.
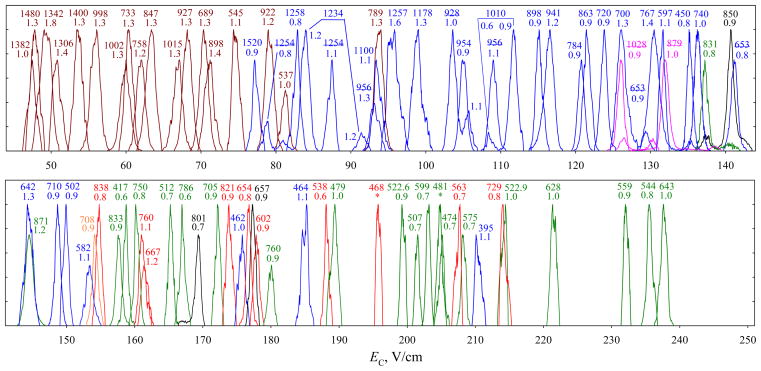
Extending the separation to ~0.5 s raises the number of peaks resolved in the FAIMS-only spectrum by ~50%, from 27 to 40 (Fig. 5b). This gain is confirmed by the data for mass-selected features (Fig. 7), where the mean w values for z = 1, 2, 3, and ≥4 drop to, respectively, 1.3, ~1.05, ~0.85, and ~0.85 V/cm. This means the resolving power increasing by ~60% for z = 1 and 2 and ~40% for z ≥ 3, versus 58% estimated from the t1/2 scaling. A smaller gain for higher-charged peptides may reflect instrumental limitations on the minimum peak width (e.g., due to variation of DV and/or CV during the peak acquisition, discrete CV step in the scan, or finite scan speed) that matter more for narrower peaks. The absolute R values reach ~30 – 80 for z = 1, ~60 – 190 for z = 2, ~120 – 300 for z = 3, and ~130 – 320 for z ≥ 4, overall increasing for lighter ions within each charge state. This reflects that heavier peptides are (i) generally less mobile, leading to lower FAIMS resolving power5,30 and (ii) more likely to feature unresolved conformers that broaden the peaks. As for the phosphopeptide 5 (Fig. 4), conformers for some species are separated better. In particular, for 2+ ions, a shoulder on the right side of the feature at m/z = 928 (Fig. 6) turns into a well-resolved peak in Fig. 7, and the merged features at m/z = 1010, 1234 (left peak), and 1254 become baseline-resolved. The 4+ ions at m/z of 632 and 636 were significant with t = 0.2 s (Fig. 6), but not with t = 0.5 s (Fig. 7). These species exhibited major unfolding at shorter t, and were likely removed from the gap by continued isomerization over the longer time. The average peak width in Fig. 7 is 1.0 V/cm, producing pc ~200 for all ions and ~170 for multiply-charged ones. This is the greatest peak capacity demonstrated for peptide separations using any ion mobility method.
Fig. 7.
Same as Fig. 6 with t = 0.5 s, from the data in Fig. 5b. Several species (with low m/z and high EC) seen in Fig. 6 are missing because low signal prevented accurate peak determination. These high-mobility ions are disproportionally depleted over longer residence in the gap.
Conclusions
Use of elevated electric fields25 and heteromolecular gas buffers such as vapor-containing45 and helium-rich24 mixtures has recently raised the resolving power of differential ion mobility spectrometry (FAIMS) by an order of magnitude, to ~200 for multiply charged peptides.24,25 Further increases of field intensity or He content in existing devices are precluded by electrical breakdown. However, the resolving power of FAIMS using homogeneous electric field in planar gaps scales as the square root of ion residence time (t), and the resolution can be improved (in principle, infinitely) by extending the filtering process. This fundamentally differs from the conventional drift-tube IMS, where the resolving power scales as the square root of separation voltage and cannot be increased by simply protracting the separation at a fixed voltage.
The time t is readily controlled by adjusting the flow of carrier gas, Q. Here, we extended t from the previous maximum of 0.2 s up to ~0.8 s by decreasing Q from 2 L/min to 0.5 L/min - the minimum set by suction into the mass-spectrometer following the FAIMS unit. As expected, the resolving power has improved across all gas compositions by up to twofold, reaching >300 for multiply-charged peptides. This gain has allowed resolving isomers not separated with t = 0.2 s, including some peptide conformers and localization variants of phosphopeptides. The separation peak capacity for tryptic digests, benchmarked using the customary BSA digest, has increased to ~200. The value would be even higher for complex proteome digests, which comprise a much greater number and diversity of peptides and thus cover a larger separation space.24 A re-design of the FAIMS inlet and FAIMS/MS interface should permit operation with Q < 0.5 L/min, leading to yet higher resolution.
The “cyclotron IMS” approach,46 where the voltages are dynamically switched as ions race a closed loop, is now breaking47 the record of ~200 for resolving power of conventional IMS that held since 1990-s.21,48,49 Historically, IMS methods were deemed “low-resolution” with R ~ 10 – 50 and “high-resolution” with R ~ 80 – 200. Then the new techniques enabling the resolving power beyond 200 for either conventional IMS or FAIMS could be viewed as ultra-high resolution ion mobility spectrometry.
Supplementary Material
Fig. S1. Consecutive replicates of the protonated reserpine ion peak measured at {DV = 4 kV; 75% He} using Q = 0.7 L/min (half of the 24-peak sequence is shown).
Fig. S2. Consecutive replicates of the peaks for 3+ ions of Syntide 2 measured using Q = 0.8 L/min: (a, b) the high-EC peak at (a) {DV = 5.4 kV; 50% He} and (b) {DV = 4 kV; 75% He}; (c) the low-EC peak under the conditions (b).
Acknowledgments
We thank Ron Moore, Therese Clauss, Dr. Keqi Tang, and Dr. Matt Monroe for aid in the experiments and data analysis, and Dr. Andrew Creese and Prof. Helen Cooper (Univ. of Birmingham, UK) for sharing the phosphopeptide samples. Portions of this research were supported by Battelle and NIH NCRR (grant RR18522 to RDS). The work was performed in the Environmental Molecular Sciences Laboratory, a DoE-BER user facility at PNNL.
References
- 1.Siuzdak G. The Expanding Role of Mass Spectrometry in Biotechnology. MCC Press; 2006. [Google Scholar]
- 2.Ardrey RE. Liquid Chromatography - Mass Spectrometry: an Introduction. Wiley; NY: 2003. [Google Scholar]
- 3.Schmitt-Kopplin P. Capillary Electrophoresis: Methods and Protocols. Humana Press; 2008. [DOI] [PubMed] [Google Scholar]
- 4.Eiceman GA, Karpas Z. Ion Mobility Spectrometry. CRC Press; Boca Raton, FL: 2005. [Google Scholar]
- 5.Shvartsburg AA. Differential Ion Mobility Spectrometry. CRC Press; Boca Raton, FL: 2008. [Google Scholar]
- 6.Fernandez-Lima FA, Becker C, McKenna AM, Rodgers RP, Marshall AG, Russell DH. Anal Chem. 2009;81:9941–9947. doi: 10.1021/ac901594f. [DOI] [PubMed] [Google Scholar]
- 7.Myung S, Lee YL, Moon MH, Taraszka JA, Sowell R, Koeniger SL, Hilderbrand AE, Valentine SJ, Cherbas L, Cherbas P, Kaufmann TC, Miller DF, Mechref Y, Novotny MV, Ewing M, Clemmer DE. Anal Chem. 2003;75:5137–5145. doi: 10.1021/ac030107f. [DOI] [PubMed] [Google Scholar]
- 8.Ruotolo BT, Giles K, Campuzano I, Sandercock AM, Bateman RH, Robinson CV. Science. 2005;310:1658–1661. doi: 10.1126/science.1120177. [DOI] [PubMed] [Google Scholar]
- 9.Baker EA, Livesay EA, Orton DJ, Moore RJ, Danielson WF, Prior DC, Ibrahim YM, LaMarche BL, Mayampurath AM, Schepmoes AA, Hopkins DF, Tang K, Smith RD, Belov ME. J Prot Res. 2010;9:997–1006. doi: 10.1021/pr900888b. [DOI] [PMC free article] [PubMed] [Google Scholar]
- 10.Guevremont R. J Chromatogr A. 2004;1058:3–19. [PubMed] [Google Scholar]
- 11.McCooeye M, Ding L, Gardner GJ, Fraser CA, Lam J, Sturgeon RE, Mester Z. Anal Chem. 2003;75:2538–2542. doi: 10.1021/ac0342020. [DOI] [PubMed] [Google Scholar]
- 12.Canterbury JD, Yi X, Hoopmann MR, MacCoss MJ. Anal Chem. 2008;80:6888–6897. doi: 10.1021/ac8004988. [DOI] [PMC free article] [PubMed] [Google Scholar]
- 13.Saba J, Bonneil E, Pomies C, Eng K, Thibault P. J Proteome Res. 2009;8:3355–3366. doi: 10.1021/pr801106a. [DOI] [PubMed] [Google Scholar]
- 14.Tang K, Li F, Shvartsburg AA, Strittmatter EF, Smith RD. Anal Chem. 2005;77:6381–6388. doi: 10.1021/ac050871x. [DOI] [PMC free article] [PubMed] [Google Scholar]
- 15.Shvartsburg AA, Mashkevich SV, Smith RD. J Phys Chem A. 2006;110:2663–2673. doi: 10.1021/jp055349t. [DOI] [PMC free article] [PubMed] [Google Scholar]
- 16.Pringle SD, Giles K, Wildgoose JL, Williams JP, Slade SE, Thalassinos K, Bateman RH, Bowers MT, Scrivens JH. Int J Mass Spectrom. 2007;261:1–12. [Google Scholar]
- 17.Shvartsburg AA, Smith RD. Anal Chem. 2008;80:9689–9699. doi: 10.1021/ac8016295. [DOI] [PMC free article] [PubMed] [Google Scholar]
- 18.Labowsky M, de la Mora JF. J Aerosol Sci. 2006;37:340–362. [Google Scholar]
- 19.Shvartsburg AA, Li F, Tang K, Smith RD. Anal Chem. 2006;78:3706–3714. doi: 10.1021/ac052020v. [DOI] [PMC free article] [PubMed] [Google Scholar]
- 20.Shen Y, Zhao R, Berger SJ, Anderson GA, Rodriguez N, Smith RD. Anal Chem. 2002;74:4235–4249. doi: 10.1021/ac0202280. [DOI] [PubMed] [Google Scholar]
- 21.Srebalus CA, Li J, Marshall WS, Clemmer DE. Anal Chem. 1999;71:3918–3927. doi: 10.1021/ac9903757. [DOI] [PubMed] [Google Scholar]
- 22.Giles K, Gilbert T, Green M, Scott G. Proceedings of the 57th ASMS Conference; Philadelphia, PA. 2009. [Google Scholar]
- 23.Rus J, Moro D, Sillero JA, Royuela J, Casado A, Molinero FE, de la Mora JF. Int J Mass Spectrom. 2010;298:30–40. [Google Scholar]
- 24.Shvartsburg AA, Danielson WF, Smith RD. Anal Chem. 2010;82:2456–2462. doi: 10.1021/ac902852a. [DOI] [PMC free article] [PubMed] [Google Scholar]
- 25.Shvartsburg AA, Prior DC, Tang K, Smith RD. Anal Chem. 2010;82:7649–7655. doi: 10.1021/ac101413k. [DOI] [PMC free article] [PubMed] [Google Scholar]
- 26.Shvartsburg AA, Clemmer DE, Smith RD. Anal Chem. 2010;82:8047–8051. doi: 10.1021/ac101992d. [DOI] [PMC free article] [PubMed] [Google Scholar]
- 27.Shvartsburg AA, Creese AJ, Smith RD, Cooper HJ. Anal Chem. 2010;82:8327–8334. doi: 10.1021/ac101878a. [DOI] [PMC free article] [PubMed] [Google Scholar]
- 28.Meek JM, Craggs JD. Electrical Breakdown of Gases. Wiley; NY: 1978. [Google Scholar]
- 29.Shvartsburg AA, Smith RD, Wilks A, Koehl A, Ruiz-Alonso D, Boyle B. Anal Chem. 2009;81:6489–6495. doi: 10.1021/ac900892u. [DOI] [PMC free article] [PubMed] [Google Scholar]
- 30.Shvartsburg AA, Smith RD. J Am Soc Mass Spectrom. 2007;18:1672–1681. doi: 10.1016/j.jasms.2007.06.013. [DOI] [PubMed] [Google Scholar]
- 31.Page J, Tang K, Smith RD. Int J Mass Spectrom. 2007;265:244–250. [Google Scholar]
- 32.Li J, Taraszka JA, Counterman AE, Clemmer DE. Int J Mass Spectrom. 1999;185/186/187:37–47. [Google Scholar]
- 33.Shvartsburg AA, Li F, Tang K, Smith RD. Anal Chem. 2007;79:1523–1528. doi: 10.1021/ac061306c. [DOI] [PubMed] [Google Scholar]
- 34.Robinson EW, Shvartsburg AA, Tang K, Smith RD. Anal Chem. 2008;80:7508–7515. doi: 10.1021/ac800655d. [DOI] [PMC free article] [PubMed] [Google Scholar]
- 35.Purves RW, Barnett DA, Ells B, Guevremont R. J Am Soc Mass Spectrom. 2000;11:738–745. doi: 10.1016/S1044-0305(00)00136-7. [DOI] [PubMed] [Google Scholar]
- 36.Shvartsburg AA, Li F, Tang K, Smith RD. Anal Chem. 2006;78:3304–3315. doi: 10.1021/ac060283z. [DOI] [PubMed] [Google Scholar]
- 37.Shvartsburg AA, Tang K, Smith RD. Anal Chem. 2010;82:32–35. doi: 10.1021/ac902133n. [DOI] [PMC free article] [PubMed] [Google Scholar]
- 38.Freitas MA, Marshall AG. Int J Mass Spectrom. 1999;182/183:221–231. [Google Scholar]
- 39.Schaaff TG, Stephenson JL, McLuckey SA. J Am Chem Soc. 1999;121:8907–8919. [Google Scholar]
- 40.Levy-Seri E, Koster G, Kogan A, Gutman K, Reuben BG, Lifshitz C. J Phys Chem A. 2001;105:5552–5559. [Google Scholar]
- 41.Rodriquez CF, Orlova G, Guo Y, Li X, Siu CK, Hopkinson AC, Siu KWM. J Phys Chem B. 2006;110:7528–7537. doi: 10.1021/jp046015r. [DOI] [PubMed] [Google Scholar]
- 42.Singer D, Kuhlmann J, Muschket M, Hoffman R. Anal Chem. 2010;82:6409–6414. doi: 10.1021/ac100473k. [DOI] [PubMed] [Google Scholar]
- 43.Sweet SMM, Bailey CM, Cunningham DL, Heath JK, Cooper HJ. Mol Cell Proteomics. 2009;8:904–912. doi: 10.1074/mcp.M800451-MCP200. [DOI] [PMC free article] [PubMed] [Google Scholar]
- 44.Mabrouki R, Kelly RT, Prior DC, Shvartsburg AA, Tang K, Smith RD. J Am Soc Mass Spectrom. 2009;20:1768–1774. doi: 10.1016/j.jasms.2009.05.019. [DOI] [PMC free article] [PubMed] [Google Scholar]
- 45.Rorrer LC, Yost RA. Int J Mass Spectrom. doi: 10.1016/j.ijms.2010.04.002. [DOI] [Google Scholar]
- 46.Merenbloom SI, Glaskin RS, Henson ZB, Clemmer DE. Anal Chem. 2009;81:1482–1487. doi: 10.1021/ac801880a. [DOI] [PMC free article] [PubMed] [Google Scholar]
- 47.Glaskin RS, Valentine SJ, Clemmer DE. Anal Chem. 2010;82:8266–8271. doi: 10.1021/ac1017474. [DOI] [PubMed] [Google Scholar]
- 48.Dugourd P, Hudgins RR, Clemmer DE, Jarrold MF. Rev Sci Instrum. 1997;68:1122–1129. [Google Scholar]
- 49.Asbury GR, Hill HH. J Microcol Sep. 2000;12:172–178. [Google Scholar]
Associated Data
This section collects any data citations, data availability statements, or supplementary materials included in this article.
Supplementary Materials
Fig. S1. Consecutive replicates of the protonated reserpine ion peak measured at {DV = 4 kV; 75% He} using Q = 0.7 L/min (half of the 24-peak sequence is shown).
Fig. S2. Consecutive replicates of the peaks for 3+ ions of Syntide 2 measured using Q = 0.8 L/min: (a, b) the high-EC peak at (a) {DV = 5.4 kV; 50% He} and (b) {DV = 4 kV; 75% He}; (c) the low-EC peak under the conditions (b).


