

Abstract
BACKGROUND AND PURPOSE
Glutamate-induced oxidative stress plays a critical role in the induction of neuronal cell death in a number of disease states. We sought to determine the role of the c-Jun NH2-terminal kinase (JNK)-p53-growth arrest and DNA damage-inducible gene (GADD) 45α apoptotic cascade in mediating glutamate-induced oxidative cytotoxicity in hippocampal neuronal cells.
EXPERIMENTAL APPROACH
HT22 cells, a mouse hippocampal neuronal cell line, were treated with glutamate to induce oxidative stress in vitro. Kainic acid-induced oxidative damage to the hippocampus in rats was used as an in vivo model. The signalling molecules along the JNK-p53-GADD45α cascade were probed with various means to determine their contributions to oxidative neurotoxicity.
KEY RESULTS
Treatment of HT22 cells with glutamate increased the mRNA and protein levels of GADD45α, and these increases were suppressed by p53 knock-down. Knock-down of either p53 or GADD45α also prevented glutamate-induced cell death. Glutamate-induced p53 activation was preceded by accumulation of reactive oxygen species, and co-treatment with N-acetyl-cysteine prevented glutamate-induced p53 activation and GADD45α expression. Knock-down of MKK4 or JNK, or the presence of SP600125 (a JNK inhibitor), each inhibited glutamate-induced p53 activation and GADD45α expression. In addition, we also confirmed the involvement of GADD45α in mediating kainic acid-induced hippocampal oxidative neurotoxicity in vivo.
CONCLUSIONS AND IMPLICATIONS
Activation of the JNK-p53-GADD45α cascade played a critical role in mediating oxidative cytotoxicity in hippocampal neurons. Pharmacological inhibition of this signalling cascade may provide an effective strategy for neuroprotection.
Keywords: glutamate, oxidative cytotoxicity, hippocampal neuronal cells, JNK-p53-GADD45α apoptotic cascade
Introduction
Oxidative stress is commonly referred to as an imbalance between the cellular biochemical processes that produce reactive oxygen species (ROS) and those that remove them (Harman, 1981; Sayre et al., 2008). Research over the past few decades has led to the general conclusion that there is a widespread involvement of oxidative stress in the aetiology of neurodegenerative diseases (see Floyd, 1999; Andersen, 2004; Sayre et al., 2008). For instance, many clinical studies have shown that increased levels of oxidative stress markers often can be found in human brain tissues during disease progression or in affected brain regions at autopsy. Neuronal oxidative stress can be caused by a variety of different cellular mechanisms (Sayre et al., 2001). Glutamate, an excitatory neurotransmitter in the central nervous system, is highly neurotoxic when present at abnormally high concentrations, partly via the induction of cellular oxidative stress. Glutamate-induced oxidative stress and neuronal death is believed to be an important contributing factor in the development of a number of neurodegenerative diseases (including Alzheimer's disease), occurring before the onset of significant pathology and clinical symptoms (Coyle and Puttfarcken, 1993; Smith et al., 1994; Nunomura et al., 2001). Glutamate can induce oxidative stress and cytotoxicity via two different pathways, that is, the receptor-mediated excitotoxicity and the non-receptor-mediated oxidative cytotoxicity (Choi, 1990; Coyle and Puttfarcken, 1993; Tan et al., 1998). In the former case, glutamate induces excitotoxicity via activation of the ionotropic glutamate receptors, which results in transient Ca2+ fluxes, increased levels of ROS and ultimately cell death. In the latter case, glutamate induces oxidative stress by inhibiting a glutamate-cystine antiporter and subsequently promoting cystine efflux and/or blockade of cystine uptake. This results in the loss of intracellular glutathione and accumulation of intracellular ROS, and ultimately, oxidative cell death (Murphy and Miller, 1989; Pereira et al., 1997). Glutamate-induced oxidative cytotoxicity has been described in neuronal cell lines (Murphy and Miller, 1989; Froissard and Duval, 1994), primary neuronal cultures (Erdöet al., 1990) and oligodendrocytes (Oka et al., 1993).
The growth arrest and DNA damage-inducible gene 45α (GADD45α) encodes an inducible nuclear protein that plays a critical role in the checkpoint control of cells in response to a wide spectrum of DNA damaging or stress signals (Zhan et al., 1994). GADD45α has been implicated in apoptosis, cell survival and immunity (Salvador et al., 2002). Currently, three GADD45 isoforms, namely, GADD45α, GADD45β and GADD45γ, have been identified. They have similar structural characteristics and expression patterns in response to extracellular stimuli (Takekawa and Saito, 1998). GADD45α can interact directly with a number of cellular signalling proteins, such as the proliferating cell nuclear antigen (Smith et al., 1994), p21 (Kovalsky et al., 2001), histone (Carrier et al., 1999) and the MAP three kinase 1/MAP kinase kinase kinase 4 (MTK1/MEKK4) (Mita et al., 2002), a mitogen-activated protein kinase (MAPK) kinase that can activate c-Jun NH2-terminal kinase (JNK) and p38. GADD45α was originally identified as a gene whose expression is rapidly induced in response to unreplicated DNA or DNA damage in a p53-dependent manner (Kastan et al., 1992). p53 is a transcription factor that can activate the transcription of many target genes in the presence of DNA damage, such as p21, gadd45 and mdm2 (Harper et al., 1993). Other transcription factors that may contribute to a p53-independent regulation of GADD45α include FoxO3a (Tran et al., 2002), Oct1 (Takahashi et al., 2001), C/EBPα (Tao and Umek, 1999) and Egr1 (Thyss et al., 2005).
It is not known whether the p53-GADD45α signalling pathway is also involved in the development of oxidative neuronal toxicity, and this is the focus of our present study. A better understanding of the cellular and molecular signalling pathways that are activated during oxidative stress and neuronal death is of importance because these studies may reveal novel therapeutic targets for the prevention of oxidative stress and cell death, and ultimately, for the treatment and prevention of neurodegeneration. We found that ROS accumulation following treatment with glutamate results in JNK activation, p53 translocation into the nucleus, and subsequently, up-regulation of the transcription of the p53-response gene GADD45α. Detailed evidence is presented here to show that this signalling cascade is a principal mediator of oxidative neuronal death in cultured HT22 cells. In addition, using the kainic acid-induced oxidative damage in the hippocampus of rats as an in vivo model, we also provided evidence demonstrating that hippocampal GADD45α expression was involved in kainic acid-induced oxidative neurodegeneration and memory impairment.
Methods
Cell culture conditions and assay of cell viability
Glutamate-sensitive HT22 murine hippocampal neuronal cells were a gift from Dr David Schubert (Salk Institute, La Jolla, CA, USA). They were maintained in Dullbecco's modified Eagle's medium (DMEM) supplemented with 10% (v/v) fetal bovine serum and antibiotics (penicillin-streptomycin), and incubated at 37°C under 5% CO2. Cells were subcultured once every 2 days. Cells were seeded in 96-well plates at a density of 5000 cells per well, and were treated with glutamate for 24 h. The stock solution of glutamate (1 M in DMEM without serum) was diluted in the culture medium immediately before addition to each well at the desired final concentrations. For assessment of cell viability, the MTT assay was used. MTT (10 µL, 5 mg·mL−1) was added to each well at a final concentration of 500 µg·mL−1. The mixture was further incubated for 1 h and the liquid in the wells was removed thereafter. DMSO (100 µL) was then added to each well, and the absorbance was read with a UV max microplate reader (Molecular Device, Palo Alto, CA, USA) at 560 nm. The relative cell viability was expressed as percentage of the control cells that were not treated with glutamate.
Immunofluorescence microscopy
For histocytochemical analysis, cells were first washed three times with buffered saline (PBS) and fixed in 3% paraformaldehyde solution (3% paraformaldehyde, 0.1 mmol·L−1 CaCl2 and 0.1 mmol·L−1 MgCl2, pH 7.4, in PBS) for 10 min. Cells were then washed three times with PBS, permeabilized in 0.2% Triton® X-100/PBS for 5 min, and washed again three times with PBS. They were blocked with 10% normal goat serum (Jackson Immuno Research labs, West Grove, PA, USA) for 1 h, and washed with PBS. The GADD45α protein was detected using the GADD45α monoclonal antibody (1:75 dilution; Santa Cruz Biotechnology, Santa Cruz, CA, USA). The p53 and its phosphorylated (Ser15) form, p-p53, proteins were separately detected using polyclonal antibodies specific for each protein (1:100 dilution; Cell Signaling Technology, Beverly, MA, USA). The first antibodies were incubated for 24 h at 4°C, which was followed by multiple washes in PBS. The same procedures were repeated with a fluorescein isothiocyanate (FITC)-conjugated secondary antibody (1:200, Jackson Immuno Research labs). The nuclei were stained with Hoechst33342, and the coverslips were mounted on slides with Vectashield Mounting Medium (Vector Larboratories, Inc., Burlingame, CA, USA). Fluorescein images were captured using a confocal fluorescence microscope (AXIO, Carl Zeiss Corporation, Thornwood, NY, USA).
TUNEL assay
The ApopTag plus peroxidase in situ apoptosis detection kit was obtained from Chemicon (Temecula, CA, USA). After treatment with glutamate, cells were harvested by trypsinization and washed with PBS once. After centrifugation, cells were stained according to the protocols provided by the manufacturer. The in situ labelled nuclei were observed and photographed under a fluorescence microscope (AXIO, Carl Zeiss).
Flow cytometric analysis
After treatment with glutamate, cells were harvested by trypsinization and washed once with PBS (pH 7.4). After centrifugation, cells were stained with propidium iodide (PI) for analysis of cell cycles or annexin-V and PI using the annexin-V-FITC apoptosis detection kit (BD Bioscience, San Jose, CA, USA) for analysis of the translocation of phosphatidylserine from inner to outer leaflets of the plasma membrane. For cell cycle analysis, cells were resuspended in 1 mL of 0.9% NaCl, and 2.5 mL of ice-cold 90% ethanol was added. After incubation at room temperature for 30 min, cells were centrifuged and the supernatant was removed. Cells were resuspended in 1 mL PBS containing 50 µg·mL−1 PI and 100 µg·mL−1 ribonuclease A and incubated at 37°C for 30 min. After centrifugation, cells were resuspended in PBS. For annexin V-PI double staining, the procedure was performed according to manufacturers' protocols. Flow cytometric analyses were performed by using a flow cytometer (model BD LSR II, BD Bioscience).
Nuclear and cytoplasm extracts
For protein localization, the nuclear and cytosolic fractions were prepared using the cytosolic/nuclear fractionation kit obtained from Biovision Inc. (Mountain View, CA, USA), following the instructions of the manufacturer. Briefly, cells were suspended in hypotonic buffer and lysed with the proprietary detergent from the kit. Samples were centrifuged at 800×g for 10 min at 4°C. The supernatant was collected, centrifuged for 5 min at 16 000×g to remove any remaining nuclei, and then transferred to a new microtube (cytosolic protein fraction). The original pellet was resuspended in the nuclear extraction buffer and then incubated on ice for 40 min with occasional vortexing. After salt extraction, the nuclear pellet was centrifuged at 16 000×g for 10 min, and the supernatant was saved as the nuclear extract. Extracts were stored in aliquots in −80°C until use.
Western blotting
For Western blotting, cells were washed first, and then suspended in 100 µL of the lysis buffer (20 mmol·L−1 Tris-HCl, 150 mmol·L−1 NaCl, 1 mmol·L−1 EDTA, 1% Triton X-100, 10 mmol·L−1 NaF, 2 mmol·L−1 Na3VO4 and a protease inhibitor cocktail, pH 7.5). The amount of proteins was determined using the Bio-Rad protein assay (Bio-Rad, Hercules, CA, USA). An equal amount of proteins was loaded in each lane. The proteins were separated by 10% SDS-polyacrylamide gel electrophoresis and electrically transferred to a polyvinylidene difluoride membrane (Bio-Rad). After blocking the membrane using 5% skimmed milk, target proteins were immunodetected using specific antibodies. All primary antibodies were obtained from Cell Signaling Technology, except the anti-JNK1/2 phospho-specific antibody, which was obtained from Biosource (Camarillo, CA, USA). Thereafter, the horseradish peroxidase-conjugated anti-rabbit IgG was applied as the secondary antibody, and the positive bands were detected using Amersham ECL plus Western blotting detection reagents (GE Health care, Piscataway, NJ, USA).
Small-interfering RNA (siRNA)
The role of GADD45α, p53 and MAP kinase kinase 4 (MKK4) in mediating glutamate oxidative cytotoxicity was examined using GADD45α-siRNA (siGADD45α), p53-siRNA (sip53) and MKK4-siRNA (siMKK4) to selectively silence the GADD45α, p53 and MKK4 genes respectively. The siGADD45α (catalogue No. sc-35439), sip53 (catalogue No. sc-29436), siMKK4 (catalogue No. sc-35910) and siRNA negative control (catalogue No. sc-37007) were purchased from Santa Cruz Biotechnology. HT22 cells were seeded the night before transfection at a density of 30–50% confluence by the time of transfection. A total of 40 nmol of siGADD45α, sip53, siMKK4 and siRNA negative control was used for transfection using Lipofectamine 2000 (Invitrogen, San Diego, CA, USA) according to the manufacturer's instructions. Transfected cells were maintained in culture for 2 days before harvesting and further analyses. The efficiency of the siRNA knock-down was determined by Western blot analysis.
RNA isolation and cDNA synthesis
Total RNA was isolated using TRIzol (Invitrogen) from HT22 cells treated with 5 mmol·L−1 glutamate. cDNA was synthesized with random hexamers (PerkinElmer Life Sciences, Boston, MA, USA and Roche Applied science, Indianapolis, IN, USA) using Moloney murine leukaemia virus reverse transcriptase (PerkinElmer Life Sciences).
Real-time PCR
Real-time PCR was performed on a PE Biosystems ABI PRISM 7300 sequence detection system. In brief, quantitative RT-PCR was done with a CYBR green RT-PCR kit (Applied Biosystems, Foster City, CA). A 25-µL reaction contained 1× CYBR green reaction mix with 50 ng of primers and 1 µL cDNA from the reverse transcription. Forty cycles of PCR reactions were done with 30 s of denaturing at 95°C, 30 s of annealing at 60°C and 1 min of PCR reaction at 72°C. Primers used were GADD45α, forward (5′-CTGGAGGAAGTGCTCAGCAAGG-3′), GADD45α, reverse (5′-CTGATCCATGTAGCGACTTTCC-3′) and GAPDH, forward (5′-GGCACAGTCAAGGCCGAGAA-3′), GAPDH, reverse (5′-CAGCAATGCATCCTGCACCA-3′). Fold of induction of the expression was determined according to a published method (Livak and Schmittgen, 2001). Analysis of relative gene expression data using real-time quantitative PCR and the 2−ΔΔCT method. Briefly, the method involved obtaining the CT values for the GADD45α mRNA, normalizing to a house-keeping gene, GAPDH, and deriving the fold increase compared with the corresponding control cells.
ROS measurement
Reactive oxygen species in HT22 cells were detected using 2′, 7′-dichlorofluorescin diacetate (H2-DCF-DA, Molecular Probes, Eugene, OR). H2-DCF-DA is a non-polar compound that rapidly diffuses into cells, where it is hydrolysed to the fluorescent polar derivative DCF and trapped within the cells. Cells were treated with or without 5 mmol·L−1 glutamate for 8 h. Subsequently, 10 µmol·L−1 H2-DCF-DA was added to the cells. After incubation for 10 min at 37°C, the liquid was removed and then Hank's balanced salt solution buffer was added. Intracellular ROS accumulation was observed and photographed under a fluorescence microscope (AXIO, Carl Zeiss).
Treatment with kainic acid to induce neuronal damage in vivo
All animal care and experimental procedures were approved by the Institutional Animal Care and Use Committee of the University of Kansas Medical Center and strictly followed the guidelines for humane care of animals from the National Institutes of Health. Male Sprague-Dawley rats, weighing 250–270 g, were purchased from Harlan (Indianapolis, IN) and kept in a plastic bottomed cage with a 12-h light/12-h dark cycle, with controlled room temperature (at 25°C) and humidity (60%). They were allowed free access to laboratory pellet chow and water. After arrival, the animals were allowed to acclimatize to the new environment for 1 week before use in the experiment. Rats were randomly divided into various experimental groups (n= 5) with no significant difference in average body weights.
Kainic acid (1 µL of 1 µg·µL−1 solution) was injected into the left and right lateral ventricles (anterior/posterior, −1.0; rostral, ±1.6; dorsal/ventral, 4.5) using a microlitre syringe under anaesthesia with ketamine and xylazine (50 and 5 mg·kg−1, s.c.). The needle was withdrawn 4 min later and scalp was sutured. The control rats were injected with 1 µL of saline instead of kainic acid (He et al., 2006).
Y-maze test
Six days after i.c.v. injection of kainic acid or saline, memory impairment in rats were measured using the Y-maze test. The Y-maze is a three-arm maze with equal angles between all arms, which were 50 cm length and 10 cm width, with walls 20 cm high. The maze floor and walls were constructed from dark grey polyvinyl plastic. Rats were initially placed within one arm, and the sequence and number of arm entries were recorded manually. The percentage of triads with all three arms represented, that is, ABC, CAB or BCA, but not ABB, was recorded as an alternation to estimate the short-term memory. Arms were cleaned by using 70% ethanol between tests to remove odours and residues. The alternation score (%) for each rat was defined as the ratio of the actual number of alternations to the possible number (defined as the total number of arm entries minus two) multiplied by 100 as shown by the following equation: % of alternations =[(number of alternations)/(total arm entries − 2)]× 100 (Sarter et al., 1988). Investigators who performed the Y-maze test were unaware of the different treatments.
Immunohistochemistry staining
At the end of the experiment, the animals were anaesthetized with ketamine and xylazine (50 and 5 mg·kg−1, s.c.) and then perfused with 0.1 M neutral phosphate-buffered 10% formalin (containing a final concentration of 4% formaldehyde) via the abdominal aorta. Brain tissues were removed and postfixed overnight in the same fixative solution (0.1 M neutral phosphate-buffered 10% formalin). After cryoprotection in 30% sucrose/phosphate buffer, the tissues were frozen in liquid nitrogen and sectioned serially (30 µm) through the entire brain. The sections were collected in 0.1 M neutral phosphate buffer, mounted on slides, then air-dried on a slide warmer at 50°C for at least half an hour, and stained with haematoxylin and eosin for histopathological analysis. Three brain regions at the level of bregma −3.6 mm according to anatomical locations defined in a rat brain atlas were examined bilaterally (Paxinos and Watson, 1997): CA1, CA3 and the dentate gyrus of the hippocampus. Fluoro-Jade B staining was performed by following the protocols described by Schmued and Hopkins (2000) with minor modifications. Briefly, the slides were transferred to a solution of 0.06% potassium permanganate for 10 min, preferably on a shaker table to ensure consistent background suppression between sections. The staining solution was prepared from a 0.01% (w·v−1) stock solution of Fluoro-Jade B in distilled water. After 20 min in the staining solution, the slides were rinsed and placed on a slide warmer until they were fully dry. Cell counts were performed using grid morphometric techniques under low- and high-power magnification fields. The cell bodies of the Fluoro-Jade B-positive neurons were viewed under a fluorescence microscope. The number of stained neurons in the images was counted using the Axiovision image analysis software (Carl Zeiss, Inc., Thornwood, NY, USA). For analysis of the hippocampus, the total number of stained neurons was counted in the dorsal hippocampal region (between −1.5 and −2.5 mm from bregma) by using three sections from each rat. For the detection of GADD45α in rat brain tissues, tissue sections were incubated successively with mouse monoclonal anti-GADD45α antibody (1:50, Santa Cruz Biotechnology), goat-biotinylated-conjugated polyclonal anti-mouse antibody (1:200, Vector Laboratories), and horseradish-peroxidase conjugated avidin-biotin complex (Vector Laboratories). Sections were then exposed to a 3,3′-daminobenzidine substrate kit (Vector Laboratories).
Statistical analysis
Results were expressed as mean ± SD. The statistical significance was determined by analysis of variance (anova) followed by a multiple comparison test with a Bonferroni correction. P-values of less than 0.05 or 0.01 were considered statistically significant or very significant respectively.
Materials
Glutamate, glutamic acid and fetal bovine serum were obtained from Sigma (St. Louis, MO, USA). Pifithrin-α (PFT-α) was obtained from Calbiochem (San Diego, CA, USA). DMEM was obtained from Life Technology (Rockville, MD, USA). The antibiotics solution containing 10 000 U·mL−1 penicillin and 10 mg·mL−1 streptomycin was obtained from Invitrogen (Carlsbad, CA), and trypsin-versene mixture (containing 0.25% trypsin and 0.02% EDTA) from Lonza Walkersville (Walkersville, MD, USA). The names of drugs and molecular targets used here follow Alexander et al. (2009).
Results
Glutamate induces GADD45α expression in HT22 cells
Exposure to 3–10 mmol·L−1 glutamate for 24 h induced cytotoxicity in cultured HT22 neuronal cells in a concentration-dependent manner (data not shown), which confirmed earlier observations (Davis and Maher, 1994). Next, we determined the regulation of GADD45α gene expression and its protein levels during glutamate-induced oxidative cytotoxicity. As shown in Figure. 1A,B, GADD45α mRNA and protein levels were increased in a time-dependent manner over the controls, with a maximal induction seen at 24 h after exposure to 5 mmol·L−1 glutamate. The time-dependent increase in GADD45α mRNA and protein levels paralleled the decrease in cell viability (Figure 1A, right panel).
Figure 1.
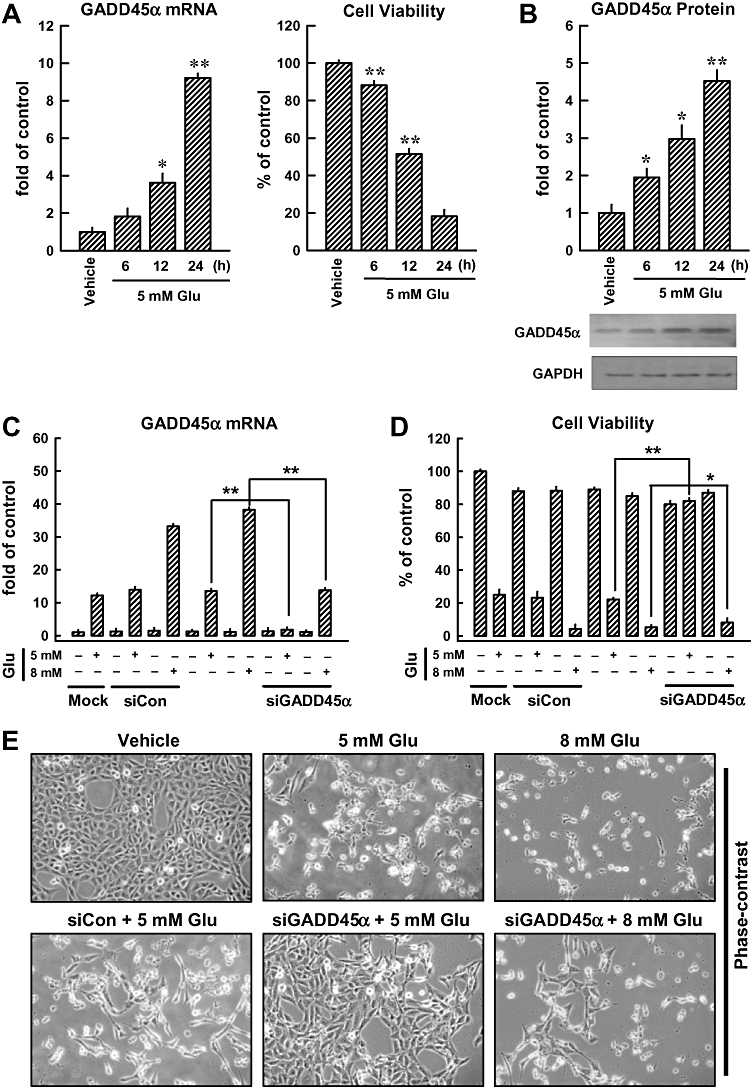
GADD45α contributes to glutamate-induced oxidative cytotoxicity in HT22 cells. After the HT22 cells were incubated with 5 mmol·L−1 glutamate for 6, 12 and 24 h, they were subjected to analysis of the GADD45α mRNA levels by real-time PCR (A, left panel) and GADD45α protein levels by Western blotting (B). The membrane was stripped for analysis of GAPDH, which was used as a loading control (B, lower panel). The relative GADD45α protein levels were determined by densitometric scanning and calculated by averaging the data obtained from three experiments (B, upper panel). Cell viability was measured using the MTT assay, and each value is the mean ± SD from three separate experiments (A, right panel). (C, D, E) Twenty-four hours after the HT22 cells were transfected with 40 nmol·L−1 GADD45α siRNA (siGADD45α), they were treated with 5 or 8 mmol·L−1 glutamate (Glu) for additional 24 h. Real-time PCR analysis was performed to determine GADD45α mRNA levels (C). Glutamate-induced GADD45α expression was compared with the mock transfection procedure (Lipofectamine only). Cell viability was measured using the MTT assay, and each value is a mean ± SD from three separate experiments (D). Representative photographs showing the morphological changes of the cells are presented in E. These photos were taken under a phase-contrast microscopy (original magnification, ×100). (F) Localization and relative intensity of the GADD45α protein in HT22 cells treated with 5 mmol·L−1 glutamate (immunofluorescence staining, original magnification at ×200). *P < 0.05; **P < 0.01, significantly different from vehicle.
Transfection with GADD45α-specific siRNA almost abolished GADD45α gene expression induced by 5 mmol·L−1 glutamate and, concomitantly, the cell viability was also strongly protected (Figure 1C,D). In comparison, GADD45α siRNA only partially suppressed GADD45α expression induced by a very high concentration (8 mmol·L−1) of glutamate (causing >90% loss of cell viability), and consequently, it also did not appreciably protect glutamate-induced cell death (Figure 1E). Based on this observation, the 5 mmol·L−1 glutamate concentration was used for subsequent experiments designed to probe the role of GADD45α in glutamate-induced oxidative stress in HT22 cells.
Immunocytochemical analysis showed that the GADD45α protein was basically undetectable in untreated cells (Figure 1F, top panels), but a marked elevation of this protein was seen in cells treated with glutamate (Figure 1F, middle panels). As expected, transfection with GADD45α siRNA diminished the induction of GADD45α protein following exposure to 5 mmol·L−1 glutamate (Figure 1F, bottom panels). These results suggested that GADD45α was involved in regulating glutamate-induced cell death in HT22 cells.
Glutamate-induced neuronal cell death is associated with p53 activation
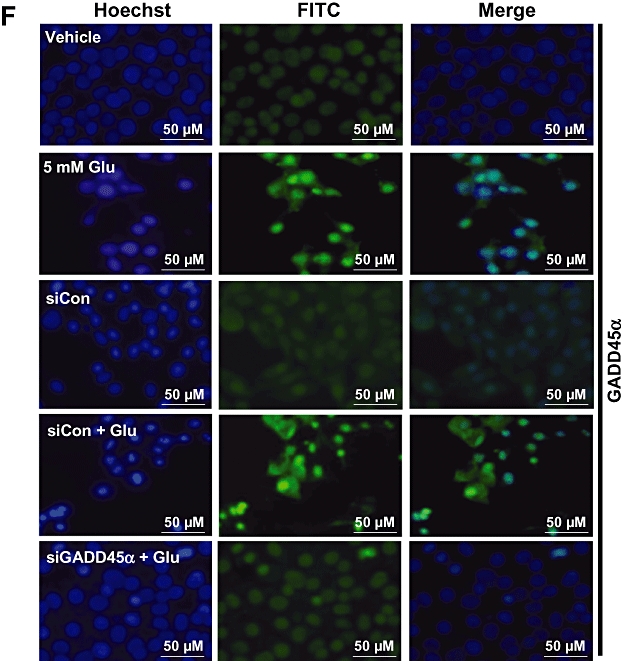
It is known that often p53 is activated in response to oxidative stress, resulting in transcriptional up-regulation of GADD45α. Hence, we further examined the role of p53 in glutamate-induced cell death. Phosphorylation of p53 at Ser15 was rapidly and continuously elevated during the time tested (at 3–24 h after glutamate treatment) (Figure 2A), although the level of its mRNA was not significantly changed (data not shown). These observations suggest that p53 expression was not significantly altered. Next, we examined whether the phospho-p53 (Ser15) was translocated to the nucleus, using immunofluorescence microscopy analysis. Clearly, there was an increase in p53 nuclear translocation from the cytoplasmic compartment (Figure 2B). Over 80% of the cells displayed p53 nuclear translocation at 24 h after glutamate exposure (Figure 2B, ii). As a positive control, HT22 cells were also treated with doxorubicin (at 0.2 µg·mL−1), an established stimulator of p53 activation and nuclear translocation (Figure 2B, iii). Transfection with p53 siRNA suppressed the induction of p53 protein following glutamate treatment (Figure 2B, v), whereas transfection with the negative control siRNA did not alter the effect of glutamate (Figure 2B, iv). These observations were further corroborated with the levels of phospho-p53 and p53 in the cytosolic and nuclear extracts (Figure 2C). In addition, transfection with p53 siRNA inhibited the up-regulation of p53 and p-p53 (Ser15) following glutamate exposure, whereas transfection with the negative control siRNA did not appreciably modulate the effects of glutamate (Figure 2D).
Figure 2.
Glutamate induces p53 activation in HT22 cells. (A) HT22 cells were incubated with 5 mmol·L−1 glutamate for the indicated length of time. Whole cell extracts were examined by Western blotting using the anti-phospho-p53 (Ser15) and anti-p53 antibodies. (B –i, ii) Subcellular localization of phospho-p53 (Ser15) in the control and glutamate-treated HT22 cells using immunofluorescence staining. (B –iii) Nuclear localization of phospho-p53 (Ser15) after exposure of cells to doxorubicin (DOX). (B –iv, v) Cells were transfected with p53 siRNA (sip53) or control siRNA (siCon), and 24 h later, they were exposed to 5 mmol·L−1 glutamate for additional 24 h. They were then analysed for immunofluorescence staining of phospho-p53 (Ser15). Data shown are representative of three independent experiments. (C) Subcellular localization of phospho-p53 (Ser15) and p53 in HT22 cells during glutamate-induced cell death. Cytosolic and nuclear extracts were prepared from glutamate-treated cells, and the phospho-p53 protein was analysed using Western blotting. Here DOX (at 2 µg·mL−1) was used as a positive control for p53 induction. (D) Cells were transfected with p53 siRNA (sip53) or control siRNA (siCon), and 24 h later cells were treated with 5 mmol·L−1 glutamate (Glu) for additional 24 h. Then the whole cell lysates were analysed for the levels of phospho-p53 (Ser15) and p53 by Western blotting. The relative protein levels were calculated according to their densitometry readings, which were then normalized according to the corresponding reading for GAPDH. The corresponding groups without glutamate treatment were arbitrarily set at 1.0. Each value is mean ± SD from three independent experiments.
GADD45α induction by glutamate is dependent on p53 activation
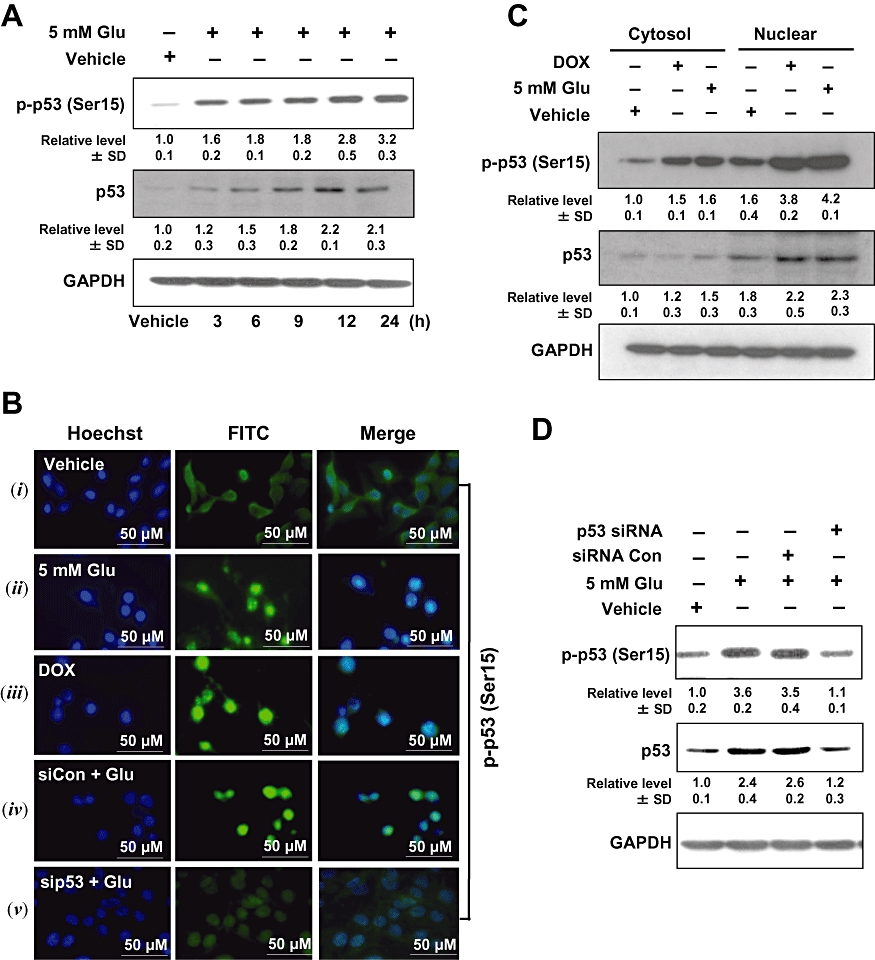
To elucidate whether p53 mediated the activation of GADD45α in response to glutamate, we transfected cells with p53 siRNA to knock-down p53 expression. As expected, p53-specific siRNA reduced the levels of GADD45α mRNA and prevented glutamate-induced loss of cell viability, while the negative control siRNA exerted no appreciable effect (Figure 3A, left and right panels). In addition, pretreatment of HT22 cells with 10 µmol·L−1 PFT-α (a chemical inhibitor of p53) for 1 h markedly reduced glutamate-induced GADD45α gene expression (Figure 3B). As shown in Figure 3C, knock-down of p53 led to a decrease in the protein levels of GADD45α (2.7 vs. 0.8-fold) and p53 (3.2 vs. 0.9-fold). Moreover, immunofluorescence staining showed that p53 knock-down prevented glutamate-induced GADD45α activation (Figure 3D). These results indicate that glutamate-induced GADD45α expression is dependent on p53 activity.
Figure 3.
Knock-down of p53 suppresses glutamate-induced GADD45α expression. (A, left panel) HT22 cells were transfected with either the negative control siRNA (siCon) or p53 siRNA (sip53), and 24 h later, cells were exposed to 5 mmol·L−1 glutamate for additional 24 h before analysis of the GADD45α mRNA level by real-time PCR. The method for quantifying the fold of increase in mRNA levels was described in Methods. Glutamate-induced GADD45α expression was compared with the mock transfection procedures (Lipofectamine only). (A, right panel) Cell viability was measured using the MTT assay. Each value is a mean ± SD from three separate experiments. (B) Cells were first pretreated for 1 h with 10 µmol·L−1 PFT-α and then exposed to 5 mmol·L−1 glutamate (Glu) for additional 24 h before analysis of GADD45α mRNA level by real-time PCR. (C, left panel) HT22 cells were transfected with either the negative control siRNA (siCon) or p53 siRNA (sip53), and 24 h later, cells were exposed to 5 mmol·L−1 glutamate (Glu) for additional 24 h before analysis of GADD45α and p53 protein levels by Western blotting. Glutamate-induced GADD45α expression was compared with the mock transfection procedure (Lipofectamine only). (C, right panel) The relative protein levels for GADD45α and p53 were calculated according to their densitometry readings, which were normalized according to the corresponding readings for the GAPDH protein bands. Each value is mean ± SD from three independent experiments. *P < 0.05; **P < 0.01. (D) Cells were transfected with the negative control siRNA (siCon) or p53 siRNA (sip53), and after 24 h, they were exposed to 5 mmol·L−1 glutamate for additional 24 h. They were then analysed for the immunofluorescence staining of GADD45α (original magnification, ×200).
To determine whether the p53-GADD45α signalling cascade participated in regulating glutamate-induced cell death, we examined the effects of p53 siRNA and GADD45α siRNA using flow cytometric analysis. Glutamate treatment increased the population of sub-G1 cells by 67%, but transfection with p53 siRNA or GADD45α siRNA, but not with the control siRNAs, markedly reduced these effects of glutamate (Figure 4A). Transfection with GADD45α siRNA also decreased the number of glutamate-induced TUNEL-positive cells (Figure 4B, upper panels). The high number of apoptotic nuclei was revealed by nuclear staining (Figure 4B, lower panels), 24 h after glutamate treatment. Collectively, these results show that the p53-GADD45α signalling cascade plays an important role in mediating cell death following glutamate exposure.
Figure 4.
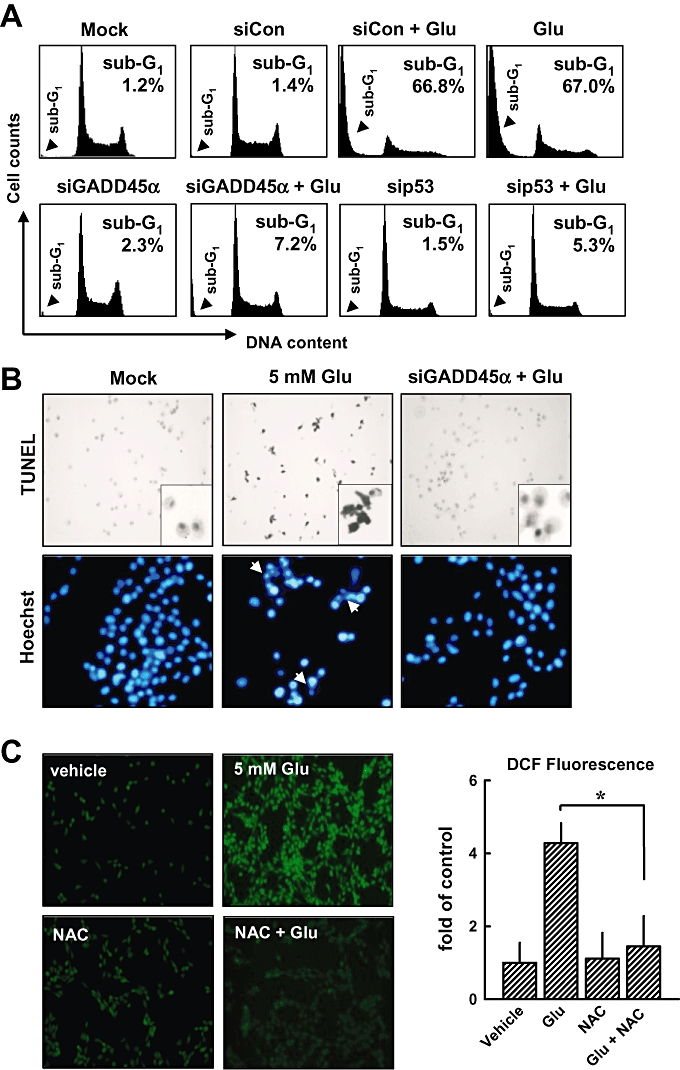
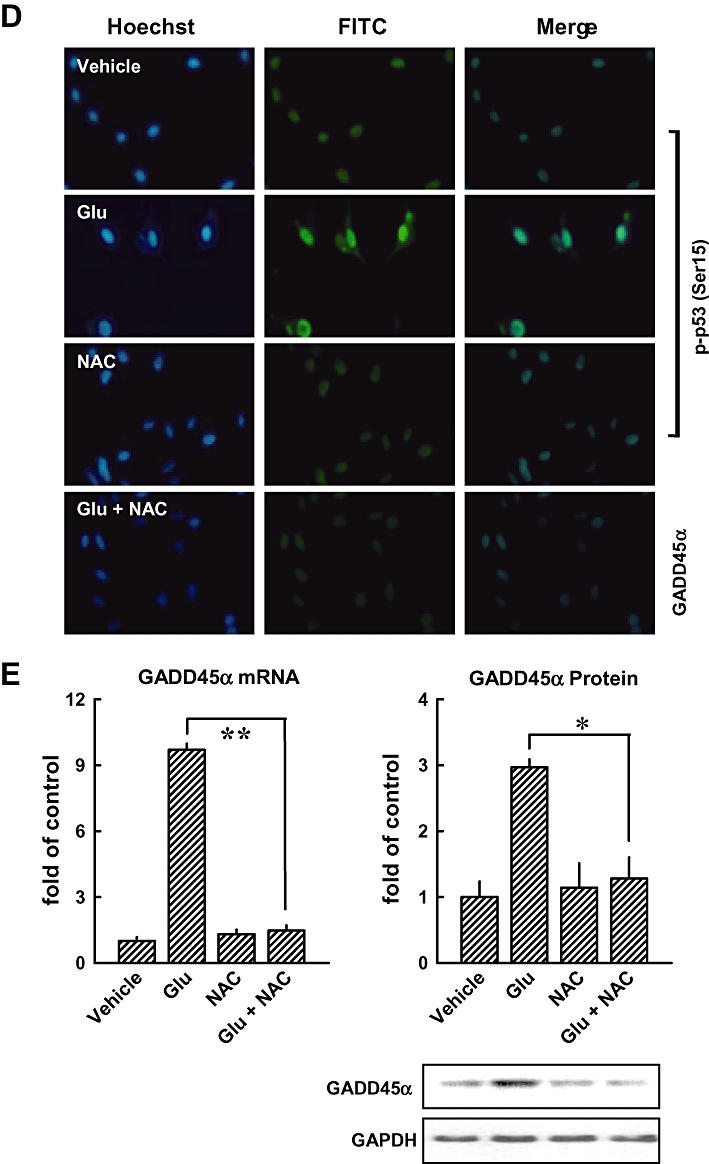
Knock-down of p53 or GADD45α suppresses glutamate-induced apoptosis. (A) HT22 cells were first transfected with the negative control siRNA (siCon), p53 siRNA (sip53), GADD45α siRNA (siGADD45α), or a mock transfection procedure (Lipofectamine only), and 24 h later, cells were exposed to 5 mmol·L−1 glutamate for additional 24 h. Flow cytometric analysis for sub-G1 cells (dead cells) was performed. (B) Representative photographs of apoptotic cells incubated with or without 5 mmol·L−1 glutamate in siGADD45α-transfected cells as detected by TUNEL staining (upper panels) and Hoechst staining (lower panels). The original magnification is ×200. (C, left panel) Cells were pretreated with 1 mmol·L−1 NAC for 1 h, and then cells were exposed to 5 mmol·L−1 glutamate for additional 8 h. Intracellular ROS production was determined using a fluorescence-based assay (H2-DCF-DA) under a laser scanning confocal microscope (×100). (C, right panel) The relative fluorescence intensity was quantified and presented as fold of the control group (mean ± S.D. of triplicate measurements). (D) Cells were first pretreated with 1 mmol·L−1 NAC for 1 h and then exposed to 5 mmol·L−1 glutamate for additional 8 h. Then cells were analysed by immunofluorescence staining for phospho-p53 or GADD45α. (E) Analysis of GADD45α mRNA level (real-time PCR, left panel) and its protein level (Western blotting, right panels). The relative protein level for GADD45α was calculated according to their densitometry reading, which were normalized according to the corresponding reading for the GAPDH protein band. Each value is a mean ± SD from three separate experiments. *P < 0.05; **P < 0.01.
Glutamate-induced ROS generation is involved in the activation of p53 and JNK
In this study, we also determined the role of intracellular ROS accumulation in the activation of p53 and JNK in HT22 cells. When cells were pretreated with 1 mmol·L−1N-acetyl-cysteine (NAC), a scavenger of ROS, for 1 h before treatment with glutamate for additional 8 h, the accumulation of intracellular ROS was suppressed (Figure 4C, left and right), confirming earlier observations (Min et al., 2006; Fukui et al., 2009). As shown in Figure 4D, immunofluorescence staining showed that NAC treatment inhibited glutamate-induced p53 activation and reduced the levels of GADD45α mRNA (Figure 4E, left panel) and protein (Figure 4E, right panel), suggesting that ROS generation is upstream of the activation of p53 and GADD45α.
Next, we examined the role of the JNK1/2 signalling pathway in mediating glutamate-induced activation of the p53-GADD45α cascade, as well as the oxidative cytotoxicity. As shown in Figure 5A, phosphorylation of JNK1/2 was observed at 6 h after glutamate treatment, and was sustained at elevated levels during the 24-h treatment with glutamate. Moreover, phosphorylation of c-Jun and MKK4 was increased after glutamate treatment, whereas phosphorylation of MKK7 was not changed after glutamate treatment for 24 h. Furthermore, the level of glutamate-induced GADD45α gene expression (real-time PCR assay) was decreased in the presence of SP600125, a known inhibitor of JNK1/2 (Figure 5B), and this change was accompanied by a marked reduction in cell death (Figure 5C). Immunofluorescence staining showed that pretreatment of cells with SP600125 inhibited glutamate-induced p53 (Ser15) phosphorylation and GADD45α activation (Figure 5D). Similar observations on cell death were obtained from flow cytometry analysis of cells stained with PI and annexin V-FITC (Figure 5E). Additionally, we showed that transfection of cells with JNK1 siRNA decreased glutamate-induced expression of JNK1, p53 and GADD45α proteins (Figure 5F, upper panel). Knock-down of JNK1 almost abolished glutamate-induced loss of cell viability (Figure 5F, lower panel). Similarly, transfection with MKK4 siRNA suppressed glutamate-induced phosphorylation of c-Jun and the activation of GADD45α (Figure 5G, upper panel), accompanied by a strong protection of cell viability (Figure 5G, lower panel). Taken together, these data provide strong support for the role of the JNK signalling pathway as an important upstream mediator in the activation of p53 and the subsequent induction of GADD45α expression.
Figure 5.
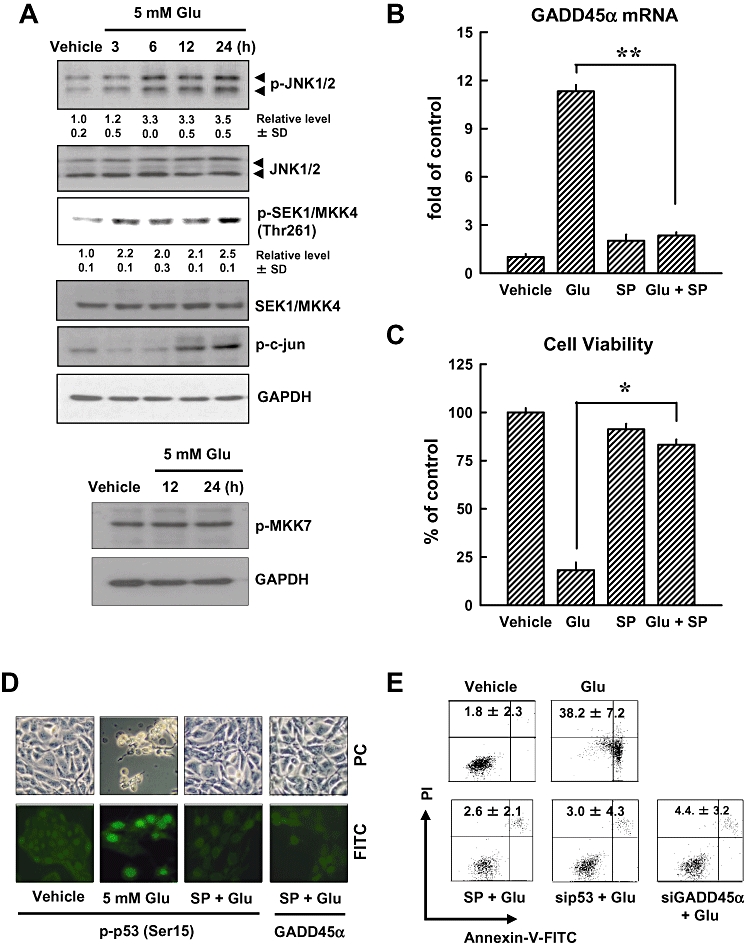
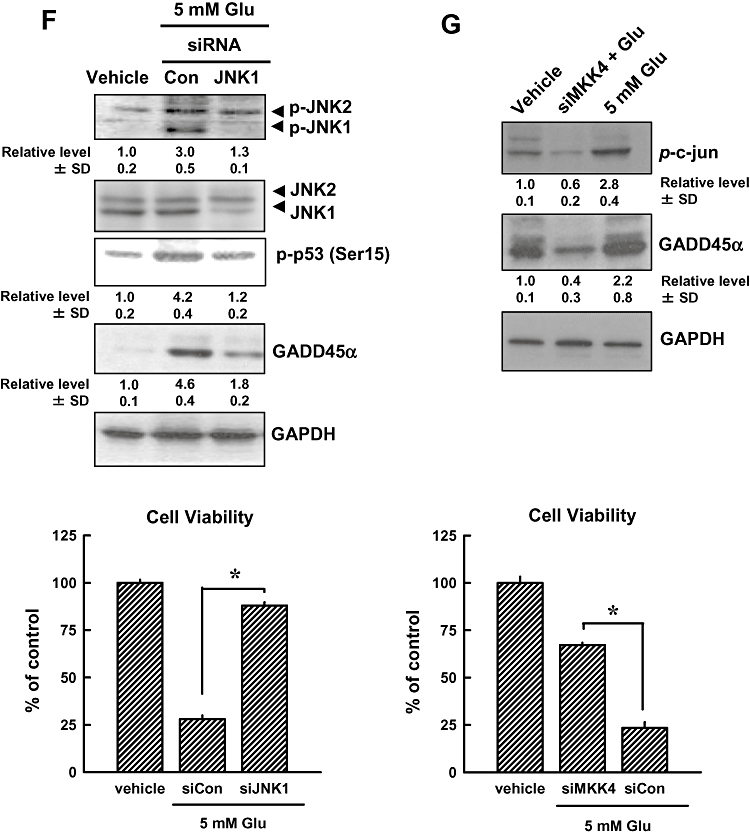
JNK activation contributes to glutamate-induced cell death (A, upper panels). HT22 cells were first incubated with 5 mmol·L−1 glutamate for 3, 6, 12 and 24 h, and then the cellular extracts were subjected to Western blotting for the levels of phospho-JNK, total JNK, phospho- MKK4, MKK4 and phospho-c-Jun. (A, lower panels) Western blot analysis of the phospho-MKK7 in HT22 cells treated with 5 mmol·L−1 glutamate for 12 or 24 h. Membranes were also stripped for determining the levels of GAPDH, which was used as a loading control. (B) Cells were pretreated for 1 h with 20 µmol·L−1 SP600126 (an inhibitor of JNK1/2) and then stimulated for additional 24 h with 5 mmol·L−1 glutamate (Glu) before analysis of GADD45α mRNA level by real-time PCR. (C) Cell viability was measured by the MTT assay. Each value is a mean ± SD from three separate experiments. (D) Cells were pretreated for 1 h with 20 µmol·L−1 SP600126 (an inhibitor of JNK1/2), and then exposed to 5 mmol·L−1 glutamate for additional 24 h. The cells were analysed using immunofluorescence staining for phospho-p53 or GADD45α. Representative photomicrographs were taken using a phase-contrast microscope (upper panels) or a fluorescence microscope (original magnification, ×200) (lower panels). (E) HT22 cells were transfected with the negative control siRNA (siCon), p53 siRNA (sip53) or GADD45α siRNA (siGADD45α), and 24 h later, the cells were exposed to 5 mmol·L−1 glutamate for additional 24 h. The cells were stained with annexin V-FITC and PI for flow cytometric analysis of apoptotic cell death. The experiments were repeated more than three times, and similar results were obtained. A representative dataset is shown. (F, upper panels) HT22 cells were first transfected with siCon, siJNK1 or sip53, and 24 h later, cell extracts were prepared for Western blot analysis of phospho-JNK1/2, JNK1/2, p53 (Ser15) and GADD45α. (G, upper panels) HT22 Cells were transfected with siCon or siMKK4, and 24 h later, cell extracts were prepared for Western blot analysis of p-c-Jun and GADD45α. The relative levels for the phosphorylated proteins were calculated according to the corresponding reading for the total protein levels. The quantitative data (mean ± SD) from three separate experiments are shown under the corresponding immunoblots (the control group without glutamate treatment is arbitrarily set at 1.0). (F and G, lower panels) Cell viability was measured by the MTT assay. Each value is a mean ± SD from three separate experiments. *P < 0.05; **P < 0.01.
Kainic acid induces GADD45α expression in vivo
Using kainic acid-induced hippocampal damage in rats as an in vivo model for oxidative neuronal damage and memory impairment, we also examined the expression of hippocampal GADD45α following kainic acid administration. As shown in Figure 6A, histological analysis of the hippocampal region of the brain, 7 days after the i.c.v. injection of kainic acid, showed a progressive shrinkage of neuronal cell bodies as well as the formation of peri-neuronal vacuoles in the CA3 region (haematoxylin and eosin staining). In contrast to this brain region, the CA1 region showed only very mild condensation of neuronal cell bodies and vacuolation, 24 h after kainic acid treatment (Figure 6A). The extent of neurodegeneration in the hippocampus was also assessed using the Fluoro-Jade B staining. There was a marked decline in the overall number of neurons as well as a dramatic increase in the number of degenerating neurons (>93%) in the CA3 region in kainic acid-treated rats (Figure 6B,C). Similarly, kainic acid significantly decreased the spontaneous alternation behaviour (used as a measure of working memory) in these animals compared with control animals (Figure 6D, P < 0.05). While GADD45α immunoreactivity was very low in the normal hippocampus, it was markedly increased in the CA3 pyramidal neurons and dentate granule cells after kainic acid treatment (Figure 6E). Furthermore, real-time PCR was performed to confirm the expression of GADD45α gene, and Western blot analysis was performed to determine protein expression in kainic acid-treated brain tissues. As shown in Figure 6F,G, the levels of GADD45α gene expression or GADD45α and p53 protein expression were increased in kainic acid-treated animals but not in vehicle-treated control animals. These in vivo data provide support for the involvement of GADD45α activation in the development of kainic acid-induced neuronal damage.
Figure 6.
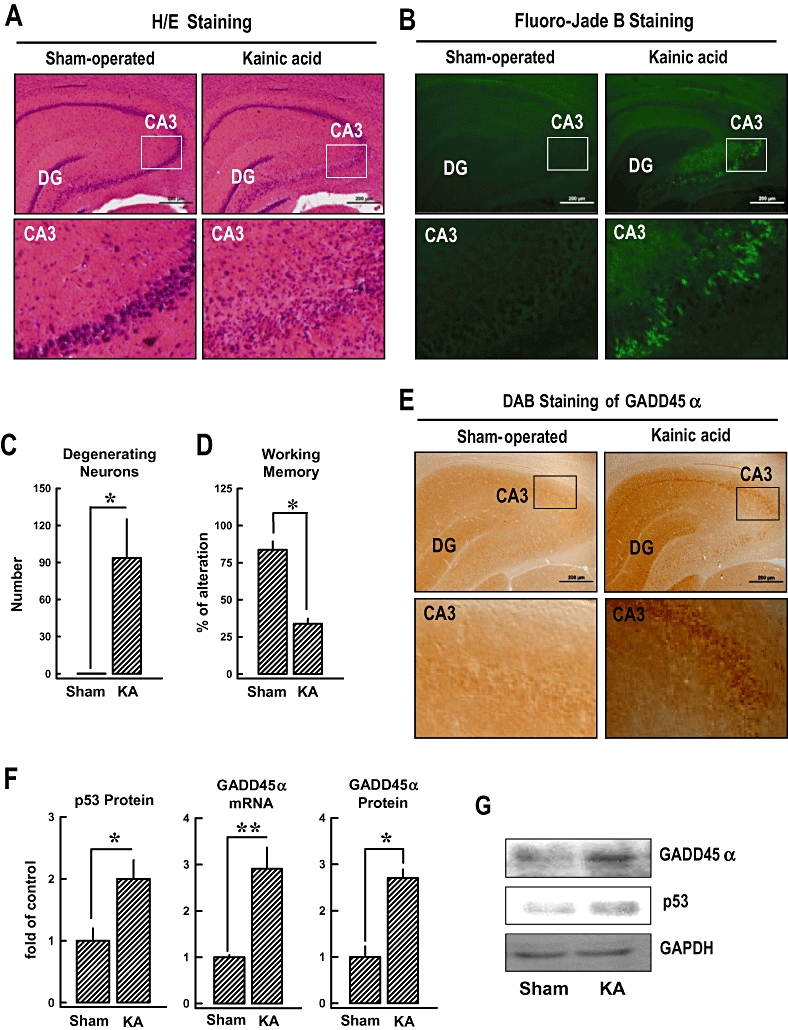
Involvement of the p53-GADD45α signalling pathway in the induction of hippocampal neuronal damage in rats following kainic acid treatment. Kainic acid (1 µL of 1 µg·µL−1 solution) was injected into the left and right lateral ventricles of male rats (anterior/posterior, −1.0; rostral, ±1.6; dorsal/ventral, 4.5) using a microlitre syringe under anaesthesia with ketamine and xylazine (50 and 5 mg·kg−1, s.c.). The control rats (sham-operated) were injected with 1 µL saline. (A) Histopathological analysis (H/E staining) of the hippocampal region (upper panels) and an enlarged CA3 region (lower panels). The original magnification is ×40. (B) Fluoro-Jade B staining for the detection of neurodegeneration in the hippocampal region (upper panels) and an enlarged CA3 region (lower panels). (C) Quantitative data for the relative extent of neurodegeneration in the CA3 region of the control and kainic acid-treated rats. The y axis unit is the total number of degenerating neurons in an enlarged CA3 region as shown in B. (D) Change in the working memory (based on Y-maze test) in kanic acid-treated rats. The test was performed 6 days after kainic acid treatment. (E, upper panel) Immunohistochemical staining (3,3′-diaminobenzidine, DAB) of GADD45α in the hippocampal region (upper panels) and an enlarged CA3 region (lower panels). (F) The relative levels of GADD45α mRNA and protein as well as p53 protein in the hippocampal region of the control and kainic acid-treated rats. The relative GADD45α and p53 protein levels were normalized according to the corresponding reading for the GAPDH protein band (the control group without glutamate treatment is arbitrarily set at 1.0). (G) Representative Western blots for GADD45α, p53 and GAPDH proteins from the control and kainic acid-treated rats. For all the quantitative data, each value is the mean ± SD (n= 5). *P < 0.05 versus sham-operated control group.
Discussion
The p53-GADD45α signalling pathway has been implicated in the excitotoxicity of neuronal cells mediated by the activation of ionotropic glutamate receptors present on the surface of many types of neurons (Zhu et al., 1997; Culmsee et al., 2001; Laabich et al., 2001). It is not known, however, whether this signalling pathway is also involved in the development of glutamate receptor-independent oxidative toxicity in neuronal cells, which is the focus of our present study. Because HT22 murine hippocampal cells lack the ionotropic glutamate receptors, they are not susceptible to glutamate-induced excitotoxicity (Sagara et al., 1996; Li et al., 1997; Tan et al., 1998). This property provides a unique model for dissecting the selective mechanism underlying the oxidative neurotoxicity induced by high concentrations of glutamate in cultured neuronal cells. We demonstrated that the levels of GADD45α mRNA and protein are increased by treatment of HT22 cells with glutamate at cytotoxic concentrations, and selective knock-down of GADD45α gene expression strongly suppressed glutamate-induced neuronal death. These results show, for the first time, that GADD45α is an important mediator of neuronal oxidative cytotoxicity.
p53, a tumour suppressor protein, is often activated in response to oxidative stress, which then results in increased transcription of GADD45α. In this study, we provided definitive evidence showing that the induction of GADD45α in HT22 hippocampal cells following glutamate-induced oxidative cytotoxicity was dependent on the functions of p53. Selective knock-down of p53 expression or the use of a p53 inhibitor, PFT-α, prevented the increased GADD45α mRNA and protein levels induced by glutamate in HT22 cells. These changes were accompanied by an increased survival of glutamate-treated cells.
Using kainic acid-induced hippocampal damage in rats as an in vivo model for oxidative neuronal damage and memory impairment, we also investigated the expression of hippocampal GADD45α following kainic acid administration. We found that the loss of neurons in the CA3 hippocampal region was detectable within 4 h of kainic acid treatment, and so were the increased number of degenerating neurons and the increased levels of p53 and GADD45α. The detection of neuronal death in CA3 region together with increased expression of p53 and GADD45α suggests that the neuronal death in this brain region is mostly likely to be also mediated by the same intracellular signalling pathways as seen in glutamate-treated HT22 cells in vitro. Further studies are needed to ascertain the functional importance of the p53-GADD45α signal pathway in neuronal death and survival in vivo, and also to determine whether pharmacological manipulation of these signalling molecules or their expression will be a viable strategy for neuronal protection.
The relationship between GADD45α expression and JNK activation has not been clearly demonstrated before. It is known that JNK is rapidly activated by exposure of cells to a variety of stress signals, including UV light, γ-radiation and toxic metals (Samet et al., 1998; Chen et al., 1999). In our recent study (Fukui et al., 2009), glutamate-induced ROS accumulation activated JNK and such activation was inhibited by the presence of antioxidants, such as NAC. In the present study, we showed that JNK activation preceded glutamate-induced GADD45α expression. While JNK activation nearly reaches maximum approximately 6 h after glutamate treatment, GADD45α is lagged behind, reaching the maximal level of activation 24 h or later after glutamate treatment. Moreover, inhibition of JNK activation with a pharmacological inhibitor (SP600125), the JNK1 siRNA, or knock-down of MKK4 (an upstream activator of JNK) each markedly reduced glutamate-induced increase in the mRNA and/or protein levels of both p53 and GADD45α. The changes in GADD45α levels were accompanied by an increased survival of glutamate-treated HT22 cells. These data suggest that JNK activation is an upstream, rather than a downstream, event in GADD45α induction following glutamate treatment. As alteration in JNK activity that resulted in changes in glutamate-induced GADD45α expression was accompanied by corresponding changes in p53 activity, these observations, in turn, suggested that JNK exerted its regulation of GADD45α expression in a p53-dependent manner.
Finally, it is also of note that the accumulation of the intracellular ROS was decreased following treatment with a p53 inhibitor, PFTα or p53 knock-down. These findings suggest that p53 is not only a downstream target in the ROS-mediated neuronal death signalling, but it is also a feed-forward activator of intracellular ROS accumulation in HT22 neuronal cells. Although the mechanism by which p53 exerts its feed-forward stimulation of the ROS accumulation in these neuronal cells is not clear at present, the observations are of considerable interest. These observations also support the notion that the induction of the p53-GADD45α signalling pathway is an essential step in the development of neuronal oxidative cytotoxicity following exposure to glutamate or other oxidants.
In summary, the results of our present study showed that the JNK-p53-GADD45α signalling cascade played a critical role in mediating glutamate-induced oxidative cytotoxicity in cultured neuronal cells. Activation of the JNK-p53-GADD45α signalling was preceded by ROS accumulation. In addition, we have presented evidence showing that JNK1 functioned as an upstream regulator of the GADD45α function in a p53-dependent manner in HT22 neuronal cells. A general scheme depicting the role of the ROS-JNK-p53-GADD45α signalling cascade in mediating the oxidative cytotoxicity of glutamate in HT22 neuronal cells is summarized in Figure 7.
Figure 7.
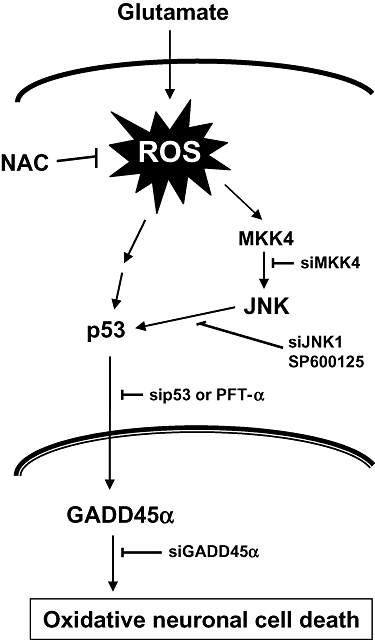
Schematic illustration of the role of JNK-p53-GADD45α signalling cascade in mediating the oxidative cytotoxicity in HT22 neuronal cells. During glutamate-induced oxidative stress, JNK is activated first as a result of ROS accumulation, and the activated JNK then activates p53, which subsequently induces sustained expression of GADD45α protein. The increased GADD45α expression will lead to oxidative neuronal cell death. As depicted, NAC can protect against oxidative neuronal death by reducing ROS accumulation, whereas SP600125 and PFT-α can also do so by selectively inhibiting the activity of JNK and p53 respectively. Likewise, the selective siRNAs for JNK1, p53 and GADD45α each would be highly effective for protecting against glutamate-induced oxidative cytotoxicity by selectively suppressing different components along the JNK-p53-GADD45α signalling cascade. Collectively, the data presented in this study demonstrate that the JNK-p53-GADD45α signalling cascade plays an essential role in mediating oxidative neuronal death. These findings also suggest that the JNK-p53-GADD45α signalling cascade represents new drug targets for the treatment and protection of ROS-induced oxidative stress and neuronal death.
Acknowledgments
This work was supported, in part, by a grant from the National Institutes of Health (Grant No. ES015242). Some of the analytical and imaging instruments used in this study are part of the COBRE core facility that is supported by an NIH Grant P20RR021940 from the National Center for Research Resources. We thank Dr Joyce Slusser for technical assistance with the flow cytometric analysis.
Glossary
Abbreviations
- GADD45α
growth arrest and DNA damage-inducible gene 45α
- JNK
c-Jun NH2-terminal kinase
- MAPK
mitogen-activated protein kinase
- MKK4
mitogen-activated protein kinase kinase 4
- NAC
N-acetyl-cysteine
- ROS
reactive oxygen species
- siRNA
small interfering RNA
Conflicts of interest
The authors have no conflict of interest to disclose.
References
- Alexander SPH, Mathie A, Peters JA. Guide to Receptors and Channels (GRAC), 4th edn. Br J Pharmacol. 2009;158(Suppl. 1):S1–S254. doi: 10.1111/j.1476-5381.2009.00499.x. [DOI] [PMC free article] [PubMed] [Google Scholar]
- Andersen JK. Oxidative stress in neurodegeneration: cause or consequence? Nat Med. 2004;10(suppl):S18–S25. doi: 10.1038/nrn1434. [DOI] [PubMed] [Google Scholar]
- Carrier F, Georgel PT, Pourquier P, Blake M, Kontny HU, Antinore MJ, et al. Gadd45, a p53-responsive stress protein, modifies DNA accessibility on damaged chromatin. Mol Cell Biol. 1999;19:1673–1685. doi: 10.1128/mcb.19.3.1673. [DOI] [PMC free article] [PubMed] [Google Scholar]
- Chen F, Demers LM, Vallyathan V, Ding M, Lu Y, Castranova V, et al. Vanadate induction of NF-kappaB involves IkappaB kinase beta and SAPK/ERK kinase 1 in macrophages. J Biol Chem. 1999;274:20307–20312. doi: 10.1074/jbc.274.29.20307. [DOI] [PubMed] [Google Scholar]
- Choi DW. Methods for antagonizing glutamate neurotoxicity. Cerebrovasc Brain Metab Rev. 1990;2:105–147. [PubMed] [Google Scholar]
- Coyle JT, Puttfarcken P. Oxidative stress, glutamate, and neurodegenerative disorders. Science. 1993;262:689–695. doi: 10.1126/science.7901908. [DOI] [PubMed] [Google Scholar]
- Culmsee C, Zhu X, Yu QS, Chan SL, Camandola S, Guo Z, et al. A synthetic inhibitor of p53 protects neurons against death induced by ischemic and excitotoxic insults, and amyloid beta-peptide. J Neurochem. 2001;77:220–228. doi: 10.1046/j.1471-4159.2001.t01-1-00220.x. [DOI] [PubMed] [Google Scholar]
- Davis JB, Maher P. Protein kinase C activation inhibits glutamate-induced cytotoxicity in a neuronal cell line. Brain Res. 1994;652:169–173. doi: 10.1016/0006-8993(94)90334-4. [DOI] [PubMed] [Google Scholar]
- Erdö SL, Michler A, Wolff JR, Tytko H. Lack of excitotoxic cell death in serum-free cultures of rat cerebral cortex. Brain Res. 1990;526:328–332. doi: 10.1016/0006-8993(90)91241-8. [DOI] [PubMed] [Google Scholar]
- Floyd RA. Antioxidants, oxidative stress, and degenerative neurological disorders. Proc Soc Exp Biol Med. 1999;222:236–245. doi: 10.1046/j.1525-1373.1999.d01-140.x. [DOI] [PubMed] [Google Scholar]
- Froissard P, Duval D. Cytotoxic effects of glutamic acid on PC12 cells. Neurochem Int. 1994;24:485–493. doi: 10.1016/0197-0186(94)90096-5. [DOI] [PubMed] [Google Scholar]
- Fukui M, Song JH, Choi J, Choi HJ, Zhu BT. Mechanism of glutamate-induced neurotoxicity in HT22 mouse hippocampal cells. Eur J Pharmacol. 2009;617:1–11. doi: 10.1016/j.ejphar.2009.06.059. [DOI] [PubMed] [Google Scholar]
- Harman D. The aging process. Proc Natl Acad Sci USA. 1981;78:7124–7128. doi: 10.1073/pnas.78.11.7124. [DOI] [PMC free article] [PubMed] [Google Scholar]
- Harper JW, Adami GR, Wei N, Keyomarsi K, Elledge SJ. The p21 Cdk-interacting protein Cip1 is a potent inhibitor of G1 cyclin-dependent kinases. Cell. 1993;75:805–816. doi: 10.1016/0092-8674(93)90499-g. [DOI] [PubMed] [Google Scholar]
- He X, Jenner AM, Ong WY, Farooqui AA, Patel SC. Lovastatin modulates increased cholesterol and oxysterol levels and has a neuroprotective effect on rat hippocampal neurons after kainate injury. J Neuropathol Exp Neurol. 2006;65:652–663. doi: 10.1097/01.jnen.0000225906.82428.69. [DOI] [PubMed] [Google Scholar]
- Kastan MB, Zhan Q, el-Deiry WS, Carrier F, Jacks T, Walsh WV, et al. A mammalian cell cycle checkpoint pathway utilizing p53 and GADD45 is defective in ataxia-telangiectasia. Cell. 1992;71:587–597. doi: 10.1016/0092-8674(92)90593-2. [DOI] [PubMed] [Google Scholar]
- Kovalsky O, Lung FD, Roller PP, Fornace AJ., Jr Oligomerization of human Gadd45α protein. J Biol Chem. 2001;276:39330–39339. doi: 10.1074/jbc.M105115200. [DOI] [PubMed] [Google Scholar]
- Laabich A, Li G, Cooper NG. Characterization of apoptosis-genes associated with NMDA mediated cell death in the adult rat retina. Brain Res Mol Brain Res. 2001;91:34–42. doi: 10.1016/s0169-328x(01)00116-4. [DOI] [PubMed] [Google Scholar]
- Li Y, Maher P, Schubert D. A role for 12-lipoxygenase in nerve cell death caused by glutathione depletion. Neuron. 1997;19:453–463. doi: 10.1016/s0896-6273(00)80953-8. [DOI] [PubMed] [Google Scholar]
- Livak KJ, Schmittgen TD. Analysis of relative gene expression data using real-time quantitative PCR and the 2−ΔΔCT method. Methods. 2001;25:402–408. doi: 10.1006/meth.2001.1262. [DOI] [PubMed] [Google Scholar]
- Min JY, Park MH, Park KW, Lee NW, Kim TH, Kim J, et al. Staurosporin induces neurite outgrowth through ROS generation in NH33 hippocampal cell lines. J Neural Transm. 2006;113:1821–1826. doi: 10.1007/s00702-006-0500-z. [DOI] [PubMed] [Google Scholar]
- Mita H, Tsutsui J, Takekawa M, Witten EA, Saito H. Regulation of MTK1/MEKK4 kinase activity by its N-terminal autoinhibitory domain and GADD45 binding. Mol Cell Biol. 2002;22:4544–4555. doi: 10.1128/MCB.22.13.4544-4555.2002. [DOI] [PMC free article] [PubMed] [Google Scholar]
- Murphy SN, Miller RJ. Two distinct quisqualate receptors regulate Ca2+ homeostasis in hippocampal neurons in vitro. Mol Pharmacol. 1989;35:671–180. [PubMed] [Google Scholar]
- Nunomura A, Perry G, Aliev G, Hirai K, Takeda A, Balraj EK, et al. Oxidative damage is the earliest event in Alzheimer disease. J Neuropathol Exp Neurol. 2001;60:759–767. doi: 10.1093/jnen/60.8.759. [DOI] [PubMed] [Google Scholar]
- Oka A, Belliveau MJ, Rosenberg PA, Volpe JJ. Vulnerability of oligodendroglia to glutamate: pharmacology, mechanisms, and prevention. J Neurosci. 1993;13:1441–1453. doi: 10.1523/JNEUROSCI.13-04-01441.1993. [DOI] [PMC free article] [PubMed] [Google Scholar]
- Paxinos G, Watson C. The Rat Brain in Stereotaxic Coordinates, 3rd edit. San Diego: Academic Press; 1997. [Google Scholar]
- Pereira C, Paveto C, Espinosa J, Alonso G, Flawiá MM, Torres HN. Control of Trypanosoma cruzi epimastigote motility through the nitric oxide pathway. J Eukaryot Microbiol. 1997;44:155–156. doi: 10.1111/j.1550-7408.1997.tb05952.x. [DOI] [PubMed] [Google Scholar]
- Sagara J, Makino N, Bannai S. Glutathione efflux from cultured astrocytes. J Neurochem. 1996;66:1876–1881. doi: 10.1046/j.1471-4159.1996.66051876.x. [DOI] [PubMed] [Google Scholar]
- Salvador JM, Hollander MC, Nguyen AT, Kopp JB, Barisoni L, Moore JK, et al. Mice lacking the p53-effector gene Gadd45a develop a lupus-like syndrome. Immunity. 2002;16:499–508. doi: 10.1016/s1074-7613(02)00302-3. [DOI] [PubMed] [Google Scholar]
- Samet JM, Graves LM, Quay J, Dailey LA, Devlin RB, Ghio AJ, et al. Activation of MAPKs in human bronchial epithelial cells exposed to metals. Am J Physiol. 1998;275(3 Pt 1):L551–L558. doi: 10.1152/ajplung.1998.275.3.L551. [DOI] [PubMed] [Google Scholar]
- Sarter M, Bodewitz G, Stephens DN. Attenuation of scopolamine-induced impairment of spontaneous alternation behavior by antagonist but not inverse agonist and β-carboline. Psychopharmacology. 1988;94:491–495. doi: 10.1007/BF00212843. [DOI] [PubMed] [Google Scholar]
- Sayre LM, Smith MA, Perry G. Chemistry and biochemistry of oxidative stress in neurodegenerative disease. Curr Med Chem. 2001;8:721–738. doi: 10.2174/0929867013372922. [DOI] [PubMed] [Google Scholar]
- Sayre LM, Perry G, Smith MA. Oxidative stress and neurotoxicity. Chem Res Toxicol. 2008;21:172–188. doi: 10.1021/tx700210j. [DOI] [PubMed] [Google Scholar]
- Schmued LC, Hopkins KJ. Fluoro-Jade: novel fluorochromes for detecting toxicant-induced neuronal degeneration. Toxicol Pathol. 2000;28:91–99. doi: 10.1177/019262330002800111. [DOI] [PubMed] [Google Scholar]
- Smith ML, Chen IT, Zhan Q, Bae I, Chen CY, Gilmer TM, et al. Interaction of the p53-regulated protein Gadd45 with proliferating cell nuclear antigen. Science. 1994;266:1376–1380. doi: 10.1126/science.7973727. [DOI] [PubMed] [Google Scholar]
- Takahashi S, Saito S, Ohtani N, Sakai T. Involvement of the Oct – 1 regulatory element of the gadd45 promoter in the p53-independent response to ultraviolet irradiation. Cancer Res. 2001;61:1187–1195. [PubMed] [Google Scholar]
- Takekawa M, Saito H. A family of stress-inducible GADD45-like proteins mediate activation of the stress-responsive MTK1/MEKK4 MAPKKK. Cell. 1998;95:521–530. doi: 10.1016/s0092-8674(00)81619-0. [DOI] [PubMed] [Google Scholar]
- Tan S, Wood M, Maher P. Oxidative stress induces a form of programmed cell death with characteristics of both apoptosis and necrosis in neuronal cells. J Neurochem. 1998;71:95–105. doi: 10.1046/j.1471-4159.1998.71010095.x. [DOI] [PubMed] [Google Scholar]
- Tao H, Umek RM. Reciprocal regulation of gadd45 by C/EBP alpha and c-Myc. DNA Cell Biol. 1999;18:75–84. doi: 10.1089/104454999315646. [DOI] [PubMed] [Google Scholar]
- Thyss R, Virolle V, Imbert V, Peyron JF, Aberdam D, Virolle T. NF-kappaB/Egr-1/Gadd45 are sequentially activated upon UVB irradiation to mediate epidermal cell death. EMBO J. 2005;24:128–137. doi: 10.1038/sj.emboj.7600501. [DOI] [PMC free article] [PubMed] [Google Scholar]
- Tran H, Brunet A, Grenier JM, Datta SR, Fornace AJ, Jr, DiStefano PS, et al. DNA repair pathway stimulated by the forkhead transcription factor FOXO3a through the Gadd45 protein. Science. 2002;19:530–534. doi: 10.1126/science.1068712. [DOI] [PubMed] [Google Scholar]
- Zhan Q, Bae I, Kastan MB, Fornace AJ., Jr The p53-dependent gamma-ray response of GADD45. Cancer Res. 1994;54:2755–2760. [PubMed] [Google Scholar]
- Zhu RL, Graham SH, Jin J, Stetler RA, Simon RP, Chen J. Kainate induces the expression of the DNA damage-inducible gene, GADD45, in the rat brain. Neuroscience. 1997;81:707–720. doi: 10.1016/s0306-4522(97)00205-4. [DOI] [PubMed] [Google Scholar]