Abstract
To investigate the dynamics of guanosine 3′,5′-cyclic monophosphate (cGMP) in single living cells, we constructed genetically encoded, fluorescent cGMP indicators by bracketing cGMP-dependent protein kinase (cGPK), minus residues 1–77, between cyan and yellow mutants of green fluorescent protein. cGMP decreased fluorescence resonance energy transfer (FRET) and increased the ratio of cyan to yellow emissions by up to 1.5-fold with apparent dissociation constants of ≈2 μM and >100:1 selectivity for cGMP over cAMP. To eliminate constitutive kinase activity, Thr516 of cGPK was mutated to Ala. Emission ratio imaging of the indicators transfected into rat fetal lung fibroblast (RFL)-6 showed cGMP transients resulting from activation of soluble and particulate guanylyl cyclase, respectively, by nitric oxide (NO) and C-type natriuretic peptide (CNP). Whereas all naive cells tested responded to CNP, only 68% responded to NO. Both sets of signals showed large and variable (0.5–4 min) latencies. The phosphodiesterase (PDE) inhibitor 3-isobutyl-1-methylxanthine (IBMX) did not elevate cGMP on its own but consistently amplified responses to NO or CNP, suggesting that basal activity of guanylate cyclase is very low and emphasizing the importance of PDEs in cGMP recycling. A fraction of RFL cells showed slowly propagating tides of cGMP spreading across the cell in response to delocalized application of NO. Biolistically transfected Purkinje neurons showed cGMP responses to parallel fiber activity and NO donors, confirming that single-cell increases in cGMP occur under conditions appropriate to cause synaptic plasticity.
Keywords: cGPK, FRET, green fluorescent protein
The importance of the guanosine 3′,5′-cyclic monophosphate (cGMP) second messenger cascade has been steadily gaining recognition because of the fact that it is different from the cAMP system and thus, points us to novel answers of the biological problem of receptor–effector coupling in intracellular signal transduction. cGMP is a key player in the regulation of various physiological processes, including smooth muscle tone, neuronal excitability, epithelial electrolyte transport, phototransduction in the retina, and cell adhesion (for reviews see refs. 1–5). However, cGMP is still an unruly member of the cyclic nucleotide family because of several peculiarities of the cGMP signal transduction system. (i) The pathways that control cGMP levels are complex, with receptors coupled not only to two different forms of guanylyl cyclases (6, 7), but also to a number of cGMP-specific phosphodiesterases (PDEs) (1). (ii) The intracellular actions of cGMP are primarily mediated by cGMP-dependent protein kinases (cGPKs) (2), but several types of cyclic nucleotide-activated ion channels also appear to be involved (4). (iii) Many of the enzymes that participate in the cGMP cascade are restricted to a limited subset of tissues. The necessity of working out multiple mechanisms, and the difficulty of studying cGMP in broken cell preparations, have been experimental and conceptual stumbling blocks. In addition, intracellular cGMP concentrations appear to be highly flexible and transient in nature because of a tightly controlled equilibrium of synthesis and breakdown.
Genetically encoded indicators based on spontaneously fluorescent proteins are powerful tools to observe the dynamics of intracellular signaling molecules noninvasively, as has been demonstrated for a variety of messengers (8) including Ca2+ (9, 10) and cAMP (11). The best known cGMP-responsive proteins are the various isoforms of cGPK, cyclic nucleotide gated channels, and PDEs. We chose cGPK because it is the most ubiquitous physiological sensor of cGMP, undergoes a relatively large and well understood conformational change in response to cGMP, is not restricted to membranes, and is related to cAMP-dependent protein kinase, from which indicators have already been engineered (11, 12). The most general strategy for creating genetically encoded indicators is to sandwich the conformationally sensitive domain between two mutants of green fluorescent protein to modulate fluorescence resonance energy transfer between the latter. We now demonstrate the validity of this approach, both in purified proteins in vitro and in live cells. Some of this work has been reported in abstract form.
Experimental Procedures
Gene Construction.
The cDNA of enhanced yellow fluorescent protein (EYFP) (S65G, S72A, T203Y; ref. 10) or Citrine (S65G, V68L, Q69 M, S72A, T203Y; ref. 14), and enhanced cyan fluorescent protein (ECFP) (F64L, S65T, Y66W, N146I, M153T, V163A, N212K; ref. 9) were fused to cGPK mutants created by PCR using the template cGPK Iα (15) and primers incorporating SphI and SacI sites at the 5′ and 3′ ends of the gene, respectively. N-terminal deletions Δ1–77, Δ1–109, and Δ1–227 were constructed with forward primers amplifying cGPK Iα beginning at nucleotides 232, 328, and 682, respectively, and a reverse primer for full-length cGPK Iα minus the stop codon. C-terminal deletions Δ336–670, Δ340–670, Δ352–670, and Δ357–670 were constructed with a forward primer for full-length cGPK Iα and reverse primers amplifying cGPK Iα beginning at nucleotides 1008, 1020, 1056, and 1071, respectively. To create cygnet-2, the mutation T516A was incorporated into cygnet-1 by PCR-based site-directed mutagenesis. Constructs were cloned into pRSET (Invitrogen), pcDNA3.1 (Invitrogen), and pFASTBac (GIBCO/BRL) vectors for E. coli, transient eukaryotic, and Sf9 cell expression, respectively.
Protein Expression and Purification.
Spodoptera frugiperda (Sf9) cells (GIBCO/BRL) were cultured in Sf-900 II SFM supplemented with 5% (vol/vol) FCS, 0.2% (vol/vol) Pluronic F-68, 50 μg/ml gentamicin, and 0.25 μg/ml amphotericin B at 28°C in shaker flasks at 130 rpm. Production of baculovirus carrying the gene for the expression of cGMP indicators was performed according to the manufacturer's instructions (GIBCO/BRL). To generate protein, 600 ml low-passage Sf9 cells (1.5 × 10⁶ cells/ml) were each infected with 60 ml of a third amplification baculovirus. Cells were pelletted 72 h postinfection and resuspended in 10 times their volume of culture lysis buffer [50 mM KPO4, pH 6.5, 10 mM DTT, 10 mM benzamidine, 5 mM EDTA, 5 mM EGTA, 0.2 mg/ml l-1-chloro-3-(4-tosylamido)-4-phenyl-2-butanone (TPCK), 0.1 mg/ml l-1-chloro-3-(4-tosylamido)-7-amino-2-heptanone-HCL (TLCK), 0.17 mg/ml phenylmethylsulfonyl fluoride, 0.08 mg/ml soybean trypsin inhibitor (SBTI) and 0.1 mg/ml antipain]. Following French pressure cell treatment (SLM-Aminco) and centrifugation at 25,000 rpm for 30 min at 4°C, the supernatant was loaded onto a 2.5-ml cAMP-agarose column (BioLog Life Science Institute, Bremen, Germany) at 4°C. Subsequent high salt washes (1 M NaCl) allowed the isocratic elution of the indicators at room temperature by using 1 mM cAMP. Peak fractions were pooled and dialyzed extensively at 4°C in 50 mM KPO4 (pH 6.8), 2 mM benzamidine, 15 mM 2-mercaptoethanol, 1 mM EDTA. The constructs were stored protected from light at 4°C.
Mammalian Cell Expression.
Rat fetal lung fibroblast cells (RFL-6, American Type Culture Collection, Manassas, VA) were cultured in Ham's F-12 medium supplemented with 20% FCS at 37°C in 6% CO2. One to two days before transfection, cells were spread onto glass bottom dishes for imaging. Cells were then transfected with Fugene 6 Transfection Reagent (Roche Molecular Biochemicals).
Organotypic Culture and Transfection of Purkinje Neurons.
Acute cerebellar slices from young rats were transferred to Millicell-CM inserts (Millipore) and supplemented with 1 ml of medium (16). The slices were then transfected with the cygnet construct coated on gold particles, which were ejected from a Bio-Rad biolistic gene gun. The slices were maintained in a 37°C humidified incubator with 5% CO2. Imaging of cGMP transients was performed 48–72 h later. Parallel fiber inputs to Purkinje neurons were stimulated with 50-μs pulses of ≈0.5 mA applied to a bipolar tungsten electrode placed at the pial surface of the slice adjacent to the transfected cell.
Imaging.
Between 2 and 5 days after DNA transfection, RFL-6 cells were imaged at 22°C (or occasionally at 36°C with a thermostated stage and heating coil around the objective) on a Zeiss Axiovert microscope with a cooled charged-coupled device camera (Photometrics, Tucson, AZ) as described (9). Hanks' balanced salt solution with 20 mM Hepes (pH 7.35) and glucose (2 g/l) was used as extracellular solution. Dual-emission ratio imaging of the indicators was controlled by METAFLUOR 4.01 software (Universal Imaging, Media, PA) using a 440DF20 excitation filter, a 455DRLP dichroic mirror, and two emission filters (480DF30 for ECFP, 535DF25 for EYFP and citrine) alternated by a filter changer (Lambda 10–2; Sutter Instruments, Novato, CA). Interference filters were obtained from Omega Optical and Chroma Technologies (both of Brattleboro, VT).
Imaging of organotypic slices was done on an upright Axioskop (Zeiss) equipped with an emission wavelength splitter and Pentamax cooled charge-coupled device camera (Princeton Instruments, Trenton, NJ) so that both emission wavelengths were recorded simultaneously on adjacent halves of the sensor chip (17).
Protein Titrations in Vitro.
cGMP titrations of cygnet-1 and -2 were performed in a cuvette by using a fluorescence spectrometer (F-4500; Hitachi, Tokyo) in lysis buffer (see above) or 50 mM KPO4, pH 6.8, 10 mM DTT, 10 mM benzamidine, 5 mM EDTA. Protein concentrations ranged from 20–500 nM.
Immunocytochemistry.
Organotypic slices or cultured cells were fixed with 4% paraformaldehyde at 37°C and pH 7.4. The tissue was then transferred to 4°C for 1 h and then washed with cold PBS three times. Immunolabeling was then performed with anti-cGPK, Iα, and Iβ (rabbit) (Calbiochem) as primary antibody and donkey anti-rabbit Ig labeled with Cy5 (Jackson ImmunoResearch) as secondary antibody. The tissue was then viewed with a Bio-Rad confocal microscope by using an Ar+/Kr+ laser. Cygnet fluorescence was excited at 488 nm and detected at 520 nm, whereas Cy5 fluorescence was excited at 647 nm and detected at 680 nm.
Results
Construction, Expression, Purification, and in Vitro Analysis of cGMP-Indicators.
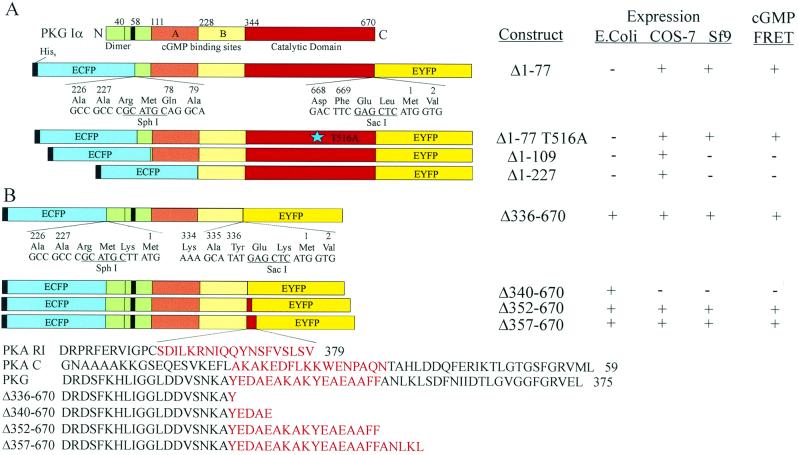
We generated a series of cGMP-receptor proteins by fusing the amino terminus of various deletion forms of cGPK to ECFP (9) and the carboxyl terminus to EYFP or a pH-insensitive variant, Citrine (ref. 14; Fig. 1). ECFP and EYFP flanking full-length cGPK did not show a cGMP-dependent fluorescence resonance energy transfer (FRET) ratio change, so we tried N-terminal cGPK deletions (Fig. 1A). The N terminus harbors the sites of dimerization (18), anchor protein binding (19), and autophosphorylation (20) and protrudes from the kinase core structure, as indicated by low-angle neutron scattering (21), tryptic cleavage (22), mutagenesis, and modeling studies (23–25). As alternatives, we sandwiched C-terminal cGPK deletions between the chromophores by eliminating the catalytic domain of the kinase (Fig. 1B). The deletion sites were placed along a putative α-helix that bridges the regulatory and catalytic domains in cGPK (see Fig. 1). All constructs were expressed in standard protein expression systems (E. coli/pRSET, COS-7/pCDNA3, Sf9/pFastBac). Insect cell expression and cAMP-affinity chromatography proved superior for high yield and functional protein preparations (Fig. 2 A and D).
Figure 1.
Domain structure and expression profile of cGMP-indicators. (A) N-terminal cGPK deletion mutants: Δ1–77 (cygnet-1) lacks the dimerization and autoinhibitory domain; Δ1–77/Thr516Ala (cygnet-2) represents the catalytically inactive mutant. Δ1–109 begins with the high-affinity cGMP binding site and Δ1–227 retains the low-affinity cGMP binding site. (B) C-terminal cGPK deletion mutants: Δ336–670, Δ340–670, Δ352–670, and Δ357–670 deletions have the catalytic domain and successive portions of a putative α-helix (W.R.G.D., unpublished results) eliminated.
Figure 2.
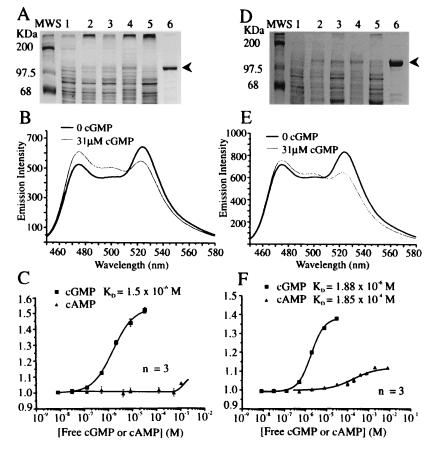
Purification and in vitro characterization of cygnet-1 (A–C) and cygnet-2 (D–F). (A and D) SDS 12%/PAGE illustrating the 8-AEA-cAMP-agarose affinity–chromatography purification of 123-kDa cygnet-1 and -2 proteins from Sf9 cells. Lanes 1, unexpressed Sf9 cell extracts; Lanes 2, expression induced Sf9 cell extracts; Lanes 3, soluble fractions; Lanes 4, insoluble fractions; Lanes 5, cAMP–agarose washes; Lanes 6, pooled 1-mM cAMP-elutions. (B and E) Fluorescence spectra (excited at 430 nm) with zero and saturating (31 μM) cGMP, respectively. (C and F) Titration curves for cGMP and cAMP, combining three independent measurements. The fitted curves correspond to the apparent dissociation constants and Hill coefficients given in the text.
Of the N-terminal deletion constructs, the Δ1–77 chimera yielded a protein (named “cygnet-1” for cyclic GMP indicator using energy transfer) that decreased FRET on saturation with cGMP, resulting in a 1.4- to 1.5-fold increase in the ratio of cyan to yellow emissions (Fig. 2B). This truncation rendered cygnet-1 constitutively active as a kinase (data not shown), in analogy to native cGPK on truncation (22). To silence the kinase activity, we mutated the Thr516 to Ala within the catalytic domain (ref. 26; Fig 1A) to produce cygnet-2. Yields of purified cygnet-1 and -2 were 3–5 mg/l culture (Fig. 2 A and D). C and F in Fig. 2 illustrate cGMP/cAMP titration curves of the emission ratios for cygnet-1 and -2. Their apparent cGMP equilibrium dissociation constants KD(cGMP) and Hill coefficients were 1.5 μM (n = 1.0) and 1.9 μM (n = 1.4) for cygnet-1 and -2, respectively. These KD's are conducive to measurement of cGMP levels from 10−7 to 10−5 M. Native cGPK has a KD(cGMP) of approximately 100 nM (27), so the fusion to ECFP and EYFP slightly disfavored cGMP binding. High levels of cAMP, up to 1 mM, had very little effect on the emission ratio, because cAMP bound with very low affinity and caused rather little spectroscopic change when bound. The outstanding selectivity for cGMP over cAMP (>100:1) is a major benefit of choosing cGPK as the foundation for an indicator.
The C-terminal constructs Δ336/340/352/357–670 also displayed cGMP-selective and -dependent ratio changes (FRET = 1.25–1.35) with apparent cGMP equilibrium dissociation constants KD (cGMP) of 300 nM (data not shown). However, the cGMP-induced ratio changes were irreversible for all constructs (data not shown), thus rendering them unsuitable for intracellular studies.
Mammalian Cell Expression, Intracellular Concentration, and Imaging.
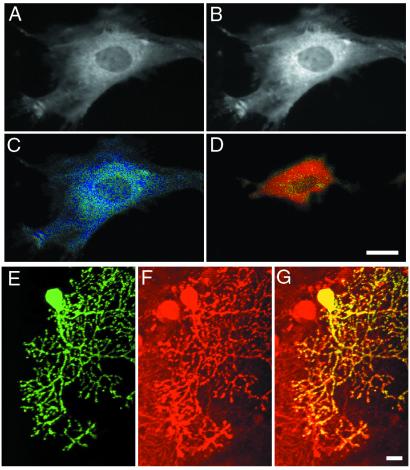
Cygnet-1 and -2 were transfected into COS-7 and RFL cells to compare their behavior in live cells. The two indicators gave fairly similar ratios, but cygnet-1 tended to change cell morphology and yield far fewer viable cells, perhaps because of its constitutive activity as a kinase. Therefore, all subsequent intracellular studies were performed with the kinase-inactivated mutant cygnet-2 or a further variant cygnet-2.1, in which the EYFP was replaced by a more recent pH-resistant homolog, Citrine (14), to test for pH artifacts. In general, no biological differences were seen between cygnet-2 and -2.1, suggesting that pH artifacts were not a concern in the current experiments. A and B in Fig. 3 demonstrate that cygnet-2 is fairly uniformly distributed in the cytosol of RFL-6 cells as judged by the identical morphology in cyan and yellow channels, without major puncta or inclusion bodies but possibly with some concentration on the cytoskeletal elements. The indicator was excluded from the nucleus as expected for a protein of 123 kDa without targeting signals. The morphology and phenotype of RFL cells transfected with cygnet-2 or -2.1 appeared normal and undistinguishable from nontransfected cells. Administration of a cell-permeant nonhydrolyzable cGMP analog, 8-(p-chlorophenylthio)-cGMP (8-CPT-cGMP; Biolog Life Sciences Institute), increased the ratio of cyan to yellow emissions uniformly throughout the cytoplasm (Fig. 3 C and D). However, RFL cells showed considerable shape change, particularly retraction, whenever cGMP levels were elevated.
Figure 3.
Imaging of cygnet-2 in RFL and Purkinje cells. (A and B) Cytosolic localization and nuclear exclusion of cygnet-2 in RFL cells as shown by the fluorescence images of ECFP (A; 480 nm emission) and EYFP (B; 535 nm emission). (C and D) Pseudocolor representations of the 480 to 535 nm FRET ratio of a RFL cell at resting (C) and 30 μM cGMP (D). The color change from blue to yellow indicates a 25% ratio change. (E and F) Biolistically transfected cerebral brain preparation showing the EYFP emission of a transfected Purkinje cell (E) and immunostaining for cGPK I by a specific antibody (25) of the identical region (F). (G) Overlay of E and F. (Scale bars = 20 μm in all images.)
A recurrent question with any biological indicator is the extent to which the exogenous indicator buffers or otherwise perturbs the signal that it is measuring. Because the transient transfection techniques used here introduce the indicator into only a fraction of cells, the expression level of the indicator had to be assessed in individual cells. RFL cells with cygnet-2 expression levels appropriate for imaging had intensities of EYFP fluorescence comparable to micromolar concentrations of EYFP in microchambers of equivalent thickness (10). We also compared cGPK expression levels in fluorescent vs. neighboring nonfluorescent cells by immunohistochemistry with a polyclonal antibody specific for the type-I isozyme (28). RFL-6 cells with low to moderate expression levels of cygnet-2 as preferred for live-cell imaging typically had up to several-fold more PKG immunoreactivity than nontransfected cells. In cerebellar Purkinje neurons, which contain high endogenous levels of cGPK (29), the relative increment due to transfection was negligible (Fig. 3 E–G). Thus, buffering by the indicator is more of a concern in the RFL-6 cells but is probably not a gross distortion, considering the lower cGMP affinity of the indicators compared with the endogenous cGPKs.
Temporal Dynamics of Intracellular cGMP in RFL Cells.
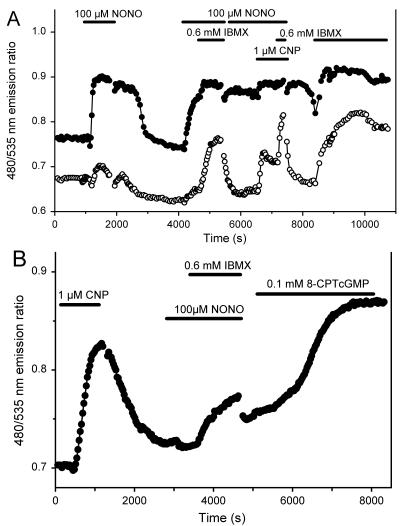
Fig. 4 shows the time course of the spatially averaged cyan/yellow emission ratios reflecting cGMP concentration in individual RFL cells. Adjacent cells often had somewhat different basal ratios whose offsets persisted even after saturation of the response with a 8-CPT-cGMP or maximal stimulation. Such offsets probably mean that the relation between emission ratio and cGMP is somewhat different for each cell, perhaps because of differing degrees of indicator proteolysis. Application of 0.1 mM of the NO donor Na+(Et2NNONO)− (sodium salt of 1,1-diethyl-2-hydroxy-2-nitrosohydrazine, NONO; ref. 30) to stimulate soluble guanylyl cyclase (sGC) increased the emission ratio by 18% for one of the cells (closed circles) in Fig. 4A, almost to saturation, whereas a neighboring cell showed almost no increase in cGMP concentration. Of such naive cells, 17 of 25 (68%) gave significant (>5%) increases in emission ratio on first exposure to NONO. Within the responders, the cGMP increase generally began fairly abruptly after a latency period ranging from 0.5 to 4 min, was reversible on removal of NONO, and could be elicited at least once more on reapplication of NONO. All of the cells that gave little or no response to NONO alone (e.g., open circles in Fig. 4A and Fig. 4B) became responders when NONO was combined with the PDE inhibitor 3-isobutyl-1-methylxanthine (IBMX). Thus, individual cells vary considerably in the ratio of their sGC to PDE activities.
Figure 4.
In vivo fluorescence ratio imaging. The 480/535 nm emission ratios from cygnet-2 in two RFL cells (A) and a single RFL cell (B), responding to combinations of extracellular stimuli derived from NONO, CNP, IBMX, and 8-CPT-cGMP, monitored every 30 s by digital imaging microscopy.
C-type natriuretic peptide 32–53 (CNP; Bachem), which activates particulate guanylyl cyclase, caused an analogous, but more consistent increase in intracellular cGMP concentration (Fig. 4 A and B). Application of 1 μM CNP to 13 previously unstimulated cells gave cGMP increases in all of them. The maximal response of the indicator could be determined by the application of 8-CPT-cGMP as shown in Fig. 4B. The differences in cGMP concentration rise reflect the different mechanisms of signal transduction: CNP, fast response—membrane-associated receptor-mediated; NO donor, slower response—diffusion-controlled receptor-mediated; 8-CPT-cGMP, slowest response—diffusion-controlled non-receptor-mediated. Table 1 summarizes the results from many experiments similar to Fig. 4.
Table 1.
Summary of cGMP responses of cygnet-2 transfected RFL cells
| Stimulus | Cells tested | Responsive cells | Mean lag time (sec) | % Increase in ratio | Calibration maximum |
|---|---|---|---|---|---|
| 0.1 mM NONO | 25 | 17 | 126 ± 116 | 19.1 | 20.2 |
| NONO with 0.6 mM IBMX | 21 | 9 | 264 ± 280 | 19.1 | 20.3 |
| NONO before IBMX | 7 | 1 | 500 | 24 | 30.3 |
| NONO after IBMX | 6 | 6 | 253 ± 321 | 18 | 20.1 |
| NONO (second application) | 6 | 6 | 170 ± 82 | 17.5 | 24.3 |
| 1 μM CNP | 13 | 13 | 71 ± 54 | 16.9 | 21.3 |
| CNP (second application) | 16 | 15 | 118 ± 116 | 17.5 | 23 |
| IBMX before any other stimulus | 8 | 0 | NA | NA | |
| 50–100 μM 8-CPT-cGMP | 14 | 14 | 1910 ± 1116 | 24.8 | 24.8 |
Responsive cells are those with a >5% change in emission ratio. Mean lag time is the time from stimulus addition to the beginning of a clear response. % increase in ratio is the mean amplitude of the response. Calibration maximum is the % increase in ratio produced by saturating stimulation such as 8-CPT-cGMP. NA, not applicable.
IBMX (0.6 mM) by itself did not produce a significant change in emission ratio in any of eight previously unstimulated cells. The basal level of guanylyl cyclase activity therefore seems very low in RFL cells.
Spatial Dynamics of Intracellular cGMP in RFL Cells.
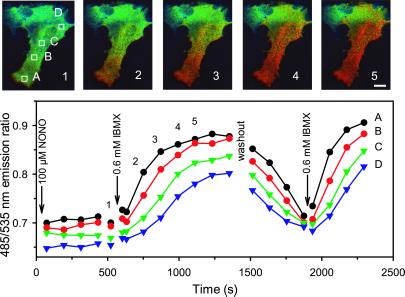
A small subset of RFL cells (3 of 76) stimulated with the NO donor alone or with IBMX responded with the formation of a slowly propagating tide of cGMP spreading from one end of the cell at about 0.4–1.3 μm/s (Fig. 5 and Movie 1, which is published as supplemental data on the PNAS web site, www.pnas.org). On washout of the stimuli, the tide receded back to its starting point before disappearing. Such cGMP tides have not yet been observed in response to CNP. Preliminary experiments with direct microinjection of cGMP suggest that the slow propagation is not due to slow diffusion of cGMP or slow indicator kinetics, because localized microinjection of a bolus of cGMP gives an immediate optical response near the site of injection and much faster spread through the rest of the cell than the NO-stimulated tide. A more likely explanation for the latter is that the two ends of the cell have different ratios of sGC to PDE. As the NO donor progressively activates the sGC and the IBMX inhibits the PDE, the balance between the two enzymes shifts at different rates across the cell, giving the appearance of a propagating wave front.
Figure 5.
cGMP wave in RFL cells. (Upper) Fluorescence ratio image of a RFL cell shown at various times (1–5) during a stimulation with 0.1 mM NONO and 0.6 mM IBMX, monitored every 20 s by digital imaging microscopy. The cGMP concentration increase is not uniform, but rather proceeds directionally along the axis of the cell. (Lower) Comparison of response time curves at various locations (A–D) in the cell after stimulation with NONO and IBMX. (Scale bar = 20 μm.)
Purkinje Cells.
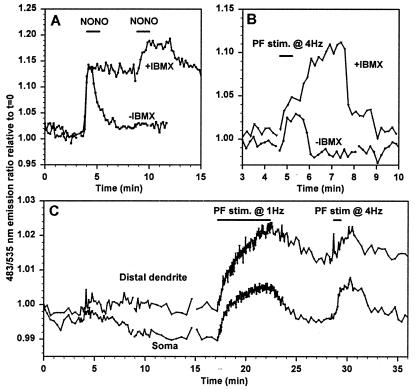
Acute cerebellar slices were transfected with cygnet-2 by ballistic particle injection and placed in organotypic culture for 48–72 h. We then imaged Purkinje neurons expressing cygnet-2 and recorded cGMP transients evoked either by pharmacological agents or synaptic stimulation. Fig. 6A compares the responses to two pulses of 0.1-mM NONO applied to the same cell, one before and one after addition of IBMX. Both pulses produced a rapid increase in cGMP. The decay in cGMP on NONO washout was very rapid in the absence of IBMX and much slower after IBMX, indicating that Purkinje cells have the considerable PDE activity required to handle large and fast cGMP signals.
Figure 6.
Imaging of cGMP in Purkinje neurons. Emission ratios (483/535 nm) indicating cGMP concentrations were imaged in cygnet-2-transfected cerebellar Purkinje neurons in organotypic culture. (A) cGMP responses to 0.1 mM NONO (indicated by the bar) without and with 0.6 mM IBMX (−IBMX and +IBMX). Both traces are from the soma of the same cell. (B) cGMP transients responses to 4 Hz parallel fiber stimulation (duration indicated by the bar) without and with IBMX in the medium. Both traces are from the same cell. (C) Comparison of cGMP responses to different frequencies and duration of parallel fiber stimulation in the soma and distal dendrites.
Experiments with inhibitors of sGC and cGPK and with caged cGMP have provided much evidence that parallel fiber activity causes NO and cGMP production, which play crucial roles in the induction of long-term depression of the parallel fiber-Purkinje neuron synapse (31, 32). However, direct observations of cGMP increases in response to synaptic stimulation have not yet been reported. Fig. 6B shows stimulation for 30 s at 4 Hz of parallel fibers contacting a transfected Purkinje cell. Such stimulation can induce long-term potentiation of the parallel fiber–Purkinje neuron synapse (33). This protocol elicited a short cGMP transient, which surprisingly continued to rise after the end of the stimulation. The transient was larger and longer when stimulation was repeated in the presence of 0.6 mM IBMX, but still decayed eventually, suggesting that Purkinje cells have some residual PDE activity not inhibited by this dose of IBMX. Stimulation of parallel fibers at 1 Hz can either give long-term depression or potentiation, depending on the duration of the stimulus train and whether it is paired with cytosolic Ca2+ increases.‖ We compared 1 Hz vs. 4 Hz stimulation frequencies in Fig. 6C. The cGMP transient resulting from 1 Hz stimulation stopped increasing at the end of the spike train, unlike the overshoot in response to 4 Hz (Fig. 6 B and C). Perhaps the higher stimulation frequency causes higher and more persistent Ca2+ and NOS activation either in the parallel fibers or neighboring cells. Fig. 6C also shows that cGMP transients can be imaged separately in distal dendrites and soma. However, more experiments will be needed to determine what systematic variations in cGMP metabolism exist in different compartments of these highly branched neurons.
Discussion
Despite of the importance of cGMP as a second messenger, the spatiotemporal dynamics of cGMP in individual living cells have remained unknown. Traditional destructive cGMP assays on cell populations only measure total rather than free cGMP, ignore all spatial localizations, and often require PDE inhibition to obtain adequate sensitivity (34). A few attempts have been made to localize cGMP in dead fixed tissue by immunohistochemistry (e.g., see ref. 35), but such methods are ill-suited to constructing time courses, and have been difficult to quantify. A micropipet bearing an inside-out membrane patch containing cyclic-nucleotide-gated channels from one cell type can be “crammed” inside another cell whose cGMP is to be monitored (36). This “patch-cramming” approach is ingenious, but very laborious and limited to a single spatial location. The limitations of these approaches prompted our efforts to develop a genetically encoded fluorescent indicator for cGMP that would permit nondestructive spatial imaging of free cGMP. While our work was in preparation, Sato et al. (13) published an independent report of cGMP indicators analogous to cygnet-1, except that their truncation in the cGPK consisted of residues 1–47 rather than 1–77. Their indicators surprisingly increased FRET in response to cGMP, producing an emission ratio change roughly equal, but opposite to those of the cygnets. In HEK-293 cells, they observed cGMP responses to NO donors and PDE inhibition comparable to those in Fig. 4A. These results indicate the multiple ways in which genetically encoded indicators can be constructed and the need for empirical testing and optimization. Perhaps the most severe limitation of both families of cGMP indicators is the relatively small dynamic range of the emission ratio change, currently at most 1.4- to 1.5-fold and often somewhat less inside cells. Nevertheless, this dynamic range is comparable to the first generation of cAMP indicators (11, 12), even though the latter undergo complete dissociation on ligand binding. Another challenge will be to improve our ability to calibrate emission ratios in terms of absolute cGMP concentrations. Preliminary attempts to use putative cGMP antagonists such as Rp-cGMPS to clamp cells at effectively 0 cGMP have not been promising. A permeabilization procedure enabling equilibration with extracellular cGMP would be desirable.
These initial observations with cygnets have already revealed some biological surprises: Considerable heterogeneity between individual RFL cells, especially in response to NO; variable lag times before the onset of detectable responses; and occasional spatial gradients that looked like cGMP tides as they slowly traveled across cells. Purkinje cells responded much more rapidly, as is appropriate for cells with high levels of cGMP synthesis and breakdown. The flexibility of genetically encoded indicators should permit much more detailed investigation of cGMP signaling in a wide variety of cell types.
Supplementary Material
Acknowledgments
We thank Charles Y. Cho and Scott B. Hansen for participation in some experiments and Qing Xiong for cell culture. This work was supported by the National Science Foundation (MCB-9983097), the Lake Champlain Cancer Research Organization and the Totman Medical Research Trust (to W.R.G.D.), American Heart Association Grant 9920260T (to A.H.), National Institutes of Health Grant NS27177 (to R.Y.T.), and the Howard Hughes Medical Institute (R.Y.T.). Some of the work included here was conducted at the National Center for Microscopy and Imaging Research, which is supported by National Institutes of Health Grant RR04050 (to Mark H. Ellisman).
Abbreviations
- cGMP
guanosine 3′,5′-cyclic monophosphate
- cGPK
cGMP-dependent protein kinase
- FRET
fluorescence resonance energy transfer
- ECFP and EYFP
enhanced cyan and yellow fluorescent protein
- PDE
phosphodiesterase
- RFL
rat fetal lung fibroblast
- NONO
sodium salt of 1,1-diethyl-2-hydroxy-2-nitrosohydrazine
- CNP
C-type natriuretic peptide
- IBMX
3-isobutyl-1-methylxanthine
- sGC
soluble guanylyl cyclase
Footnotes
Honda, A., Ellenberger, C. L., Cho, C. Y., Adams, S. R., Tsien, R. Y. & Dostmann, W. R. G. (2000) Biophys. J. 78, 884 (abstr.).
Lev-Ram, V. & Tsien, R. Y. (1999) Soc. Neurosci. Abstr. 25, 785 (abstr. 314.8).
References
- 1.Juilfs D M, Soderling S, Burns F, Beavo J A. Rev Physiol Biochem Pharmacol. 1999;135:67–104. doi: 10.1007/BFb0033670. [DOI] [PubMed] [Google Scholar]
- 2.Pfeifer A, Ruth P, Dostmann W, Sausbier M, Klatt P, Hofmann F. Rev Physiol Biochem Pharmacol. 1999;135:105–149. doi: 10.1007/BFb0033671. [DOI] [PubMed] [Google Scholar]
- 3.Lincoln T M, Komalavilas P, Boerth N J, MacMillan-Crow L A, Cornwell T L. Adv Pharmacol. 1995;34:305–322. doi: 10.1016/s1054-3589(08)61094-7. [DOI] [PubMed] [Google Scholar]
- 4.Biel M, Zong X, Sautter A, Hofmann F. Rev Physiol Biochem Pharmacol. 1999;135:151–172. doi: 10.1007/BFb0033672. [DOI] [PubMed] [Google Scholar]
- 5.Eigenthaler M, Lohmann S M, Walter U, Pilz R B. Rev Physiol Biochem Pharmacol. 1999;135:173–209. doi: 10.1007/BFb0033673. [DOI] [PubMed] [Google Scholar]
- 6.Foster D C, Wedel B J, Robinson S W, Garbers D L. Rev Physiol Biochem Pharmacol. 1999;135:1–40. doi: 10.1007/BFb0033668. [DOI] [PubMed] [Google Scholar]
- 7.Koesling D, Friebe A. Rev Physiol Biochem Pharmacol. 1999;135:41–66. doi: 10.1007/BFb0033669. [DOI] [PubMed] [Google Scholar]
- 8.Zacharias D A, Baird G S, Tsien R Y. Curr Opin Neurobiol. 2000;10:416–421. doi: 10.1016/s0959-4388(00)00101-x. [DOI] [PubMed] [Google Scholar]
- 9.Miyawaki A, Llopis J, Heim R, McCaffery J M, Adams J A, Ikura M, Tsien R Y. Nature (London) 1997;388:882–887. doi: 10.1038/42264. [DOI] [PubMed] [Google Scholar]
- 10.Miyawaki A. Methods Enzymol. 2000;327:472–500. doi: 10.1016/s0076-6879(00)27297-2. [DOI] [PubMed] [Google Scholar]
- 11.Zaccolo M, De Giorgi F, Cho C Y, Feng L, Knapp T, Negulescu P A, Taylor S S, Tsien R Y, Pozzan T. Nat Cell Biol. 2000;2:25–29. doi: 10.1038/71345. [DOI] [PubMed] [Google Scholar]
- 12.Adams S R, Harootunian A T, Buechler Y J, Taylor S S, Tsien R Y. Nature (London) 1991;349:694–697. doi: 10.1038/349694a0. [DOI] [PubMed] [Google Scholar]
- 13.Sato M, Hida N, Ozawa T, Umezawa Y. Anal Chem. 2000;72:5918–5924. doi: 10.1021/ac0006167. [DOI] [PubMed] [Google Scholar]
- 14.Heikal A A, Hess S T, Baird G S, Tsien R Y, Webb W W. Proc Natl Acad Sci USA. 2000;97:11996–12001. doi: 10.1073/pnas.97.22.11996. [DOI] [PMC free article] [PubMed] [Google Scholar]
- 15.Wernert W, Flockerzi V, Hofmann F. FEBS Lett. 1989;251:191–196. doi: 10.1016/0014-5793(89)81453-x. [DOI] [PubMed] [Google Scholar]
- 16.McAllister A K, Lo D C, Katz L C. Neuron. 1995;15:791–803. doi: 10.1016/0896-6273(95)90171-x. [DOI] [PubMed] [Google Scholar]
- 17.Kerr R, Lev-Ram V, Baird G, Vincent P, Tsien R Y, Schafer W R. Neuron. 2000;26:583–594. doi: 10.1016/s0896-6273(00)81196-4. [DOI] [PubMed] [Google Scholar]
- 18.Monken C E, Gill G N. J Biol Chem. 1980;255:7067–7070. [PubMed] [Google Scholar]
- 19.Surks H K, Mochizuki N, Kasai Y, Georgescu S P, Tang K M, Ito M, Lincoln T M, Mendelsohn M E. Science. 1999;286:1583–1587. doi: 10.1126/science.286.5444.1583. [DOI] [PubMed] [Google Scholar]
- 20.Aitken A, Hemmings B A, Hofmann F. Biochim Biophys Acta. 1984;790:219–225. doi: 10.1016/0167-4838(84)90025-6. [DOI] [PubMed] [Google Scholar]
- 21.Zhao J, Trewhella J, Corbin J, Francis S, Mitchell R, Brushia R, Walsh D. J Biol Chem. 1997;272:31929–31933. doi: 10.1074/jbc.272.50.31929. [DOI] [PubMed] [Google Scholar]
- 22.Heil W G, Landgraf W, Hofmann F. Eur J Biochem. 1987;168:117–121. doi: 10.1111/j.1432-1033.1987.tb13395.x. [DOI] [PubMed] [Google Scholar]
- 23.Dostmann W R G, Koep N, Endres R. FEBS Lett. 1996;398:206–210. doi: 10.1016/s0014-5793(96)01242-2. [DOI] [PubMed] [Google Scholar]
- 24.Ruth P, Pfeifer A, Kamm S, Klatt P, Dostmann W R G, Hofmann F. J Biol Chem. 1997;272:10522–10528. doi: 10.1074/jbc.272.16.10522. [DOI] [PubMed] [Google Scholar]
- 25.Dostmann W R G. Habilitationsschrift. München: Technische Universität; 1996. [Google Scholar]
- 26.Feil R, Kellermann J, Hofmann F. Biochemistry. 1995;34:13152–13158. doi: 10.1021/bi00040a029. [DOI] [PubMed] [Google Scholar]
- 27.Ruth P, Landgraf W, Keilbach A, May B, Egleme C, Hofmann F. Eur J Biochem. 1991;202:1339–1344. doi: 10.1111/j.1432-1033.1991.tb16509.x. [DOI] [PubMed] [Google Scholar]
- 28.Keilbach A, Ruth P, Hofmann F. Eur J Biochem. 1992;208:467–473. doi: 10.1111/j.1432-1033.1992.tb17209.x. [DOI] [PubMed] [Google Scholar]
- 29.Schlichter D J, Detre J A, Aswad D W, Chehrazi B, Greengard P. Proc Natl Acad Sci USA. 1980;77:5537–5541. doi: 10.1073/pnas.77.9.5537. [DOI] [PMC free article] [PubMed] [Google Scholar]
- 30.Maragos C M, Morley D, Wink D A, Dunams T M, Saavedra J E, Hoffman A, Bove A A, Isaac L, Hrabie J A, Keefer L K. J Med Chem. 1991;34:3242–3247. doi: 10.1021/jm00115a013. [DOI] [PubMed] [Google Scholar]
- 31.Lev-Ram V, Makings L R, Keitz P F, Kao J P Y, Tsien R Y. Neuron. 1995;15:407–415. doi: 10.1016/0896-6273(95)90044-6. [DOI] [PubMed] [Google Scholar]
- 32.Lev-Ram V, Jiang T, Wood J, Lawrence D S, Tsien R Y. Neuron. 1997;18:1025–1038. doi: 10.1016/s0896-6273(00)80340-2. [DOI] [PubMed] [Google Scholar]
- 33.Salin P A, Malenka R C, Nicoll R A. Neuron. 1996;16:797–803. doi: 10.1016/s0896-6273(00)80099-9. [DOI] [PubMed] [Google Scholar]
- 34.Leitman D C, Murad F. Biochim Biophys Acta. 1986;885:74–79. doi: 10.1016/0167-4889(86)90040-6. [DOI] [PubMed] [Google Scholar]
- 35.Barsony J, Marx S J. Proc Natl Acad Sci USA. 1990;87:1188–1192. doi: 10.1073/pnas.87.3.1188. [DOI] [PMC free article] [PubMed] [Google Scholar]
- 36.Trivedi B, Kramer R H. Neuron. 1998;21:895–906. doi: 10.1016/s0896-6273(00)80604-2. [DOI] [PubMed] [Google Scholar]
Associated Data
This section collects any data citations, data availability statements, or supplementary materials included in this article.


